Industry sponsorship bias in cost effectiveness analysis: registry based analysis
BMJ 2022; 377 doi: https://doi.org/10.1136/bmj-2021-069573 (Published 22 June 2022) Cite this as: BMJ 2022;377:e069573Linked Editorial
Promoting confidence in cost-effectiveness analyses

- 1Department of Health Research Methods, Evidence, and Impact, Faculty of Health Sciences, McMaster University, Hamilton, ON, Canada
- 2Centre for Health Economics and Policy Analysis, Faculty of Health Sciences, McMaster University, Hamilton, ON, Canada
- 3Centre for Pharmacoeconomics and Outcome Research, China Pharmaceutical University, Nanjing, China
- Correspondence to: F Xie fengxie{at}mcmaster.ca
- Accepted 4 May 2022
Abstract
Objective To assess the association between industry sponsorship (drug, medical device, and biotechnology companies) and cost effectiveness results in cost effectiveness analysis (CEA).
Design Registry based analysis
Data source The Tufts Cost-Effectiveness Analysis Registry was used to identify all CEAs published in Medline between 1976 and 2021.
Eligibility criteria for selecting studies CEAs that reported incremental cost effectiveness ratio (ICER) using quality adjusted life year and provided sufficient information about the magnitude or location of the ICER.
Methods Descriptive analyses were used to describe and compare the characteristics of CEAs with and without industry sponsorship. Logistic regression was used to identify the association between industry sponsorship and the cost effective conclusion using selected threshold values ($50 000 (£40 511; €47 405), $100 000, and $150 000). Robust linear regression was used to assess the association between industry sponsorship and the magnitude of ICER. All regression analyses were adjusted for disease and study design characteristics.
Results 8192 CEAs were eligible and included in the analysis, with 2437 (29.7%) sponsored by industry. Industry sponsored CEAs were more likely to publish ICERs below $50 000 (adjusted odds ratio 2.06, 95% confidence interval 1.82 to 2.33), $100 000 (2.95, 2.52 to 3.44), and $150 000 (3.34, 2.80 to 3.99) than non-industry sponsored studies. Among 5877 CEAs that reported positive incremental costs and quality adjusted life years, ICERs from industry sponsored studies were 33% lower (95% confidence interval −40 to −26) than those from non-industry sponsored studies.
Conclusions Sponsorship bias in CEAs is significant, systemic, and present across a range of diseases and study designs. Use of CEAs conducted by independent bodies could provide payers with more ability to negotiate lower prices. This impartiality is especially important for countries that rely on published CEAs to inform policy making for insurance coverage because of limited capacity for independent economic analysis.
Introduction
Global health systems are dealing with using scarce resources to cover healthcare services due to the rising demand and marketing of expensive drugs. Cost effectiveness evidence has been widely accepted and used to inform price negotiation and healthcare insurance coverage policy making. In fact, manufacturers of new medicines are required to submit cost effectiveness analysis (CEA) when applying for coverage approval by public or private payers in many countries. As a result, the literature for economic evaluations has expanded rapidly over the past decades. Previous studies have found that about 20% of published CEAs were funded by the drug industry.12
Seeking insurance coverage approval is strategically and financially important for industry. A new drug or device covered by insurance plans can generate much higher profit than those without such coverage. Industry’s economic ties to insurance coverage approval could lead to sponsorship bias in CEAs. Evidence has consistently shown that industry-funded economic evaluations were more likely to report favourable cost effectiveness results to the sponsor.12345678910 Most of the published studies, however, were limited to specific diseases or treatments—for example, cancer,267910 antidepressants,3 herpes zoster vaccine,5 and statins.4 The most recent analysis of bias in cost effectiveness studies based on systematic literature review was published more than 15 years ago.1 Given the increasingly important role of CEAs in coverage policy making, up-to-date analysis on sponsorship bias is needed. We therefore conducted a systematic and comprehensive assessment on the sponsorship bias in CEAs by quantifying the association between industry sponsorship and incremental cost effectiveness ratio (ICER).
Methods
Data source
We used the Tufts Cost-Effectiveness Analysis Registry as the data source for the analysis. The registry uses the systematic literature review approach to identify, select, and review original, English language, CEA studies published and indexed in Medline since 1976.11 This registry is one of the most comprehensive databases for CEAs published in peer reviewed journals and contains more than 10 000 records. The registry extracted key characteristics of CEAs, including publication year, country, disease, intervention, comparator, time period, perspective, patient population, incremental cost, incremental effect, ICER, sponsorship, and author affiliations. Our analysis included all eligible CEAs published between 1976 and March 2021 (the latest recorded entry in the registry was 25 November 2021).
CEA sponsorship
Study sponsorships were recorded into seven categories in the registry—namely, industry (that is, drug, medical device, and biotechnology companies), government, non-profit organisations, healthcare organisations, professional membership organisations, no sponsorship, or sponsorship not stated. A CEA was identified as industry sponsored if it was funded partly or completely by industry. We used the term non-industry sponsored for any other type of sponsorship.
Incremental cost effectiveness ratio
ICER is a key summary outcome measure in CEA. To be eligible for our study, a CEA needed to report ICER using incremental cost per quality adjusted life year, a metric that allows for comparisons across studies, and to provide sufficient information about the magnitude or location of the ICER on the cost effectiveness plane for accurate interpretation. The ICER is recorded as a continuous value in the registry whenever available. More than one ICER might be reported in a CEA because of, for example, multiple comparators and sensitivity analyses. In the primary analysis, we included only one ICER for each study, the first one recorded in the registry, which was usually a base-case estimate. In a sensitivity analysis, we included all ICERs from the same study. In the registry, all eligible ICERs identified were adjusted to 2021 US dollars using the Consumer Price Index and exchange currency rate.
Definitions of disease and variables
Key variables that define the scope of CEA and affect the estimate of ICER were selected and included in the analyses. The primary diseases, categorised according to ICD-10 (international classification of diseases, 10th revision) codes, were cancer; circulatory system diseases; infectious and parasitic diseases; musculoskeletal and connective tissue diseases; endocrine, nutritional, and metabolic diseases; mental and behaviour, and neurodevelopmental disorders; nervous system diseases; respiratory system diseases; and others. Regions were categorised into North America, Europe and central Asia, and others (including east Asia and Pacific, Latin America and Caribbean, Middle East and north Africa, south Asia, and sub-Saharan Africa). Several variables were dichotomised: time horizon (lifetime v non-lifetime), perspective (societal and non-societal (ie, healthcare payer, healthcare sector, not stated, or other)), type of intervention (drugs v non-drugs), and study design (trial based v model based). In addition, we included year of publication (1976-99, 2000-09, and 2010-21) and the quality score assigned by the registry, ranging from 0 (low) to 7 (high) with 0.5 increments, based on the overall quality of the method and reporting.12
Statistical analyses
We described all included CEAs with and without industry sponsorship in terms of disease and methodological characteristics. Additionally, the distributions of these ICERs are presented according to commonly used threshold values of $50 000 (£40 511; €47 405), $100 000, and $150 000.113 We compared the proportions of industry sponsored and non-industry sponsored CEAs using Pearson’s χ2 test.
We used multiple logistic regressions to assess the association between industry sponsorship and the cost effective conclusion. The dependent variable was whether the intervention was considered cost effective—namely, the reported ICER is below or above the threshold value. For this regression analysis, all ICERs were included. Adjusted odds ratios with 95% confidence interval are reported.
We used robust multiple linear regression models to assess the association between industry sponsorship and the magnitude of ICER. For this analysis, we focused on the ICERs that showed that the intervention was more effective and more expensive than the comparator for two reasons. Firstly, most ICERs were in this category, which reflects a typical profile of most new treatments with regulatory approval. The magnitude of these ICERs affects price negotiation and policy making. Secondly, when the intervention is more effective and cheaper (ie, cost saving), or less effective and more expensive (ie, dominated) than the comparator, the magnitude of ICER is less relevant. ICERs with an intervention being less effective and cheaper are possible. However, only a small number of ICERs were in this category for which the interpretation of the magnitude is in the opposite direction, and thus we excluded them as well.
In the linear regression, the natural log transformed ICER was used as the dependent variable owing to the skewed distribution of the ICERs (a few extremely high ICERs were found >$10m per quality adjusted life year). When reporting the model results, we transformed all the coefficients back to the original scale and reported the proportional change in ICER between industry and non-industry sponsored CEAs.14 In the sensitivity analyses, we removed all ICERs of >$10m and included all ICERs reported from the same CEA, while taking into account the correlation of these ratios.
The disease and methodological variables were adjusted in all regression analyses and used to define subgroups for which we first conducted interaction tests. Variables with statistical significance were then included in the subgroup analyses. We used the Bonferroni adjustment to minimise the risk of spurious significant findings purely because of chance.15 Therefore, a two tailed threshold of P<0.0022 (ie, 0.05/23) was considered significant. All analyses were conducted using Stata/MP 14.0 (StataCorp, TX).
Patient and public involvement
This study was a registry based analysis and therefore no patients were involved in setting the research question or the outcome measures, nor were they involved in developing plans for design or implementation of the study. No patients were asked to advise on interpretation or writing up of results.
Results
Description of included CEAs
Of 10 002 CEAs included in the registry, 1810 did not provide sufficient information on an ICER and were excluded. As a result, 8192 CEAs were included in our analyses, with 2437 (29.7%) sponsored by industry. Most CEAs were published in the past 10 years and adopted non-lifetime horizon, non-societal perspective, and model based approach. Compared with non-industry sponsored studies, higher proportions of industry sponsored CEAs used a lifetime horizon and non-societal perspective, were conducted outside of North America, involved drug interventions, and had a quality rating score >5 (table 1).
Characteristics of industry and non-industry sponsored cost effectiveness analyses (n=8192)
A total of 5877 (71.7%) of 8192 CEAs reported that the intervention was more effective and more expensive than the comparator. Overall, 1715 (20.9%) CEAs reported that the intervention was better and cheaper (ie, cost saving), whereas 410 (5.0%) reported that the intervention was less effective but more expensive than the comparator (ie, dominated). In 190 (2.3%) studies the intervention was less effective and less expensive than the comparator.
Of ICERs with industry sponsorship, 78.1% were below $50 000 per quality adjusted life year versus 65.4% for non-industry sponsored CEAs (fig 1). By contrast, 7.3% of ICERs from industry sponsored CEAs were more than $150 000 or dominated compared with 19.2% from the CEAs without industry sponsorship.

Distributions of incremental cost effectiveness ratios (ICERs). 190 ICERs with both negative incremental cost and negative incremental quality adjusted life years (QALYs) were excluded because the interpretation of the magnitude of these ICERs, according to a threshold, is in the opposite direction compared with other positive ICERs. Cost saving=intervention was better and cheaper than the comparator. Dominated=intervention was less effective but more expensive than the comparator
Industry sponsorship and cost effective conclusion
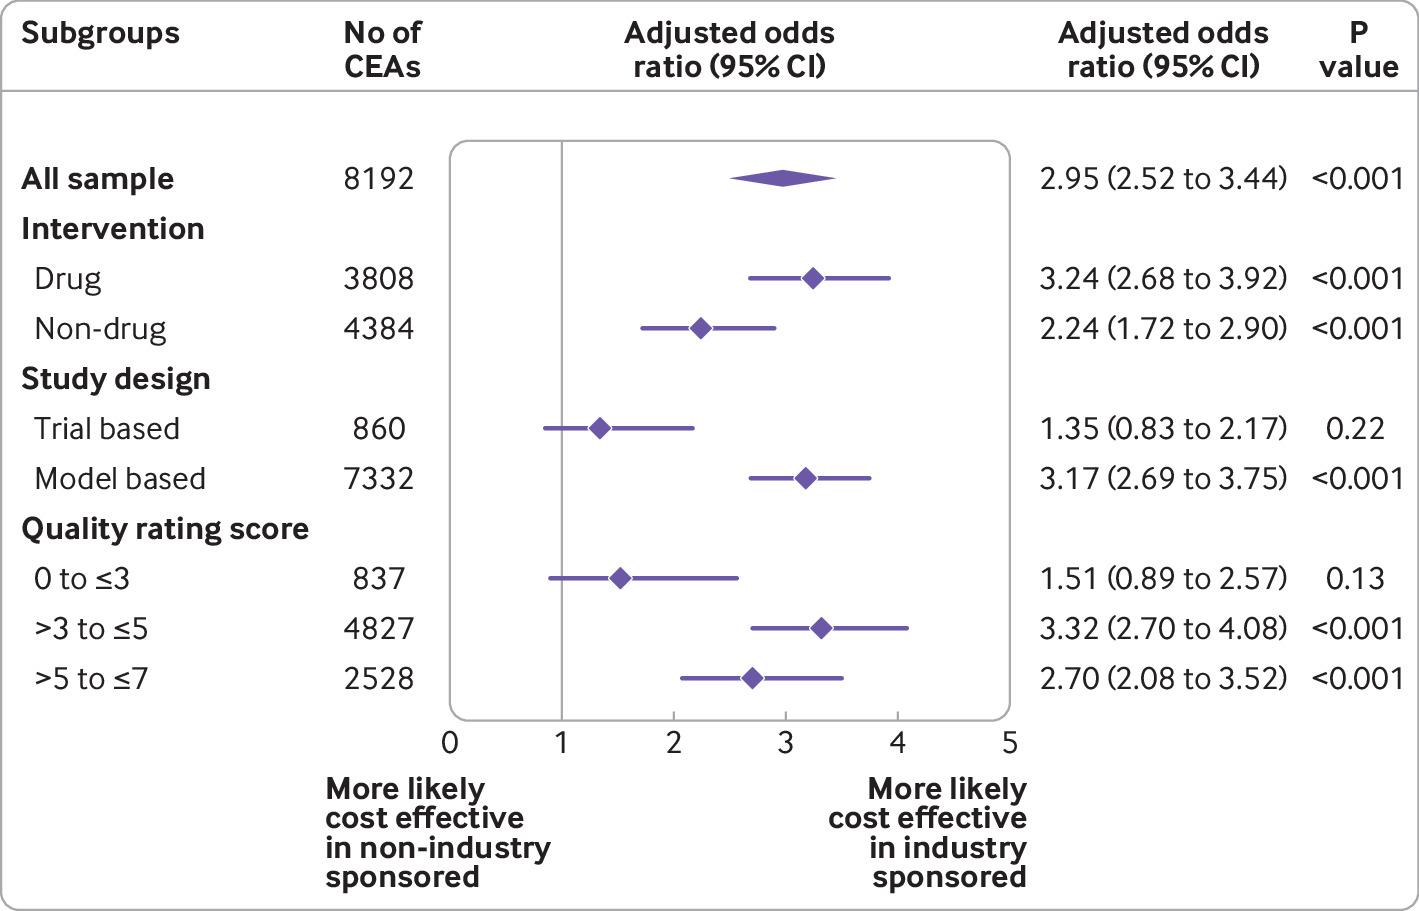
All 8192 CEAs were included in the logistic regression. Industry sponsored CEAs were more likely than non-industry sponsored CEAs to conclude that the intervention was cost effective than the comparator if the threshold was $50 000 (adjusted odds ratio 2.06, 95% confidence interval 1.82 to 2.33), $100 000 (2.95, 2.52 to 3.44), and $150 000 (3.34, 2.80 to 3.99). If all ICERs from the same CEA were included (n=24 010), the adjusted odds ratios were 1.96 at the threshold of $50 000, 2.27 at $100 000, and 2.36 at $150 000 (all P<0.001).
Subgroup analyses on studies with significant interaction tests are shown in figure 2, figure 3, and figure 4. Across all threshold values, significant sponsorship bias occurred in CEAs for drug interventions, based on model study design, and with a quality score of >3. Additionally, industry sponsored CEAs on cancer, circulatory, infectious and parasitic, endocrine, nutritional and metabolic diseases, and mental disorders, were more likely to report that the intervention was cost effective than the comparator at the threshold of $50 000. Industry sponsored CEAs conducted outside of North America were also more likely to report that the intervention was cost effective at the threshold of $50 000 (adjusted odds ratios 2.19 for Europe and central Asia and 2.56 for other regions v 1.75 in North America; all P<0.001).

Association between industry sponsorship and reported incremental cost effectiveness ratios below $50 000 (£40 511, €47 405) per quality adjusted life year. CI=confidence interval

Association between industry sponsorship and reported incremental cost effectiveness ratios below $100 000 (£81 023, €94 810) per quality adjusted life year. CI=confidence interval

Association between industry sponsorship and reported incremental cost effectiveness ratios below $150 000 (£121 535, €142 215) per quality adjusted life year. CI=confidence interval
Industry sponsorship and magnitude of ICERs
A total of 5877 CEAs that reported positive ICERs, with the intervention being more effective and more expensive than the comparator, were included in the linear regression. The ICER from industry sponsored CEAs was 33% lower (95% confidence interval −40 to −26) than that from non-industry sponsored CEAs (fig 5). When ICERs of >$10m (n=20) were removed, the ICER from industry sponsored CEAs was 32% lower (−39 to −25) than that from non-industry sponsored CEAs. When all ICERs from the same study were included (n=17 226), the ratio from industry sponsored studies was 36% lower (95% confidence interval −45 to −27) than that for the non-industry sponsored studies. Significant subgroup effects were noted in CEAs on cancer, circulatory, endocrine, nutritional and metabolic disorders, and other diseases, conducted in North America and Europe and central Asia, for drugs, based on model study design, and with a quality rating score >3 (fig 5).

Association between industry sponsorship and magnitude of incremental cost effectiveness ratios (ICERs). ICERs with positive incremental cost and positive incremental quality adjusted life years were included (n=5877). CI=confidence interval
Discussion
We analysed the relationship between industry sponsorship and CEA results in all eligible studies included in the Tufts CEA Registry. We found that CEAs sponsored by industry were significantly more likely to report that the intervention was cost effective than the comparator at a wide range of commonly used threshold values compared with studies without this sponsorship. Among CEAs reporting that the intervention was more effective but at higher costs, the incremental cost per quality adjusted life year was about 33% lower in industry sponsored studies than those without industry sponsorship after adjusting for key disease and study design characteristics. The evidence strongly shows that sponsorship bias is significant in CEAs. The bias is systemic and exists, to vary degrees, across a wide range of diseases and study designs.
Generally, published CEAs, both industry sponsored and non-industry sponsored, tended to adopt a non-lifetime horizon and non-societal perspective. However, higher proportions of industry sponsored studies used a lifetime horizon than did non-industry sponsored studies (44.4% v 40.5%). By contrast, lower proportions of industry sponsored studies used a societal perspective than did non-industry sponsored studies (13.2% v 18.8%). A possible explanation for this discrepancy is that industry funded studies might be more likely to follow the guidelines from Health Technology Assessment agencies, which usually recommend a lifetime horizon and the payer’s perspective.
CEAs on drugs accounted for almost three quarters of industry sponsored studies compared with just over a third among non-industry sponsored studies. The subgroup analyses showed that one of the largest sponsorship biases occurred in CEAs on drugs. Drug cost is usually a driving factor for the ICER. Higher ICERs would allow payers to negotiate for lower drug prices, which is a key to sustaining healthcare systems worldwide.
Economic models have been commonly used in CEAs. Among model-based studies, industry sponsored studies reported significantly lower ICERs and were more likely to conclude that the intervention was cost effective than the comparator, whereas no significant difference was reached in trial-based studies. Trial-based approaches analyse cost and effectiveness based on patient level data collected alongside the clinical trial. Requirements for trial registration have greatly improved the quality and transparency of trial conduct and reporting, which also benefit trial-based CEAs. Model-based analyses often require inputs from multiple, heterogeneous sources to make long term extrapolations or projections. Industry sponsored studies tended to choose inputs to generate cost effectiveness results in favour of their products.1617 This highlights that systematically identifying and choosing from published data with full transparency and justification is critical to minimise the bias in conducting model-based CEAs.18
Strengths and limitations of this study
The sponsorship bias in CEAs has been reported previously. Evidence has consistently shown that significant association between industry sponsorship and favourable cost effectiveness results to the sponsor. Previous studies of cost effectiveness have been limited in the scope of the investigation by focusing only on specific diseases or interventions.3456791019 Our analysis offers a systematic and comprehensive assessment on the sponsorship bias by analysing all eligible CEAs published since 1976. Previously published studies used selected categories to rate the qualitative cost effectiveness conclusion as favourable, neutral, or unfavourable, either based on the statement made in the original study4579101920 or by applying selected cost effectiveness thresholds.136 Our study did similar analyses that are relatively easier for interpretation and allow for comparison with previous investigations. Moreover, we also assessed the association between the sponsorship and the magnitude of the ICER. This quantifies the impact of the sponsorship bias independent of the threshold values, which could be useful to understand the implication of the bias, especially in many countries where no such thresholds have been adopted.
Generally, our analyses are limited to the available information recorded in the registry. We only used the first recorded ICER, usually a base-case estimate, from each CEA in our analyses. However, more than one base-case estimate might have been available in some CEAs (eg, multiple comparators). The registry listed all reported ICERs, but no further information was recorded. Our sensitivity analyses including all ICERs showed similar results. Adaptations of CEAs might exist for the same treatment in different countries. Model adaptations usually choose the study design and data inputs to reflect local clinical practice and policy making contexts. Therefore, we consider it reasonable to treat model adaptions as separate CEAs in our analyses. Another limitation is that the selection of comparator could also affect the estimate of ICERs. We could not, however, assess the appropriateness of the comparator because this information is not available in the registry.
Publication bias
About 70% of published ICERs were below $50 000 versus only about 20% above $100 000, indicating a publication bias against CEAs with unfavourable results based on commonly used standards of cost effectiveness. This publication bias is strikingly similar to what was observed 15 years ago when there were 68% of ICERs below $50 000 versus 21% above $100 000.1 Moreover, publication bias has become more severe among industry sponsored studies. If publication bias was considered, then sponsorship bias could be worse than what we found.
Policy implications
Many payers require the submission of CEA in the coverage application. As a result, industry has become one of the main sponsors for CEAs. New treatments with lower ICERs are more likely to receive insurance coverage approval, leading to substantial financial gain for the manufacturer. Among countries that use CEAs to inform coverage policy making, with or without use of thresholds, using CEAs conducted by independent bodies is necessary and important. Everything else being equal, with higher ICERs, payers will have more room to negotiate for lower prices. For some health technology assessment agencies, such as the National Institute for Health and Care Excellence in the UK and the Institute for Clinical and Economic Review in the US, CEAs conducted by academic institutions have already been used to inform their coverage or pricing recommendations. However, other payers, especially in low income and middle income countries, have to rely on published CEAs to make coverage decisions because the capacity to conduct an independent CEA is limited. The sponsorship bias might lead to higher drug prices in these countries where resources to pay for healthcare are scarce.
Conclusions
Our analyses showed a significant sponsorship bias in CEAs that is systemic and exists across a range of diseases and study designs. Use of CEAs conducted by independent bodies could provide payers with more ability to negotiate for lower prices. This impartiality is especially important for countries that rely on published CEAs to inform pricing and coverage policy making due to limited economic analysis capacity.
What is already known on this topic
Industry (drug, medical device, and biotechnology companies) is one of the major sponsors for cost effectiveness analysis (CEA) that are used to inform price negotiation and insurance coverage policy making
Published research has shown sponsorship bias in CEAs, but most of these studies were limited in scope and were outdated
What this study adds
Sponsorship bias in CEAs is significant and is present across a range of diseases and study designs
Industry sponsored CEAs were significantly more likely to report incremental cost effectiveness ratios below commonly used thresholds than were CEAs without this sponsorship
Incremental cost effectiveness ratios from industry sponsored CEAs were 33% lower than those from CEAs without this sponsorship
Ethics statements
Ethical approval
Not required.
Data availability statement
No additional data available.
Footnotes
Contributors: FX contributed to the conception and design of the study, interpreted the data, and drafted and revised the article. TZ analysed and interpreted the data and revised the article critically for important intellectual content. FX is the guarantor. The corresponding author attests that all listed authors meet authorship criteria and that no others meeting the criteria have been omitted.
Funding: None.
Competing interests: All authors have completed the ICMJE uniform disclosure form at www.icmje.org/coi_disclosure.pdf and declare: no support from any organisation for the submitted work; no financial relationships with any organisations that might have an interest in the submitted work in the previous three years; no other relationships or activities that could appear to have influenced the submitted work.
The lead author (FX) affirms that the manuscript is an honest, accurate, and transparent account of the study being reported; that no important aspects of the study have been omitted; and that any discrepancies from the study as planned (and, if relevant, registered) have been explained.
Dissemination to participants and related patient and public communities: The extensive study level analysis required for this research made it difficult to find and include patients and members of the public who were untrained in systematic review and cost effectiveness analysis methods. We plan to use press release, social media, and a plain language summary to disseminate the findings. We will also present this study at webinars to disseminate the finding among clinicians, health economists, and policy makers.
Provenance and peer review: Not commissioned; externally peer reviewed.
This is an Open Access article distributed in accordance with the Creative Commons Attribution Non Commercial (CC BY-NC 4.0) license, which permits others to distribute, remix, adapt, build upon this work non-commercially, and license their derivative works on different terms, provided the original work is properly cited and the use is non-commercial. See: http://creativecommons.org/licenses/by-nc/4.0/.