Prediction models for cardiovascular disease risk in the general population: systematic review
BMJ 2016; 353 doi: https://doi.org/10.1136/bmj.i2416 (Published 16 May 2016) Cite this as: BMJ 2016;353:i2416
- Johanna A A G Damen, PhD fellow1 2,
- Lotty Hooft, associate professor 1 2,
- Ewoud Schuit, postdoctoral researcher1 2 3,
- Thomas P A Debray, assistant professor1 2,
- Gary S Collins, associate professor4,
- Ioanna Tzoulaki, lecturer5,
- Camille M Lassale, research associate in chronic disease epidemiology5,
- George C M Siontis, research associate6,
- Virginia Chiocchia, medical statistician4 7,
- Corran Roberts, medical statistician4,
- Michael Maia Schlüssel, medical statistician4,
- Stephen Gerry, medical statistician4,
- James A Black, epidemiologist8,
- Pauline Heus, researcher1 2,
- Yvonne T van der Schouw, professor1,
- Linda M Peelen, assistant professor1,
- Karel G M Moons, professor1 2
- 1Julius Center for Health Sciences and Primary Care, University Medical Center Utrecht, Utrecht, Netherlands
- 2Cochrane Netherlands, University Medical Center Utrecht, PO Box 85500, Str 6.131, 3508 GA Utrecht, Netherlands
- 3Stanford Prevention Research Center, Stanford University, Stanford, CA, USA
- 4Centre for Statistics in Medicine, Nuffield Department of Orthopaedics, Rheumatology and Musculoskeletal Sciences, University of Oxford, Oxford, UK
- 5Department of Epidemiology and Biostatistics, School of Public Health, Imperial College London, London, UK
- 6Department of Cardiology, Bern University Hospital, 3010 Bern, Switzerland
- 7Surgical Intervention Trials Unit, University of Oxford, Oxford, UK
- 8MRC Epidemiology Unit, University of Cambridge School of Clinical Medicine, Cambridge, UK
- Correspondence to: J A A G Damen j.a.a.damen{at}umcutrecht.nl
- Accepted 19 April 2016
Abstract
Objective To provide an overview of prediction models for risk of cardiovascular disease (CVD) in the general population.
Design Systematic review.
Data sources Medline and Embase until June 2013.
Eligibility criteria for study selection Studies describing the development or external validation of a multivariable model for predicting CVD risk in the general population.
Results 9965 references were screened, of which 212 articles were included in the review, describing the development of 363 prediction models and 473 external validations. Most models were developed in Europe (n=167, 46%), predicted risk of fatal or non-fatal coronary heart disease (n=118, 33%) over a 10 year period (n=209, 58%). The most common predictors were smoking (n=325, 90%) and age (n=321, 88%), and most models were sex specific (n=250, 69%). Substantial heterogeneity in predictor and outcome definitions was observed between models, and important clinical and methodological information were often missing. The prediction horizon was not specified for 49 models (13%), and for 92 (25%) crucial information was missing to enable the model to be used for individual risk prediction. Only 132 developed models (36%) were externally validated and only 70 (19%) by independent investigators. Model performance was heterogeneous and measures such as discrimination and calibration were reported for only 65% and 58% of the external validations, respectively.
Conclusions There is an excess of models predicting incident CVD in the general population. The usefulness of most of the models remains unclear owing to methodological shortcomings, incomplete presentation, and lack of external validation and model impact studies. Rather than developing yet another similar CVD risk prediction model, in this era of large datasets, future research should focus on externally validating and comparing head-to-head promising CVD risk models that already exist, on tailoring or even combining these models to local settings, and investigating whether these models can be extended by addition of new predictors.
Introduction
Cardiovascular disease (CVD) is a leading cause of morbidity and mortality worldwide,1 accounting for approximately one third of all deaths.2 Prevention of CVD requires timely identification of people at increased risk to target effective dietary, lifestyle, or drug interventions. Over the past two decades, numerous prediction models have been developed, which mathematically combine multiple predictors to estimate the risk of developing CVD—for example, the Framingham,3 4 5 SCORE,6 and QRISK7 8 9 models. Some of these prediction models are included in clinical guidelines for therapeutic management10 11 and are increasingly advocated by health policymakers. In the United Kingdom, electronic health patient record systems now have QRISK2 embedded to calculate 10 year CVD risk.
Several reviews have shown that there is an abundance of prediction models for a wide range of CVD outcomes.12 13 14 However, the most comprehensive review12 includes models published more than 10 years ago (search carried out in 2003). More recent reviews have shown that the number of published prediction models has increased dramatically since then; furthermore, these reviews have not systematically described the outcomes that the models intended to predict, the most common predictors, the predictive performance of all these models, and which developed prediction models have been externally validated.13 14
We carried out a systematic review of multivariable prediction models developed to predict the risk of developing CVD in the general population, to describe the characteristics of the models’ development, included predictors, CVD outcomes predicted, presentation, and whether they have undergone external validation.
Methods
We conducted our systematic review following the recently published guidance from the Cochrane Prognosis Methods Group, using the CHARMS checklist, for reviews of prediction model studies.15
Literature search
We performed a literature search in Medline and Embase on 1 June 2013 using search terms to identify primary articles reporting on the development and/or validation of models predicting incident CVD, published from 2004 onwards (see supplementary table 1). Articles published before 2004 were identified from a previously published comprehensive systematic review,12 and a cross reference check was performed for all reviews on CVD prediction models identified by our search. For external validation studies where the development study was not identified by our search, we manually retrieved and included in the review the original article describing the development of the model.
Eligibility criteria
We included all primary articles that reported on one or more multivariable (that is, including at least two predictors16) prediction models, tools, or scores, that have been proposed for individual risk estimation of any future CVD outcome in the general population. We differentiated between articles reporting on the development17 18 19 or external validation19 20 21 of one or more prediction models (box 1). Studies reporting on the incremental value or model extension—that is, evaluating the incremental value of one or more new predictors to existing models,26 were excluded. We classified articles as development studies if they reported the development of a model in their objectives or conclusions, or if it was clear from other information in the article that they developed a prediction model for individual risk estimation (eg, if they presented a simplified risk chart). Included articles had to report original research (eg, reviews and letters were excluded), study humans, and be written in English. Articles were included if they reported models for predicting any fatal or non-fatal arterial CVD event. We excluded articles describing models for predicting the risk of venous disease; validation articles with a cross sectional study design that, for example, compared predicted risks of two different models at one time point without any association with actual CVD outcomes; and articles describing models developed from or validated exclusively in specific diseased (patient) populations, such as patients with diabetes, with HIV, with atrial fibrillation, or undergoing any surgery. Furthermore, we excluded methodological articles and articles for which no full text was available through a license at our institutes. Impact studies identified by our search were excluded from this review but were described in a different review.27 External validation articles were excluded if the corresponding development article was not available.
Box 1: Definitions of technical terms
Internal validation—testing a model’s predictive accuracy by reusing (parts of) the dataset on which the model was developed. The aim of internal validation is to assess the overfit and correct for the resulting “optimism” in the performance of the model. Examples are cross validation and bootstrapping22
External validation—testing a model’s predictive accuracy in a population other than the development population23
Prediction horizon—time frame for which the model is intended to predict the outcome15
Discrimination—ability of the model to distinguish between people who do and do not develop the outcome of interest24
Calibration—agreement between predicted and observed numbers of events22
Updating—adjusting a previously developed model to a new setting or study population, to improve model fit in that population. Several forms of updating exist, including intercept recalibration, slope recalibration, and refitting all coefficients of a model.25 It is also possible to combine and update existing models
A single article can describe the development and/or validation of several prediction models, and the distinction between models is not always clear. We defined reported models as separate models whenever a combination of two or more predictors with unique predictor-outcome association estimates were presented. For example, if a model was fitted after stratification for men and women yielding different predictor-outcome associations (that is, predictor weights), we scored it as two separate models. Additionally, two presented models yielding the same predictor-outcome associations but with a different baseline hazard or risk estimate, were considered separately.
Screening process
Initially pairs of two reviewers (JAB, TPAD, CML, LMP, ES, GCMS) independently screened retrieved articles for eligibility on title and subsequently on abstract. Disagreements were resolved by iterative screening rounds. After consensus, full text articles were retrieved and one reviewer (JAB, GSC, VC, JAAGD, SG, TPAD, PH, LH, CML, CR, ES, GCMS, MMS, IT) screened the full text articles and extracted data. In case of doubt, a second (JAAGD or GSC) or third (ES or KGMM) reviewer was involved.
Data extraction and critical appraisal
We categorised the eligible articles into two groups: development articles, and external validation (with or without model recalibration) articles.
The list of extracted items was based on the recently issued Cochrane guidance for data extraction and critical appraisal for systematic reviews of prediction models (the CHARMS checklist15) supplemented by items obtained from methodological guidance papers and previous systematic reviews in the specialty.15 28 29 30 31 The full list of extracted items is available on request. Items extracted from articles describing model development included study design (eg, cohort, case-control), study population, geographical location, outcome, prediction horizon, modelling method (eg, Cox proportional hazards model, logistic model), method of internal validation (eg, bootstrapping, cross validation), number of study participants and CVD events, number and type of predictors, model presentation (eg, full regression equation, risk chart), and predictive performance measures (eg, calibration, discrimination). For articles describing external validation of a prediction model we extracted the type of external validation (eg, temporal, geographical21 32), whether or not the validation was performed by the same investigators who developed the model, study population, geographical location, number of participants and events, and the model’s performance before and (if conducted) after model recalibration. If an article described multiple models, we carried out separate data extraction for each model.
To accomplish consistent data extraction, a standardised data extraction form was piloted and modified several times. All reviewers were extensively trained on how to use the form. A second reviewer (JAAGD) checked extracted items classed as “not reported” or “unclear,” or unexpected findings. We did not explicitly perform a formal risk of bias assessment as no such tool is currently available for studies of prediction models.
Descriptive analyses
Results were summarised using descriptive statistics. We did not perform a quantitative synthesis of the models, as this was beyond the scope of our review, and formal methods for meta-analysis of prediction models are not yet fully developed.
Patient involvement
No patients were involved in setting the research question or the outcome measures, nor were they involved in developing plans for design or implementation of the study. No patients were asked to advise on interpretation or writing up of results. There are no plans to disseminate the results of the research to study participants or the relevant patient community.
Results
The search strategy identified 9965 unique articles, of which 8577 were excluded based on title and abstract. In total, 1388 full texts were screened, of which 212 articles met the eligibility criteria and were included in this review (fig 1⇓). In total, 125 articles concerned the development of one or more CVD risk prediction models and 136 articles described the external validation of one or more of these models (see supplementary table 2). Frequently, articles described combinations of development or external validation (fig 1⇓), therefore the total number does not sum up to 212. The number of development and external validation studies increased over time (fig 2⇓).

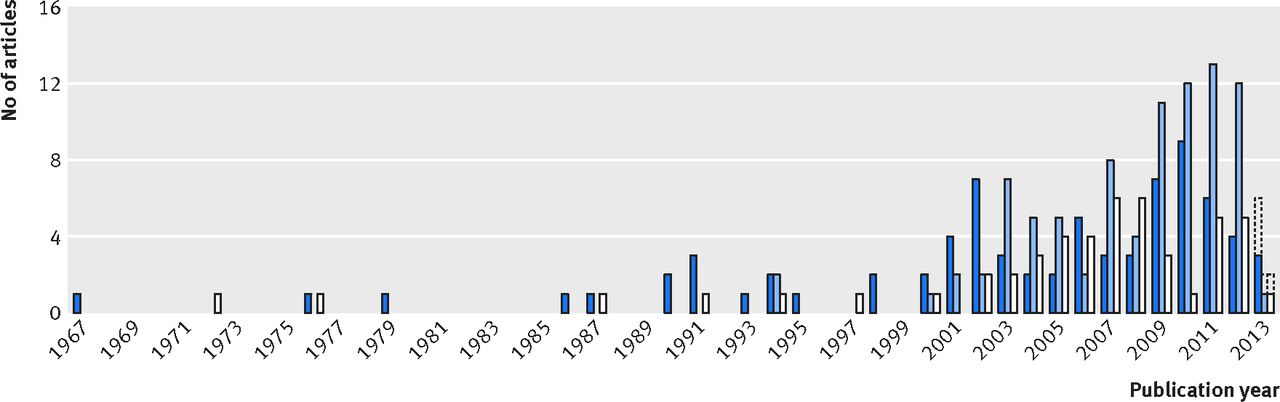
Fig 2 Numbers of articles in which only one or more models were developed (dark blue), only one or more models were externally validated (light blue), or one or more models were developed and externally validated (white), ordered by publication year (up to June 2013). Predictions of the total numbers in 2013 are displayed with dotted lines
Studies describing the development of CVD prediction models
Study designs and study populations
Overall, 125 articles described the development of 363 different models. Most of the prediction models (n=250, 69%) were developed using data from a longitudinal cohort study (see supplementary figure 1A); most originated from Europe (n=168, 46%) or the United States and Canada (n=132, 36%, see supplementary figure 1B). No models were developed using data from Africa. Several cohorts were used multiple times for model development—for example, the Framingham cohort, yielding 69 models in 23 papers.
Study populations (that is, case mix) differed noticeably between studies, mainly for age, sex, and other patient characteristics. Most models were developed for people with ages ranging from 30 to 74 years (n=206, 57%), although 69 different age ranges were reported (see supplementary figure 1C). The majority of models was sex specific (men n=142, 39%; women n=108, 30%), and for most models (n=230, 63%), investigators explicitly stated they excluded study participants with existing CVD (including coronary heart disease, stroke, other heart diseases, or combinations of those), or with other diseases such as cancer (n=21, 6%) or diabetes (n=43, 12%).
CVD outcomes
We observed large variation in predicted outcomes. Although the majority of prediction models focused on (fatal or non-fatal) coronary heart disease or CVD (n=118, 33% and n=95, 26%), 19 other outcomes were identified, such as (fatal or non-fatal) stroke, myocardial infarction, and atrial fibrillation (see supplementary table 3). On top of this, the definitions of these outcomes showed considerable heterogeneity, with, for example, more than 40 different definitions for fatal or non-fatal coronary heart disease (see supplementary table 4). International classification of disease codes were specified for 82 out of 363 models (23%).
Predictors
The median number of predictors included in the developed models was 7 (range 2-80). In total, more than 100 different predictors were included (fig 3⇓). Sex was included in 88 (24%) models; however, 250 (69%) models were explicitly developed only for men or only for women. Most of the models (n=239, 66%) included a set of similar predictors, consisting of age, smoking, blood pressure, and blood cholesterol measurements. Other prevalently selected predictors were diabetes (n=187, 52%) and body mass index (n=107, 29%). Treatment modalities were included in a few prediction models; 56 models (15%) included use of antihypertensive treatment and no models included use of lipid lowering drugs.

Fig 3 Main categories of predictors included in developed models. CVD=cardiovascular disease; HDL=high density lipoprotein; LDL=low density lipoprotein
Sample size
The number of participants used to develop the prediction models ranged from 51 to 1 189 845 (median 3969), and the number of events ranged between 28 and 55 667 (median 241). The number of participants and the number of events were not reported for 24 (7%) and 74 (20%) models, respectively. The number of events for each variable included in the final prediction model could be calculated for 252 (69%) models and ranged from 1 to 4205. For 25 out of these 252 (10%) models, this number of events for each variable was less than 10.33 34
Modelling method and prediction horizon
We found that most prediction models were developed using Cox proportional hazards regression (n=160, 44%), accelerated failure time analysis (n=77, 21%), or logistic regression (n=71, 20%). For 36 models (10%) the method used for statistical modelling was not clear (see supplementary table 5). The prediction horizon ranged between 2 and 45 years, with the majority of studies predicting CVD outcomes for a five year or 10 year horizon (n=47, 13% and n=209, 58%, respectively). For 49 models (13%), the prediction horizon was not specified (see supplementary table 6).
Model presentation
For 167 models (46%) the complete regression formula, including all regression coefficients and intercept or baseline hazard, were reported. Of the other 196 models, 104 (53%) were presented as online calculator, risk chart, sum score, or nomogram to allow individual risk estimation. For the remaining models (n=92, 25%) insufficient information was presented to allow calculation of individual risks.
Predictive performance
At least one measure of predictive performance was reported for 191 of the 363 (53%) models (table 1⇓). For 143 (39%) models, discrimination was reported as a C statistic or area under the receiver operating characteristic curve (range 0.61 to 1.00). Calibration was reported for 116 (32%) models, for which a variety of methods was used, such as a Hosmer-Lemeshow test (n=60, 17%), calibration plot (n=31, 9%) or observed:expected ratio (n=12, 3%). For 99 (27%) models, both discrimination and calibration were reported. Table 2⇓ shows that reporting of discriminative performance measures seems to have increased over time, whereas reporting of calibration seems to remain limited.
Performance measures reported for developed models. Values are numbers (percentages) unless stated otherwise
Reporting of performance measures for models across years of publication. Values are numbers (percentages) unless stated otherwise
Internal validation
In total, 80 of the 363 developed models (22%) were internally validated, most often using a random split of the dataset (n=27), bootstrapping (n=23), or cross validation (n=22).
Studies describing external validation of a prediction model
In 136 articles, 473 external validations were performed. However, the majority of the 363 developed models (n=231, 64%) has never been externally validated. Out of the 132 (36%) models that were externally validated, 35 (27%) were validated once, and 38 (29%) (originally developed and described in seven articles) were validated more than 10 times. The most commonly validated models were Framingham (Wilson 1998, n=89),5 Framingham (Anderson 1991, n=73),3 SCORE (Conroy 2003, n=63),6 Framingham (D’Agostino 2008, n=44),36 Framingham (ATP III 2002, n=31),37 Framingham (Anderson 1991, n=30),4 and QRISK (Hippisley-Cox 2007, n=12)8 (table 3⇓).
List of the models that were validated at least three times, and their predicted outcomes (sorted by number of validations)
Out of the 132 externally validated models, 45 (34%) were solely externally validated in the same paper in which their development was described, 17 (13%) were externally validated in a different paper but with authors overlapping between the development and validation paper, and 70 (53%) were validated by independent researchers. Sample sizes of the validation studies ranged from very small (eg, 90 participants or one event) to very large (eg, 1 066 127 participants or 51 340 events). Most external validations were performed in a different geographical area from the development study—for example, the Framingham (Anderson 1991)3 model (developed on data from the United States) was often validated outside North America, namely in Europe (71% of its validations), Australia (16%), or Asia (4%) (table 4⇓). There was considerable heterogeneity in eligibility criteria for patients between validation and development studies. For example, for the seven aforementioned models, 13% of the validation studies were performed in the same age range for which the model was originally developed. For Framingham (Anderson 1991)3 only few (n=12, 16%) validations were performed in people outside these age ranges, whereas for Framingham (Wilson 1998)5 and SCORE (Conroy 2003)6 this happened more often (n=34, 38% and n=33, 52%, respectively; see supplementary figure 2).
Description of study populations and design characteristics used to validate seven most often (>10 times, see table 3⇑) validated models. Values are numbers (percentages) unless stated otherwise
In external validation studies, the C statistic was reported for 303 (64%) models. For 277 models (58%) a calibration measure was reported by using a calibration plot (n=122, 26%), an observed:expected ratio (n=124, 26%), the Hosmer-Lemeshow test (n=68, 14%), a calibration table (that is, a table with predicted and observed events; n=62, 13%), or a combination of those (table 1⇑). Both discrimination and calibration were reported for 185 (39%) external validations. The discriminative ability and calibration of the three most often validated models (Framingham (Wilson 1998),5 Framingham (Anderson 1991),3 and SCORE (Conroy 20036)) varied between validation studies, with C statistics between 0.57 and 0.92, 0.53 and 0.99, and 0.62 and 0.91, respectively, and observed:expected ratios between 0.37 and 1.92, 0.18 and 2.60, and 0.28 and 1.50, respectively (table 4⇑).
Models that were external validated differed in many respects from the non-validated models (see supplementary table 7). Ninety three per cent of validated models were developed using longitudinal cohort data versus 81% of non-validated models, 34% versus 15% were internally validated, and 83% versus 70% were presented in a way that allowed the calculation of individual risk. The median publication year for validated models was 2002 (or 2003 after excluding the earliest Framingham models) versus 2006 for models that were not validated. In addition, validated models were developed in studies with a median of 364 events versus 181 for non-validated models. More than half (75 out of 132, 57%) of the models developed in the United States or Canada were validated, compared with 24% (40 out of 168) of models developed from Europe and 16% (7 out of 43) from Asia; excluding the Framingham prediction models did not influence these percentages. None of the models developed in Asia was validated by independent researchers, whereas 41 out of 132 (31%) models from the United States and 26 out of 168 (15%) from Europe were validated by independent researchers.
Discussion
This review shows that there is an abundance of cardiovascular risk prediction models for the general population. Previous reviews also indicated this but were conducted more than a decade ago,12 excluded models that were not internally or externally validated,13 or excluded articles that solely described external validation.14
Clearly, the array of studies describing the development of new risk prediction models for cardiovascular disease (CVD) in the general population is overwhelming, whereas there is a paucity of external validation studies for most of these developed models. Notwithstanding a few notable exceptions, including the Framingham and SCORE models, most of the models (n=231, 64%) have not been externally validated, only 70 (19%) have been validated by independent investigators, and only 38 (10%)—from only seven articles—were validated more than 10 times.
Healthcare professionals and policymakers are already in great doubt about which CVD prediction model to use or advocate in their specific setting or population. Instead of spending large amounts of research funding on the development of new models, in this era of large datasets, studies need to be aimed at validating the existing models and preferably using head-to-head comparisons of their relative predictive performance, be aimed at tailoring these models to local settings or populations, and focus on improving the predictive performance of existing models by the addition of new predictors.48
We found much variability in geographical location of both model development and model validation, but the majority of models were developed and validated in European and Northern American populations. Although the World Health Organization states that more than three quarters of all CVD deaths occur in low income and middle income countries,49 a prediction model for people from Africa or South America has only recently been developed.50 Several prediction models have been developed using data from Asia (eg,44 51 52) but none has yet been externally validated by independent researchers. Models tailored to these countries are important, as it is known that predictor-outcome associations vary among ethnic groups.53
With respect to outcome definitions, most models aimed to predict the risk of fatal or non-fatal coronary heart disease or the combined outcome of CVD. But we identified over 70 different definitions for these two outcomes. In addition, most outcomes were not fully defined and ICD codes were presented for only a few of the predicted outcomes. Without direct head-to-head comparison studies, these differences make it difficult to compare and choose between the existing prediction models based on our review, let alone to decide on which model to choose or advocate in a particular setting. Different definitions of CVD outcome lead to different estimated predictor effects, thus to different predicted probabilities and model performances, and consequently indicate different treatment strategies based on these prediction models. A more uniform definition and reporting of the predicted outcomes, preferably by explicit reporting of the ICD-9 or ICD-10 codes for each outcome, would help the comparison of developed risk models, and their recommendation for and translation into clinical practice. Providing clear outcome definitions enhances not only the reporting of the development studies but also the conduct of external validation of developed models and, most importantly, the clinical implementation of the models by others.30
Most models (66%) were based on a common set of predictors, consisting of age, smoking, blood pressure, and cholesterol levels. Additional to this set, a large number (>100) of predictors have been included in models only once or twice. Interestingly, all these extended models have rarely been externally validated. This suggests that there is more emphasis placed on repeating the process of identifying predictors and developing new models rather than validating, tailoring, and improving existing CVD risk prediction models.
Strengths and limitations of this study
The major strengths of this review include the comprehensive search, careful selection of studies, and extensive data extraction on key characteristics of CVD risk prediction models, including the predictors, outcomes, and studied populations. However, this review also has some limitations. Firstly, we performed our search almost three years ago, and since then more than 4000 articles have been published that matched our search strategy. Therefore, some newly developed prediction models, such as the Pooled Cohort Equations10 and GLOBORISK,50 are not included in this overview. However, considering the large number of included models, including these articles is unlikely to change our main conclusions and recommendations. Moreover, it is this large number of newly identified articles in only two years, that actually underlines our main conclusions and reaffirms the necessity for changes regarding CVD risk prediction and a shift in focus from model development to model validation, head-to-head comparison, model improvement, and assessment of modelling impact. Secondly, we excluded articles not written in English (n=65) and for which no full text was available (n=124). This may have led to some underestimation of the number of models and external validations in the search period, and it might have affected the geographical representation. Thirdly, for external validations of a model published in an article in which several models were developed, it was often not stated exactly which of these models was validated. We therefore assumed all developed models in such articles as validated, which could even have resulted in an overestimation of the number of validated models.
Comparison with other studies
As with previous reviews in other specialties,29 54 55 we found that important clinical and methodological information needed for validation and use of a developed model by others, was often missing. Incomplete reporting is highlighted as an important source of research waste, especially because it prevents future studies from summarising or properly building on previous work, and guiding clinical management.56 We have already dealt with the poor reporting of predicted outcome definitions and measurement. Although we observed an improvement in the reporting of discriminative performance measures over time, for 10% of the developed models, the modelling method was not described, for 13% the time horizon (eg, 10 years) for which the model was predicting was not described, and for 25% information for calculating individual CVD risks (eg, full regression equation, nomogram, or risk chart) was insufficient, making it impossible to validate these models or apply them in clinical practice. For external validation of a model, the full regression equation is needed, which was presented for only 46% of the developed models. To improve the reporting of prediction model studies, the TRIPOD statement was recently published (www.tripod-statement.org).30 57
Since the publication of the review by Beswick et al12 in 2008, in which they searched the literature until 2003, several major things have changed. The number of developed prediction models has more than tripled, from 110 to 363, revealing problems such as the overwhelming number of prediction models, predictor definitions, outcome definitions, prediction horizons, and study populations, and showing how poorly researchers make use of available evidence or existing models in the discipline. Although Beswick et al stated that “New prediction models should have multiple external validations in diverse populations with differing age ranges, ethnicity, sex and cardiovascular risk”,12 we still found a great lack of validation studies for most developed CVD risk prediction models.
Presumably there are various reasons why researchers continue to develop a new CVD risk prediction model from scratch, such as the perceived lack of prediction models for their specific population (eg, ethnic minority groups) or specific outcomes (eg, ischaemic stroke), newly identified predictors, published articles reporting on bad performance of existing models in another setting, availability of data with higher quality (eg, greater sample size, prospectively collected data), funding priorities, or merely self-serving to generate another publication. Nevertheless, our review clearly indicates that many of these studies are still similar in design and execution, as corresponding models often include the same (or similar) predictors, target the same (or similar) patient populations, and predict the same (or similar) outcomes. Therefore, researchers are often—perhaps without knowing—repeating the same process and mostly introduce implicit knowledge when developing a prediction model from scratch. Given that there is a huge amount of literature on prediction of CVD outcomes for the general population, we think it is time to capitalise on prediction modelling research from scratch in this specialty. Over the past few decades, statistical methods for building prediction models using established knowledge have substantially improved, and these can be achieved by refining, updating, extending, and even combining the most promising existing models for prediction of CVD in the general population.
Recommendations and policy implications
Ideally, systematic reviews also guide evidence informed health decision making, in this case leading to recommendations on which models to advocate or even use in different settings or countries. Given the lack of external validation studies (notably by independent investigators) of the majority of CVD risk prediction models, the even bigger lack of head-to-head comparisons of these models (even of the well known CVD risk prediction models such as Framingham, SCORE, and QRISK), the poor reporting of most developed models, and the large variability in studied populations, predicted outcomes, time horizons, included predictors, and reported performance measures, we believe it is still impossible to recommend which specific model or models should be used in which setting or location. Guided by this review, we will continue to focus on quantitatively summarising the predictive performance of the identified CVD risk prediction models that were externally validated across various different locations, and ideally of models that were validated head-to-head and compared in the same dataset. Such meta-analysis of CVD risk prediction models should attempt to identify boundaries of the external validity and thus eventual applicability of these frequently validated models.
This leads to a number of new recommendations in the discipline of CVD risk prediction research and practice. Firstly, this area would benefit from the formulation of guidance with clear definitions of the relevant outcomes (eg, similar to the CROWN initiative in obstetrics58), predictors, and prediction horizons. Secondly, the validity, and thus potential impact, of cardiovascular risk prediction models could substantially be improved by making better use of existing evidence, rather than starting from scratch to develop yet another model.59 Thirdly, the suitable and promising models for a particular targeted population, outcome, and prediction horizon, should be identified, and subsequently be validated (and if necessary tailored to the situation at hand), allowing for head-to-head comparisons such as previously done for prediction models for type 2 diabetes60 and patients requiring cardiac surgery.61 Fourthly, more work is needed to evaluate the presence of heterogeneity in performance of different models across countries, allowing for tailoring of prediction models to different subpopulations. This can be achieved by combining the individual participant data (IPD) from multiple sources, including the increasingly available large registry datasets, and performing the so called IPD meta-analysis.62 63 Analysis of such combined or large datasets has the advantage not only of increased total sample size, but also of better tackling case mix effects, setting specific issues (eg, inclusion of setting specific predictors), and better tailoring of existing models to different settings and consequently improving the robustness and thus generalisability of prediction models across subgroups and countries. Recently, prediction modelling methods for analysis of large, combined datasets have been proposed.59 63 64 65 66 67 68 If, after these efforts, generalisability of a developed and validated prediction model is still not good enough (eg, because of too much differences between populations, treatment standards, or data quality), more advanced methods for redevelopment of models can be used. Promising techniques are dynamic prediction modelling,69 70 modelling strategies that take into account treatment-covariate interactions,71 or other techniques such as machine learning.72 73 Finally, models with adequate generalisability—as inferred from external validation studies—should be evaluated for potential impact on doctors’ decision making or patient outcomes, before being incorporated in guidelines.16 74 A recently published systematic review showed that the provision of risk information increases prescribing of antihypertensive drugs and lipid lowering drugs, but to our knowledge there are yet no studies investigating the effect of the use of prediction models and risk information provision on actual incidences of CVD events.27
Conclusions
The current literature is overwhelmed with models for predicting the risk of cardiovascular outcomes in the general population. Most, however, have not been externally validated or directly compared on their relative predictive performance, making them currently of yet unknown value for practitioners, policy makers, and guideline developers. Moreover, most developed prediction models are insufficiently reported to allow external validation by others, let alone to become implemented in clinical guidelines or being used in practice. We believe it is time to stop developing yet another similar CVD risk prediction model for the general population. Rather than developing such new CVD risk prediction models, in this era of large and combined datasets, we should focus on externally validating and comparing head-to-head the promising existing CVD risk models, on tailoring these models to local settings, to investigate whether they may be extended with new predictors, and finally to quantify the clinical impact of the most promising models.
What is already known on this topic
Several well known prediction models estimate the risk of developing cardiovascular disease (CVD) in the general population
Such models include the Framingham risk score, SCORE, and QRISK
No comprehensive overview has described all competitive models in this domain, how these models have been developed, how many were externally validated, and their predictive performance
What this study adds
Although there is an over-abundance of CVD risk prediction models for the general population, few have been externally validated, making them currently of unknown value for practitioners, policy makers, and guideline developers
Most developed models are inadequately reported to allow external validation or implementation in clinical practice
Rather than developing new models, researchers should make better use of available evidence by validating, making head-to-head comparisons, and tailoring the promising existing models
Footnotes
We thank René Spijker for performing the literature search and Johannes B Reitsma who provided insight and expertise that greatly assisted this project.
Contributors: KGMM and ES designed the study. All authors selected articles or extracted data. JAAGD analysed the data. JAAGD, LH, TPAD, IT, CML, YTS, LMP, ES, and KGM interpreted the data. JAAGD wrote the first draft of the manuscript, which was revised by all authors. All authors approved the final version of the submitted manuscript. All authors had full access to all of the data (including statistical reports and tables) in the study and can take responsibility for the integrity of the data and the accuracy of the data analysis. JAAGD is guarantor.
Funding: KGMM, JAAGD, LH, ES, and TPAD were supported by various grants from The Netherlands Organization for Scientific Research, Dutch Heart Foundation, and the Cochrane Collaboration. KGMM received a grant from The Netherlands Organization for Scientific Research (ZONMW 918.10.615 and 91208004). GSC was supported by MRC grant G1100513. This project has received funding from the European Union’s Seventh Framework Programme for research, technological development and demonstration under grant agreement no. 279233. None of the funding sources had a role in the design, conduct, analyses, or reporting of the study or in the decision to submit the manuscript for publication.
Competing interests: All authors have completed the ICMJE uniform disclosure form at www.icmje.org/coi_disclosure.pdf and declare: no support from any organisation for the submitted work; no financial relationships with any organisations that might have an interest in the submitted work in the previous three years; no other relationships or activities that could appear to have influenced the submitted work.
Ethical approval: Not required.
Data sharing: No additional data available.
Transparency: The lead authors affirm that the manuscript is an honest, accurate, and transparent account of the study being reported; that no important aspects of the study have been omitted; and that any discrepancies from the study as planned have been explained.
This is an Open Access article distributed in accordance with the Creative Commons Attribution Non Commercial (CC BY-NC 3.0) license, which permits others to distribute, remix, adapt, build upon this work non-commercially, and license their derivative works on different terms, provided the original work is properly cited and the use is non-commercial. See: http://creativecommons.org/licenses/by-nc/3.0/.