Residential exposure to aircraft noise and hospital admissions for cardiovascular diseases: multi-airport retrospective study
BMJ 2013; 347 doi: https://doi.org/10.1136/bmj.f5561 (Published 08 October 2013) Cite this as: BMJ 2013;347:f5561
- Andrew W Correia, quantitative analyst1,
- Junenette L Peters, assistant professor2,
- Jonathan I Levy, professor2,
- Steven Melly, geographic information systems specialist3,
- Francesca Dominici, professor, associate dean of information technology4
- 1NMR Group, Somerville, MA, USA
- 2Department of Environmental Health, Boston University School of Public Health, Boston, MA, USA
- 3Department of Environmental Health, Harvard School of Public Health, Boston
- 4Department of Biostatistics, Harvard School of Public Health, Boston, MA 02115-6018, USA
- Correspondence to: F Dominici fdominic{at}hsph.harvard.edu
- Accepted 5 September 2013
Abstract
Objective To investigate whether exposure to aircraft noise increases the risk of hospitalization for cardiovascular diseases in older people (≥65 years) residing near airports.
Design Multi-airport retrospective study of approximately 6 million older people residing near airports in the United States. We superimposed contours of aircraft noise levels (in decibels, dB) for 89 airports for 2009 provided by the US Federal Aviation Administration on census block resolution population data to construct two exposure metrics applicable to zip code resolution health insurance data: population weighted noise within each zip code, and 90th centile of noise among populated census blocks within each zip code.
Setting 2218 zip codes surrounding 89 airports in the contiguous states.
Participants 6 027 363 people eligible to participate in the national medical insurance (Medicare) program (aged ≥65 years) residing near airports in 2009.
Main outcome measures Percentage increase in the hospitalization admission rate for cardiovascular disease associated with a 10 dB increase in aircraft noise, for each airport and on average across airports adjusted by individual level characteristics (age, sex, race), zip code level socioeconomic status and demographics, zip code level air pollution (fine particulate matter and ozone), and roadway density.
Results Averaged across all airports and using the 90th centile noise exposure metric, a zip code with 10 dB higher noise exposure had a 3.5% higher (95% confidence interval 0.2% to 7.0%) cardiovascular hospital admission rate, after controlling for covariates.
Conclusions Despite limitations related to potential misclassification of exposure, we found a statistically significant association between exposure to aircraft noise and risk of hospitalization for cardiovascular diseases among older people living near airports.
Introduction
Exposure to aircraft noise has been associated with physiological responses and psychological reactions,1 2 such as sleep disturbances, sleep disordered breathing, nervousness, and annoyance.2 3 However, the extent to which exposure to aircraft noise might increase the risk of adverse health outcomes is not well studied. Recent literature, primarily from one multicenter European study, has provided evidence of a relation between aircraft noise and hypertension outcomes, including incidence of hypertension,4 self reported hypertension,3 increased blood pressure,5 6 7 8 and antihypertensive medication use.1 9 10 11 These findings are supported by a broader literature, which evaluated the association between residential exposure to noise and cardiovascular disease and found substantial evidence for biological plausibility and positive associations between noise and hypertension, myocardial infarction, and ischemic heart disease.12 Potential biological mechanisms may include induced release of stress hormones13 14 15 and indirect effects on sympathetic activity, which is associated with adverse metabolic outcomes.15 16 17 18
However, few studies of the relation between aircraft noise and cardiovascular disease have been conducted to date,1 in part because these studies have small numbers of airports and therefore do not have sufficient statistical power. One study in the Netherlands examined a single airport and had somewhat inconsistent findings, with an association between airport noise and hospital discharge for myocardial infarction in women but not in men.19 A large national scale study in Switzerland found evidence of an association between exposure to aircraft noise and myocardial infarction mortality.20 To our knowledge, no study has been conducted to date that includes a large study population across multiple airports to estimate the association between exposure to aircraft noise and hospital admissions for cardiovascular outcomes. The rigorous estimation of this association requires a sufficiently large number of airports with large surrounding populations, and sufficient variation in the exposure to aircraft noise. We applied statistical methods (hierarchical Poisson regression models) to estimate the association between zip code level exposure to aircraft noise and zip code level hospital admission rate for cardiovascular disease for each airport, and also to estimate this association by combining information across all the airports. The hierarchical Poisson regression model allows us to adjust for potential confounders both at the individual level and at the zip code level, and to estimate airport specific and overall associations between exposure to aircraft noise and health outcomes accounting for the clustering of the zip code level observations by airport.
In this study we use the large and nationally representative US population of Medicare enrollees to evaluate the association between airport related noise and the risk of hospital admission for cardiovascular disease in the population aged 65 years or more residing near airports in the contiguous states. Understanding the link between aircraft noise and cardiovascular disease outcomes is important in characterizing the potential benefits of intervention strategies.21
Methods
We obtained the study population from Medicare billing claims for the year 2009. In the United States, unless affected by some specific chronic condition, only people aged 65 or more are eligible for the national insurance program, Medicare. Our study population (6 027 363 people aged ≥65 years enrolled in Medicare and residing in the 2218 zip codes close to the 89 airports) corresponds to approximately 15% of the entire US population of older people.
From the claims, we extracted individual level information regarding the date of hospitalization, length of hospital stay, the associated primary and secondary diagnostic and procedure codes (international classification of diseases), and the costs billed to Medicare. Additional individual level data included age, sex, race, and zip code of residence.
We examined five cause specific cardiovascular hospital admissions based on ICD-9 codes (international classification of diseases, 9th revision) for primary diagnosis: heart failure (ICD-9 428), heart rhythm disturbances (426 to 427), cerebrovascular events (430 to 438), ischemic heart disease (410 to 414, 429), and peripheral vascular disease (440 to 448). A variable for total cardiovascular disease admissions was calculated as the sum of hospital admissions for all these causes.
Noise exposure estimates
The US Federal Aviation Administration provided us with aircraft noise contours in decibels (dB) for 89 airports in the contiguous states. These noise levels were estimated at the centroid of each census block surrounding each of the 89 airports out to a minimum of 45 dB, where a census block is the smallest geographic entity for which population data are available in the US census. Noise contours were obtained using the Integrated Noise Model version 7.0a.22 The noise descriptor used was day-night sound level (DNL), which adds a 10 dB “penalty” to night time (that is, 10 pm-7 am).23 Medicare data provide residential information at the zip (postal) code level only. Zip codes are larger geographical areas that are comprised of census blocks (on average there are 168 census blocks per zip code). Therefore, we aggregated the noise exposure across census blocks to obtain an estimate of zip code level (technically, zip code tabulation area) exposure to noise. More specifically, we constructed the following two exposure metrics at zip code level: population weighted average noise (arithmetic mean) among the census blocks within each zip code, where each census block was weighted by the size of the population aged 65 or more obtained from the 2010 US census, and the 90th centile noise exposure among the census blocks within each zip code that contained at least one person aged 65 or more.
Several zip codes were intersected by the 45 dB noise contour at their respective airports, meaning they were comprised of census blocks with noise exposures of both 45 dB or more and less than 45 dB. To calculate our noise exposure metrics for these zip codes, we assigned a value of 45 dB to the census blocks outside the 45 dB contour, whereas census blocks inside the 45 dB contour were assigned their actual value, as estimated by the Integrated Noise Model. We considered only zip codes with census blocks within the 45 dB contour with people aged 65 or more that had Integrated Noise Model estimates when constructing the 90th centile noise exposure variable; for the 90th centile noise exposure there were 1928 such zip codes, with a combined population of 5 523 788 people aged 65 or more. Since Integrated Noise Model estimates were made at census block centroids, some zip codes were excluded because all census block centroids were outside the 45 dB contour.
In our preliminary analyses we developed other candidate noise metrics, including the variance of noise exposure across census blocks within each zip code and percentage of population above various noise thresholds, but focused on the population weighted average and 90th centile noise exposure given their distribution of values and interpretability. More details on the calculation of our two exposure metrics can be found in the technical appendix (see supplementary file).
Outcomes
For each zip code included in the analysis, we calculated the number of hospital admissions and the number of people at risk (Medicare enrollees) separately by two age groups (>75 or ≤75), sex, and race (white (non-Hispanic) or non-white). We conducted the analysis for hospital admissions for all cardiovascular diseases (our main analysis) and separately for cerebrovascular disease, ischemic heart disease, and heart failure. Preliminary analyses indicated that heart rhythm disturbances and peripheral vascular disease were too infrequent to analyze as stand alone outcomes.
Potential confounders
To adjust for the potential confounding effect of socioeconomic status, we extracted several zip code level variables from the 2000 US census. Extensive preliminary analyses led to the selection of percentage Hispanic and median household income as the two key variables that were included in the regression model. To adjust for the potential confounding effect of exposure to air pollution, we also calculated zip code level fine particulate matter (PM2.5) and ozone concentrations for 1165 and 779 zip codes, respectively, out of the 2218 zip codes included in the analyses. Air pollution data were obtained from the US Environmental Protection Agency’s air quality system database, and we calculated zip code level averages by taking the average of the air pollution concentrations across all the monitors that fell in that zip code. In addition, as near-roadway air pollution and noise could both serve as confounders, we estimated zip code level road density. The technical appendix describes how road density was estimated (see supplementary file).
Statistical analysis
The dataset included hospital admission counts, number of people at risk, exposure to aircraft noise, and potential confounders for 2218 zip codes surrounding 89 airports. We used hierarchical Poisson regression models with airport specific random effects to estimate, for each airport and on average across airports, the percentage increase in the zip code level hospital admission rate associated with a 10 dB increase in the zip code level aircraft noise. We denote this percentage increase as the relative rate.
In more detail, the hierarchical Poisson regression model can be described in two stages. Firstly, we specified a Poisson regression model for zip code level data to estimate the relative rate as defined above for each airport adjusted by individual level variables (age, sex, and race) and zip code level potential confounders (socioeconomic status and air pollution). Secondly, we combined information across airports to estimate the relative rate on average across all airports. The model estimated airport specific relative rates and the average relative rate across all airports accounting for the clustering of the zip code level observations within each airport and for potential differences across airports in the association between noise and hospitalization rates. The technical appendix provides details on the mathematical formulation of the hierarchical Poisson regression model (see supplementary file).
To investigate the role of the potential confounding factors, we constructed three hierarchical Poisson regression models for each cardiovascular outcome and for each noise metric (population weighted average and 90th centile). Model 1 did not include any zip code level confounders and only controlled for individual level variables (age, sex, and race). Model 2 additionally controlled for zip code level socioeconomic status and demographic variables (median household income and percentage Hispanic). Model 3 additionally controlled for zip code level exposure to air pollution (fine particulate matter and ozone); model 3 was fitted to a substantially smaller dataset of 779 zip codes rather than the 2218 zip codes used for models 1 and 2, because of the limited availability of air pollution data. In secondary analyses of models 2 and 3 we evaluated the potential confounding effect of zip code level road density (a proxy for road noise and near-road air pollution).
Threshold analysis
We conducted additional analyses to quantify the evidence of a potential non-linearity in the association between exposure to aircraft noise and hospital admission rate for cardiovascular disease. We used total hospitalizations for cardiovascular disease as the outcome and the 90th centile noise exposure metric. In the hierarchical models, we replaced the aircraft noise exposure variable (originally defined as a continuous variable) by a categorical variable indicating low, medium, or high exposure to aircraft noise. A zip code was designated as low exposure for noise levels of 50 dB or less (47% of the study population), medium exposure for noise levels greater than 50 dB but 55 dB or less (30%), and high exposure for noise levels greater than 55 dB (23%). Under this model we could estimate three different percentage increases in hospital admission rates for cardiovascular disease corresponding to: medium versus high exposure, low versus high exposure, and low versus medium exposure. Categorizing the exposure in this way, we could detect evidence of a threshold effect if, for example, we found no evidence of an increase in the cardiovascular disease hospitalization rate when noise increases from low to medium, but statistically significant evidence of an increase in the cardiovascular disease hospitalization rate when noise increases from medium to high. Such a scenario would suggest that any relation between noise exposure and cardiovascular disease hospitalizations only occurs for noise exposures above 55 dB. All statistical analyses were performed using R version 2.15.2. The technical appendix provides more details regarding statistical methods (see supplementary file).24 25
Population attributable fraction
To facilitate the interpretation of our findings, we estimated the population attributable fraction for aircraft noise as well as for fine particulate matter and ozone. The population attributable fraction can be interpreted as the percentage reduction in hospitalizations for cardiovascular disease that would occur if each of these risk factors was reduced to a level that represents theoretical minimum risk, termed the counterfactual exposure distribution.26 For aircraft noise, we used the 90th centile exposure metric, and we considered the counterfactual level of exposure for all zip codes as 45 dB (the lowest level of exposure evaluated in our study). Similarly, for both fine particulate matter and ozone we used the minimum concentration within our domain as the counterfactual level of exposure (4.8 μg/m3 and 17.6 ppb, respectively). All relative risk estimates were taken from an expanded version of model 3, which incorporated additional zip code level covariates that could potentially confound air pollution effects but had no influence on the association between aircraft noise and hospitalization for cardiovascular disease. For each risk factor we estimated the population attributable fraction across all zip codes that had exposure data for that risk factor. To ensure that the population attributable fraction estimates were comparable to one another, given air pollution data from only a subset of zip codes, we also calculated the population attributable fraction for noise for the subset of zip codes with data on air pollution. More detail about the calculation is available in the technical appendix (see supplementary file).
Results
Overall, there were 2218 zip codes (779 with both fine particulate matter and ozone data) and 6 027 363 Medicare enrollees residing within the 45 dB contour level of the 89 airports. The number of zip codes (Medicare enrollees) surrounding each airport ranged from seven (n=8556) to 107 (n=482 200). The table⇓ summarizes the population characteristics, and figure 1⇓ provides a map presenting the 89 airports displayed by size of the population aged 65 or more within the 45 dB contour level.

Fig 1 Map of 89 airports in contiguous states included in analysis. Size of circles is proportional to size of population aged 65 or more residing within 45 dB contour lines surrounding each airport
Distribution of zip code level exposure for 2218 zip codes and risk factor data for about six million national insurance plan (servicing those aged ≥65 years) enrollees residing near airports in United States, 2009. Values are percentages unless stated otherwise
Figure 2⇓ shows the estimated relative rates for cardiovascular disease hospitalizations averaged across all airports for both the population weighted noise exposure and the 90th centile of noise exposure. For the 90th centile of noise exposure variable, controlling for age, sex, and race, an increase of 10 dB was associated with an increase of 2.9% (95% confidence interval 0.8% to 5.0%) in hospital admission rate (model 1). In model 2, which additionally controls for zip code level socioeconomic status and demographic variables, the estimated relative rate was only marginally significant (1.6%, 95% confidence interval −0.2% to 3.5%). In model 3, adding pollution variables to model 2, an increase in the 90th centile of noise of 10 dB was associated with an increase of 3.5% (95% confidence interval 0.2% to 7.0%) in the relative rate of having a cardiovascular disease hospitalization. Models 1 to 3, when fitted to only the 779 zip codes with both fine particulate matter and ozone data, yielded consistently positive and statistically significant estimates of the relative rate of cardiovascular disease hospitalizations associated with a 10 dB increase in the 90th centile of noise (fig 2). Figure 3⇓ displays the airport specific and aggregated relative rates (for model 3) of having a cardiovascular disease hospitalization per 10 dB increase in the 90th centile of noise exposure. In secondary analyses (data not shown), we observed that the relation of noise to cardiovascular disease hospitalizations was almost entirely attributed to within airport and across zip code variations in noise exposure rather than to variations between airports. Indeed, the average within airport standard deviation of our 90th centile noise exposure was 4.7 dB, whereas the average between airport standard deviation of the 90th centile noise exposure was only 1.7 dB, indicating that most of the information used to estimate the noise-cardiovascular disease relation in our models was from variability in exposure within airports, rather than from variability in exposure between airports.

Fig 2 Overall estimates (averaged across 89 airports) of percentage increase in hospital admission rate for cardiovascular disease (CVD) associated with 10 dB (day-night sound level) increase in both exposure variables (population weighted noise exposure and 90th centile noise exposure) for each of the models. Model 1 controls for individual demographics (age, sex, and race); model 2 additionally controls for zip code level socioeconomic status and demographics (% Hispanic and median household income); and model 3 adds to model 2 by also controlling for annual average fine particulate matter and ozone levels. Panel 3 shows models 1 to 3 fitted to only the 779 zip codes with both air pollution variables

Fig 3 Airport specific and overall estimates of percentage increase in hospital admission rate for cardiovascular disease (CVD) associated with 10 dB (day-night sound level) increase in 90th centile noise exposure among census blocks within zip codes. Model controls for individual demographics (age, sex, and race), zip code level socioeconomic status and demographics (% Hispanic and median household income), and annual average fine particulate matter and ozone levels (model 3). Airport specific estimates are arranged from lowest to highest values
For population weighted noise exposure, there was an estimated 6.9% increase (95% confidence interval 2.4% to 11.6%) in the cardiovascular disease hospital admission rate associated with a 10 dB increase in noise in model 1; however, after controlling for socioeconomic status, demographic, and pollution variables (models 2 and 3), this association was no longer statistically significant. Figure 4⇓ shows the airport specific estimated associations for model 3 for population weighted noise. The standard errors of the airport specific estimates were consistently larger than those estimated in models using the 90th centile of noise exposure, due potentially in part to the relatively limited variability of population weighted noise across zip codes within the dataset (see table). Because of this larger standard error in models using the population weighted noise exposure, we focused subsequent analyses on the 90th centile of noise exposure.

Fig 4 Airport specific and overall estimates of percentage increase in hospital admission rate for cardiovascular disease (CVD) associated with 10 dB (day-night sound level) increase in the population weighted noise exposure. This model controls for individual demographics (age, sex, and race), zip code level socioeconomic status and demographics (% Hispanic and median household income), and annual average fine particulate matter and ozone levels (model 3). Airport specific estimates are arranged from lowest to highest values
Considering subcategories of cardiovascular disease outcomes, we observed generally consistent patterns among models. For example, in model 1, an increase in the 90th centile of noise of 10 dB was associated with cerebrovascular disease and heart failure, with a marginal association for ischemic heart disease. Relative rate estimates were similar across outcomes (fig 5⇓). For model 2, relative rate estimates for all three outcomes declined in magnitude and lost statistical significance. Inclusion of pollution variables (model 3) led to stable or increased relative rate estimates for all three outcomes, relative to model 2. These estimates lacked statistical significance other than for ischemic heart disease but were similar in magnitude to the estimates from model 1. For the population weighted noise exposure, a similar pattern was observed (fig 5).

Fig 5 Overall estimates of percentage increase in hospital admission rate for specific cardiovascular diseases (CVD) associated with 10 dB (day-night sound level) increase in noise exposure. Results are reported for cerebrovascular disease (stroke), ischemic heart disease, and heart failure, and for both exposure variables (population weighted noise exposure and 90th centile noise exposure) for each of the three models. Model 1 controls for individual demographics (age, sex, and race); model 2 additionally controls for zip code level socioeconomic status and demographics (% Hispanic and median household income); and model 3 adds to model 2 by also controlling for annual average fine particulate matter and ozone
We found that associations were not sensitive to adjustment for our proxy for road noise and near-road air pollution (road density). In models 2 and 3, the overall estimates per 10 dB increase in the 90th centile of noise without road density were 1.6% (95% confidence interval −0.2% to 3.5%) and 3.5% (0.2% to 7.0%), respectively, and with road density the estimates were 1.6% (−0.4% to 3.5%) and 3.4% (0.3% to 6.7%), respectively.
Figure 6⇓ summarizes the results using the categorized 90th centile noise exposure variable (low, medium, or high). In model 3—controlling for socioeconomic status, demographic, and pollution variables—we found statistically significant evidence of an increase in the hospital admission rate for cardiovascular disease when comparing high versus medium exposure and high versus low exposure, but we did not find statistically significant evidence of an increase when comparing medium versus low exposure. This indicates lack of an association between the 90th centile exposure to aircraft noise and hospital admission rate for cardiovascular disease for noise levels below 55 dB but evidence of an association for noise levels higher than 55 dB.
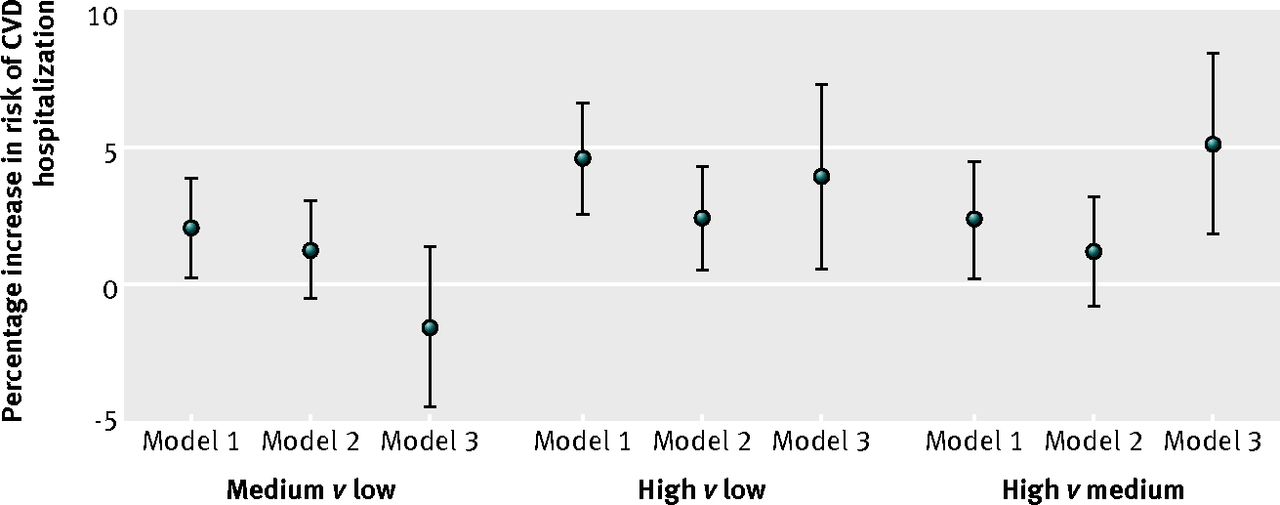
Fig 6 Estimated relative rates of cardiovascular disease (CVD) hospitalization from models using categorized 90th centile of noise exposure. Low noise indicates <50 dB, medium noise indicates 50-55 dB, and high noise indicates >55 dB. Model 1 controls for individual demographics (age, sex, and race), model 2 additionally controls for zip code level socioeconomic status and demographics (% Hispanic and median household income), and model 3 adds to model 2 by also controlling for fine particulate matter and ozone levels
From the estimation of the population attributable fraction we found that, in total, 2.3% of hospitalizations for cardiovascular disease in our Medicare cohort were attributable to aircraft noise. Twenty three per cent of our Medicare cohort was exposed to greater than 55 dB using the 90th centile exposure metric, and this population contributed half of the attributable hospitalizations. In comparison, across the zip codes with air pollution data, 6.8% of hospitalizations for cardiovascular disease were attributable to fine particulate matter and 4.2% to ozone. The population attributable fraction for noise was similar in the subset of zip codes with air pollution data (2.2%).
Discussion
We estimated the association between residential exposure to aircraft noise and hospitalization rates for cardiovascular disease in the largest population of older people (≥65 years) in the United States studied to date. In models only controlling for individual demographics, we found that this association was positive and statistically significant using both of our noise exposure metrics. The results were attenuated after additionally controlling for area level socioeconomic status and demographic factors. However, the positive association generally persisted, with the most adjusted model accounting for individual level and zip code level variables as well as regional air pollution—particularly for the 90th centile of noise exposure variable, which had greater variability across zip codes than the population weighted average, and correspondingly had greater statistical significance. Positive associations were also observed for individual cardiovascular hospitalization outcomes, but statistical power was reduced.
Comparison with other studies
Our findings add to previous literature in several key ways. Firstly, we investigated the noise-cardiovascular hospitalization relation across gradients of airport noise exposure levels for the largest number of airports and population of older people studied to date. We used administrative data capturing the majority of older US adults, who represent an age group at greater risk for cardiovascular disease. We thus had a large number of events, increasing our power to detect relations. We used hierarchical Poisson regression models to estimate airport specific associations while utilizing information from each airport for a pooled estimate. Secondly, we evaluated the relation of noise with cardiovascular hospitalization as the outcome, which, to our knowledge, has been rarely considered in previous noise studies. An ecological study of 62 municipalities around an airport in Amsterdam found no clustering of cardiovascular hospitalizations in areas close to the airport,27 28 but we improve on this study by assessing the relation for individual at risk people and by estimating the whole exposure-response relation. Thirdly, our study provides evidence within the United States, where the housing stock and other factors may differ from the European populations generally studied in the past. US studies have been more limited and have not yielded interpretable evidence. For example, the only major US study to date that investigated the relation between aircraft noise and mortality29 was conducted more than 30 years ago, focused on a single airport, and was critiqued for inadequately controlling for age/sex/race, and other analytical flaws.30 Fourthly, we accounted for the potential confounding of regional air pollution and near-road air pollution/noise.
The estimated associations of similar magnitude across several cardiovascular disease specific outcomes are broadly consistent with the literature. For example, in areas with more aircraft noise, more people were receiving medical treatment for heart trouble and had a “pathological heart shape.”31 A 2009 review of epidemiological studies found sufficient evidence of positive relations between aircraft noise and high blood pressure and use of cardiovascular medication.32 One study included in this review investigated the relation between aircraft noise and incidence of hypertension and found a positive association, particularly in older people.33 Hypertension is not typically a primary reason for hospital admission, so it was not specifically included in our analyses, but hypertension is associated with multiple cardiovascular sequelae that would contribute to hospitalizations.
Our study suggests that although an exposure-response relation exists between noise and cardiovascular admission rates, there may also be a threshold for the effect of noise exposure on cardiovascular disease hospitalizations. Results from our models using a categorized exposure variable showed consistent statistically significant associations in only the highest exposure group (>55 dB). These findings are broadly consistent with previous literature suggesting the possibility of a threshold effect for the aircraft noise-cardiovascular disease relation. In a categorical analysis, Huss and colleagues20 observed significant mortality from myocardial infarction with aircraft noise only in the highest group of 60 dB (A weighted) or more. Other studies found associations with hypertension outcomes with levels 50 dB (A weighted) or more,4 33 but did not see results with categories further divided above 50 dB (A weighted) likely due to small numbers in higher categories.4 It should be noted that our noise exposure metrics were calculated differently from those in prior studies, given zip code level residential resolution, so the noise level at which effects are seen cannot be directly compared.
We did not find statistically significant evidence of heterogeneity in the relation between aircraft noise and cardiovascular hospitalization across airports. In addition we found that evidence of an association between aircraft noise and cardiovascular hospitalization was mainly attributable to variation in noise exposure within airports and not differences between airports. As proposed elsewhere,11 any observed heterogeneity may reflect differences across the country in sound transmission from outdoors to indoors (where most exposure would be anticipated to occur). This could include structural attributes of the housing stock, frequency of open windows, or degree of soundproofing. Heterogeneity may also reflect differences in the type of aircraft and the frequency of over-flights between airports, although this would be incorporated to some extent in Integrated Noise Model inputs and outputs.
In addition, although aircraft related noise has a different profile from that of traffic related noise, our findings are consistent with the traffic noise-cardiovascular disease health literature. For example, in models controlling for individual characteristics, zip code level socioeconomic status and demographics, and air pollution, we found the strongest association (positive and statistically significant) with hospitalizations for ischemic heart disease, consistent with conclusions of an expert report regarding likely mechanisms of noise related health effects.12 Our findings were also consistent with studies looking jointly at noise and air pollution. For example, Beelen and colleagues34 found excess cardiovascular mortality in the highest category of road traffic noise, which was reduced slightly after controlling for air pollution. Huss and colleagues17 found that the association between aircraft noise and mortality from myocardial infarction was not attenuated with adjustment for air pollution. De Kluizenaar and colleagues35 found that after controlling for particulate matter (PM10), the relation between road traffic noise and hypertension became marginally significant. We found that controlling for air pollution and road traffic density did not attenuate the relative rate for both of the aircraft noise exposure metrics. It is worth noting that air pollution is less correlated with aircraft noise than it is with road traffic noise.20
Limitations of this study
Our analysis has limitations. Although Medicare data covers nearly the entire US older population, this database was developed for administrative purposes and has been shown to be subject to misclassification36 37 and geographic variability in evaluation and management.38 39 We only used primary diagnosis, which should reduce misclassification of outcomes,40 and our analyses of combined cardiovascular disease outcomes are unlikely to have significant misclassification.
Other limitations of the Medicare data include limited individual data on risk factors. For example, we were not able to control for smoking and diet, strong risk factors for cardiovascular disease. These variables would only confound the association between aircraft noise and hospitalization for cardiovascular disease if there were significant correlations between aircraft noise exposures and these risk factors. Noise contours display fairly sharp gradients and skew as a function of prevailing wind directions, given runway orientation, and arrival and departure patterns, which may limit spatial confounding. It is possible that socioeconomically patterned risk factors such as smoking are spatially correlated with aircraft noise, as property values have been found to relate to noise levels.41 However, property value is not simply tied to aircraft noise levels but is affected by a complex interplay of several factors (for examples, amenities).42 Our estimates were generally robust to socioeconomic status covariates at area level, but we lacked the individual level addresses and socioeconomic status characteristics to formally address this question. In addition, our zip code level socioeconomic status and demographic variables were taken from census 2000 data because only limited socioeconomic status information from census 2010 was available at the zip code level at the time of our analysis. We thus assumed that patterns of zip code level socioeconomic status remained similar over that time. More generally, the availability of only zip code level address information can lead to exposure misclassification. Noise gradients are substantial at close proximity to airports, and we were unable to differentiate among individuals’ noise exposure within zip codes. However, the use of a study population closely aligned with census data (given near universal enrollment of older people in Medicare) allowed us to reasonably estimate a representative zip code resolution population exposure, with error most likely to be Berksonian with unbiased regression coefficients and inflated standard errors. There remains the possibility of downward bias in our estimates due to aggregation effects, but bias has been shown to be limited when within area variance is small relative to between area variance.43 44 Between zip code variance in noise is larger than within zip code variance, especially for the 90th centile noise exposure, so we would not anticipate substantial bias. However, there is some chance for attenuated effect estimates for the population weighted noise exposure because of comparatively smaller between zip code variance in this exposure metric.
Using the Integrated Noise Model to predict noise exposure also has limitations. The model uses average annual input conditions. Therefore, values may lack precision because certain local acoustical variables, such as humidity effects, ground absorption, individual aircraft directivity patterns, and sound diffraction around terrain or buildings, are not averaged or may not be explicitly modeled.22 That said, the Integrated Noise Model is well established internationally4 and is the required noise assessment tool in the United States for airport noise compatibility planning and environmental assessments and impact statements.22 Each of our derived exposure metrics had its own inherent limitations, with the population weighted average potentially reducing the contrast between zip codes, and the 90th centile of noise exposure not capturing the exposure profile of the entire zip code. Our data were not separated by time of day, so we were not able to analyze the effect of night time noise. This is particularly relevant as recent studies found associations of night time noise on cardiovascular related outcomes5 9 suggesting that sleep interference may mediate the effect of noise on cardiovascular health. However, the Integrated Noise Model outputs did up-weight night time noise, partially accounting for this phenomenon.
Conclusions and future research
We found that aircraft noise, particularly characterized by the 90th centile of noise exposure among census blocks within zip codes, is statistically significantly associated with higher relative rate of hospitalization for cardiovascular disease among older people residing near airports. This relation remained after controlling for individual data, zip code level socioeconomic status and demographics, air pollution, and roadway proximity variables. Our results provide evidence of a statistically significant association between exposure to aircraft noise and cardiovascular health, particularly at higher exposure levels. Further research should refine these associations and strengthen causal interpretation by investigating modifying factors at the airport or individual level.
What is already known on this topic
-
Noise has been associated with hypertension, myocardial infarction, and ischemic heart disease
-
Aircraft noise in particular has been associated with several hypertension outcomes
-
Few studies, however, have investigated the relation of aircraft noise to cardiovascular disease, in part because studies surrounding a small number of airports are not typically adequately powered
What this study adds
-
Long term exposure to aircraft noise is positively associated with hospitalization for cardiovascular disease
-
The association between aircraft noise and hospitalization for cardiovascular disease is not confounded by air pollution, road density, or area level socioeconomic status
-
There may be a threshold for the association between aircraft noise and hospitalization for cardiovascular disease
Notes
Cite this as: BMJ 2013;347:f5561
Footnotes
-
Contributors: AWC (dual first authorship) was responsible for study design, data analysis, data interpretation, and writing. JLP (dual first authorship) was responsible for writing, literature search, study design, and data interpretation. JIL contributed to the literature search, study design, data interpretation, and writing. SM contributed to data collection and data interpretation. FD (study guarantor) contributed to the study design, data analysis, data interpretation, and writing.
-
Funding: This study was supported by the Federal Aviation Administration, under FAA award No 09-C-NE-HU amendment No 004 and 10-C-NE-BU amendment No 002. The sponsor provided the noise contours, but had no role in the analysis or interpretation of data; in the writing of the reports; or in the decision to submit the article for publication. Any opinions, findings, and conclusions or recommendations expressed in this material are those of the authors and do not necessarily reflect the views of the funder.
-
Competing interests: All authors have completed the ICMJE uniform disclosure form at www.icmje.org/coi_disclosure.pdf (available on request from the corresponding author) and declare: no support from any commercial entities for the submitted work; no financial relationships with any commercial entities that might have an interest in the submitted work in the previous three years; and no other relationships or activities that could appear to have influenced the submitted work.
-
Ethical approval: Studies using national data repositories and area level exposure data do not require ethical approval in the United States. All authors had full access to the data and take full responsibility for their integrity.
-
Data sharing: No additional data available.
This is an Open Access article distributed in accordance with the Creative Commons Attribution Non Commercial (CC BY-NC 3.0) license, which permits others to distribute, remix, adapt, build upon this work non-commercially, and license their derivative works on different terms, provided the original work is properly cited and the use is non-commercial. See: http://creativecommons.org/licenses/by-nc/3.0/.