Recommendations for examining and interpreting funnel plot asymmetry in meta-analyses of randomised controlled trials
BMJ 2011; 343 doi: https://doi.org/10.1136/bmj.d4002 (Published 22 July 2011) Cite this as: BMJ 2011;343:d4002
- Jonathan A C Sterne, professor1,
- Alex J Sutton, professor2,
- John P A Ioannidis, professor and director3,
- Norma Terrin, associate professor4,
- David R Jones, professor2,
- Joseph Lau, professor4,
- James Carpenter, reader5,
- Gerta Rücker, research assistant6,
- Roger M Harbord, research associate1,
- Christopher H Schmid, professor4,
- Jennifer Tetzlaff, research coordinator7,
- Jonathan J Deeks, professor8,
- Jaime Peters, research fellow9,
- Petra Macaskill, associate professor10,
- Guido Schwarzer, research assistant6,
- Sue Duval, assistant professor11,
- Douglas G Altman, professor12,
- David Moher, senior scientist7,
- Julian P T Higgins, senior statistician13
- 1School of Social and Community Medicine, University of Bristol, Bristol BS8 2PS, UK
- 2Department of Health Sciences, University of Leicester, Leicester, UK
- 3Stanford Prevention Research Center, Stanford University School of Medicine, Stanford, CA, USA
- 4Institute for Clinical Research and Health Policy Studies, Tufts Medical Center, Boston, MA, USA
- 5Medical Statistics Unit, London School of Hygiene and Tropical Medicine, London, UK
- 6Institute of Medical Biometry and Medical Informatics, University Medical Center Freiburg, Germany
- 7Clinical Epidemiology Program, Ottawa Hospital Research Institute, Ottawa, Ontario, Canada
- 8School of Health and Population Sciences, University of Birmingham, Birmingham, UK
- 9Peninsula Medical School, University of Exeter, Exeter, UK
- 10School of Public Health, University of Sydney, NSW, Australia
- 11University of Minnesota School of Public Health, Minneapolis, MN, USA
- 12Centre for Statistics in Medicine, University of Oxford, Oxford, UK
- 13MRC Biostatistics Unit, Cambridge, UK
- Correspondence to: J A C Sterne jonathan.sterne{at}bristol.ac.uk
- Accepted 21 February 2011
The 1997 paper describing the test for funnel plot asymmetry proposed by Egger et al 1 is one of the most cited articles in the history of BMJ.1 Despite the recommendations contained in this and subsequent papers,2 3 funnel plot asymmetry is often, wrongly, equated with publication or other reporting biases. The use and appropriate interpretation of funnel plots and tests for funnel plot asymmetry have been controversial because of questions about statistical validity,4 disputes over appropriate interpretation,3 5 6 and low power of the tests.2
This article recommends how to examine and interpret funnel plot asymmetry (also known as small study effects2) in meta-analyses of randomised controlled trials. The recommendations are based on a detailed MEDLINE review of literature published up to 2007 and discussions among methodologists, who extended and adapted guidance previously summarised in the Cochrane Handbook for Systematic Reviews of Interventions.7
What is a funnel plot?
A funnel plot is a scatter plot of the effect estimates from individual studies against some measure of each study’s size or precision. The standard error of the effect estimate is often chosen as the measure of study size and plotted on the vertical axis8 with a reversed scale that places the larger, most powerful studies towards the top. The effect estimates from smaller studies should scatter more widely at the bottom, with the spread narrowing among larger studies.9 In the absence of bias and between study heterogeneity, the scatter will be due to sampling variation alone and the plot will resemble a symmetrical inverted funnel (fig 1⇓). A triangle centred on a fixed effect summary estimate and extending 1.96 standard errors either side will include about 95% of studies if no bias is present and the fixed effect assumption (that the true treatment effect is the same in each study) is valid. The appendix on bmj.com discusses choice of axis in funnel plots.

Fig 1 Example of symmetrical funnel plot. The outer dashed lines indicate the triangular region within which 95% of studies are expected to lie in the absence of both biases and heterogeneity (fixed effect summary log odds ratio±1.96×standard error of summary log odds ratio). The solid vertical line corresponds to no intervention effect
Implications of heterogeneity, reporting bias, and chance
Heterogeneity, reporting bias, and chance may all lead to asymmetry or other shapes in funnel plots (box). Funnel plot asymmetry may also be an artefact of the choice of statistics being plotted (see appendix). The presence of any shape in a funnel plot is contingent on the studies having a range of standard errors, since otherwise they would lie on a horizontal line.
Box 1: Possible sources of asymmetry in funnel plots (adapted from Egger et al1)
Reporting biases
Publication bias:
Delayed publication (also known as time lag or pipeline) bias
Location biases (eg, language bias, citation bias, multiple publication bias)
Selective outcome reporting
Selective analysis reporting
Poor methodological quality leading to spuriously inflated effects in smaller studies
Poor methodological design
Inadequate analysis
Fraud
True heterogeneity
Size of effect differs according to study size (eg, because of differences in the intensity of interventions or in underlying risk between studies of different sizes)
Artefactual
In some circumstances, sampling variation can lead to an association between the intervention effect and its standard error
Chance
Asymmetry may occur by chance, which motivates the use of asymmetry tests
Heterogeneity
Statistical heterogeneity refers to differences between study results beyond those attributable to chance. It may arise because of clinical differences between studies (for example, setting, types of participants, or implementation of the intervention) or methodological differences (such as extent of control over bias). A random effects model is often used to incorporate heterogeneity in meta-analyses. If the heterogeneity fits with the assumptions of this model, a funnel plot will be symmetrical but with additional horizontal scatter. If heterogeneity is large it may overwhelm the sampling error, so that the plot appears cylindrical.
Heterogeneity will lead to funnel plot asymmetry if it induces a correlation between study sizes and intervention effects.5 For example, substantial benefit may be seen only in high risk patients, and these may be preferentially included in early, small studies.10 Or the intervention may have been implemented less thoroughly in larger studies, resulting in smaller effect estimates compared with smaller studies.11
Figure 2⇓ shows funnel plot asymmetry arising from heterogeneity that is due entirely to there being three distinct subgroups of studies, each with a different intervention effect.12 The separate funnels for each subgroup are symmetrical. Unfortunately, in practice, important sources of heterogeneity are often unknown.

Fig 2 Illustration of funnel plot asymmetry due to heterogeneity, in the form of three distinct subgroups of studies. Funnel plot including all studies (top left) shows clear asymmetry (P<0.001 from Egger test for funnel plot asymmetry). P values for each subgroup are all >0.49.
Differences in methodological quality may also cause heterogeneity and lead to funnel plot asymmetry. Smaller studies tend to be conducted and analysed with less methodological rigour than larger studies,13 and trials of lower quality also tend to show larger intervention effects.14 15
Reporting bias
Reporting biases arise when the dissemination of research findings is influenced by the nature and direction of results. Statistically significant “positive” results are more likely to be published, published rapidly, published in English, published more than once, published in high impact journals, and cited by others.16 17 18 19 Data that would lead to negative results may be filtered, manipulated, or presented in such a way that they become positive.14 20
Reporting biases can have three types of consequence for a meta-analysis:
A systematic review may fail to locate an eligible study because all information about it is suppressed or hard to find (publication bias)
A located study may not provide usable data for the outcome of interest because the study authors did not consider the result sufficiently interesting (selective outcome reporting)
A located study may provide biased results for some outcome—for example, by presenting the result with the smallest P value or largest effect estimate after trying several analysis methods (selective analysis reporting).
These biases may cause funnel plot asymmetry if statistically significant results suggesting a beneficial effect are more likely to be published than non-significant results. Such asymmetry may be exaggerated if there is a further tendency for smaller studies to be more prone to selective suppression of results than larger studies. This is often assumed to be the case for randomised trials. For instance, it is probably more difficult to make a large study disappear without trace, while a small study can easily be lost in a file drawer.21 The same may apply to specific outcomes—for example, it is difficult not to report on mortality or myocardial infarction if these are outcomes of a large study.
Smaller studies have more sampling error in their effect estimates. Thus even though the risk of a false positive significant finding is the same, multiple analyses are more likely to yield a large effect estimate that may seem worth publishing. However, biases may not act this way in real life; funnel plots could be symmetrical even in the presence of publication bias or selective outcome reporting19 22—for example, if the published findings point to effects in different directions but unreported results indicate neither direction. Alternatively, bias may have affected few studies and therefore not cause glaring asymmetry.
Chance
The role of chance is critical for interpretation of funnel plots because most meta-analyses of randomised trials in healthcare contain few studies.2 Investigations of relations across studies in a meta-analysis are seriously prone to false positive findings when there is a small number of studies and heterogeneity across studies,23 and this may affect funnel plot symmetry.
Interpreting funnel plot asymmetry
Authors of systematic reviews should distinguish between possible reasons for funnel plot asymmetry (box 1). Knowledge of the intervention, and the circumstances in which it was implemented in different studies, can help identify causes of asymmetry in funnel plots, which should also be interpreted in the context of susceptibility to biases of research in the field of interest. Potential conflicts of interest, whether outcomes and analyses have been standardised, and extent of trial registration may need to be considered. For example, studies of antidepressants generate substantial conflicts of interest because the drugs generate vast sales revenues. Furthermore, there are hundreds of outcome scales, analyses can be very flexible, and trial registration was uncommon until recently.24 Conversely, in a prospective meta-analysis where all data are included and all analyses fully standardised and conducted according to a predetermined protocol, publication or reporting biases cannot exist. Reporting bias is therefore more likely to be a cause of an asymmetric plot in the first situation than in the second.
Terrin et al found that researchers were poor at identifying publication bias from funnel plots.5 Including contour lines corresponding to perceived milestones of statistical significance (P=0.01, 0.05, 0.1, etc) may aid visual interpretation.25 If studies seem to be missing in areas of non-significance (fig 3⇓, top) then asymmetry may be due to reporting bias, although other explanations should still be considered. If the supposed missing studies are in areas of higher significance or in a direction likely to be considered desirable to their authors (fig 3⇓, bottom), asymmetry is probably due to factors other than reporting bias.

Fig 3 Contour enhanced funnel plots. In the top diagram there is a suggestion of missing studies in the middle and right of the plot, broadly in the white area of non-significance, making publication bias plausible. In the bottom diagram there is a suggestion of missing studies on the bottom left hand side of the plot. Since most of this area contains regions of high significance, publication bias is unlikely to be the underlying cause of asymmetry
Statistical tests for funnel plot asymmetry
A test for funnel plot asymmetry (sometimes referred to as a test for small study effects) examines whether the association between estimated intervention effects and a measure of study size is greater than might be expected to occur by chance. These tests typically have low power, so even when a test does not provide evidence of asymmetry, bias cannot be excluded. For outcomes measured on a continuous scale a test based on a weighted linear regression of the effect estimates on their standard errors is straightforward.1 When outcomes are dichotomous and intervention effects are expressed as odds ratios, this corresponds to an inverse variance weighted linear regression of the log odds ratio on its standard error.2 Unfortunately, there are statistical problems because the standard error of the log odds ratio is mathematically linked to the size of the odds ratio, even in the absence of small study effects.2 4 Many authors have therefore proposed alternative tests (see appendix on bmj.com).4 26 27 28
Because it is impossible to know the precise mechanism(s) leading to funnel plot asymmetry, simulation studies (in which tests are evaluated on large numbers of computer generated datasets) are required to evaluate test characteristics. Most have examined a range of assumptions about the extent of reporting bias by selectively removing studies from simulated datasets.26 27 28 After reviewing the results of these studies, and based on theoretical considerations, we formulated recommendations on testing for funnel plot asymmetry (box 2). The appendix describes the proposed tests, explains the reasons that some were not recommended, and discusses funnel plots for intervention effects measured as risk ratios, risk differences, and standardised mean differences. Our recommendations imply that tests for funnel plot asymmetry should be used in only a minority of meta-analyses.29
Box 2: Recommendations on testing for funnel plot asymmetry
All types of outcome
As a rule of thumb, tests for funnel plot asymmetry should not be used when there are fewer than 10 studies in the meta-analysis because test power is usually too low to distinguish chance from real asymmetry. (The lower the power of a test, the higher the proportion of “statistically significant” results in which there is in reality no association between study size and intervention effects). In some situations—for example, when there is substantial heterogeneity—the minimum number of studies may be substantially more than 10
Test results should be interpreted in the context of visual inspection of funnel plots— for example, are there studies with markedly different intervention effect estimates or studies that are highly influential in the asymmetry test? Even if an asymmetry test is statistically significant, publication bias can probably be excluded if small studies tend to lead to lower estimates of benefit than larger studies or if there are no studies with significant results
When there is evidence of funnel plot asymmetry, publication bias is only one possible explanation (see box 1)
As far as possible, testing strategy should be specified in advance: choice of test may depend on the degree of heterogeneity observed. Applying and reporting many tests is discouraged: if more than one test is used, all test results should be reported
Tests for funnel plot asymmetry should not be used if the standard errors of the intervention effect estimates are all similar (the studies are of similar sizes)
Continuous outcomes with intervention effects measured as mean differences
The test proposed by Egger et al may be used to test for funnel plot asymmetry.1 There is no reason to prefer more recently proposed tests, although their relative advantages and disadvantages have not been formally examined. General considerations suggest that the power will be greater than for dichotomous outcomes but that use of the test with substantially fewer than 10 studies would be unwise
Dichotomous outcomes with intervention effects measured as odds ratios
The tests proposed by Harbord et al26 and Peters et al27 avoid the mathematical association between the log odds ratio and its standard error when there is a substantial intervention effect while retaining power compared with alternative tests. However, false positive results may still occur if there is substantial between study heterogeneity
If there is substantial between study heterogeneity (the estimated heterogeneity variance of log odds ratios, τ2, is >0.1) only the arcsine test including random effects, proposed by Rücker et al, has been shown to work reasonably well.28 However, it is slightly conservative in the absence of heterogeneity and its interpretation is less familiar than for other tests because it is based on an arcsine transformation.
When τ2 is <0.1, one of the tests proposed by Harbord et al,26 Peters et al,27 or Rücker et al28 can be used. Test performance generally deteriorates as τ2 increases.
Funnel plots and meta-analysis models
Fixed and random effects models
Funnel plots can help guide choice of meta-analysis method. Random effects meta-analyses weight studies relatively more equally than fixed effect analyses by incorporating the between study variance into the denominator of each weight. If effect estimates are related to standard errors (funnel plot asymmetry), the random effects estimate will be pulled more towards findings from smaller studies than the fixed effect estimate will be. Random effects models can thus have undesirable consequences and are not always conservative.30
The trials of intravenous magnesium after myocardial infarction provide an extreme example of the differences between fixed and random effects analyses that can arise in the presence of funnel plot asymmetry.31 Beneficial effects on mortality, found in a meta-analysis of small studies,32 were subsequently contradicted when the very large ISIS-4 study found no evidence of benefit.33 A contour enhanced funnel plot (fig 4⇓) gives a clear visual impression of asymmetry, which is confirmed by small P values from the Harbord and Peters tests (P<0.001 and P=0.002 respectively).

Fig 4 Contour enhanced funnel plot for trials of the effect of intravenous magnesium on mortality after myocardial infarction
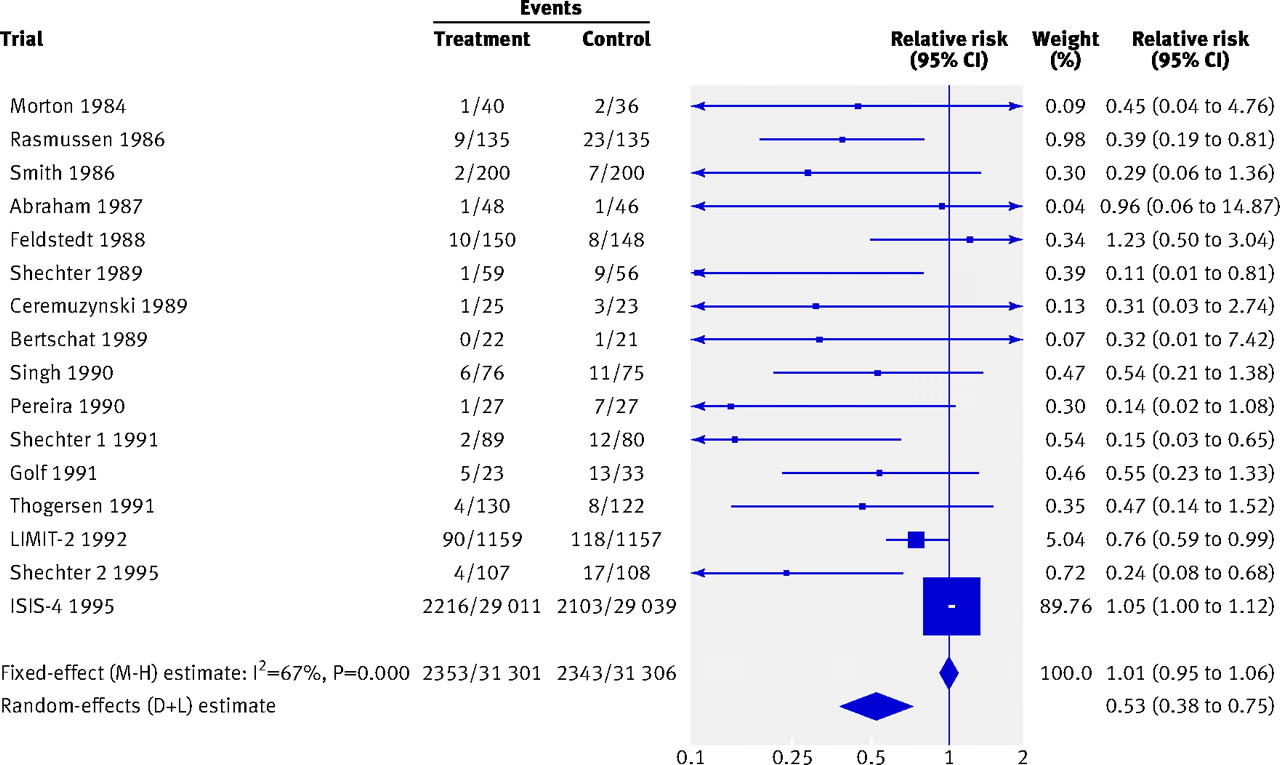
Figure 5⇓ shows that in a fixed effect analysis ISIS-4 receives 90% of the weight, and there is no evidence of a beneficial effect. However, there is clear evidence of between study heterogeneity (P<0.001, I2=68%), and in a random effects analysis the small studies dominate so that intervention appears beneficial. To interpret the accumulated evidence, it is necessary to make a judgment about the validity or relevance of the combined evidence from the smaller studies compared with that from ISIS-4. The contour enhanced funnel plot suggests that publication bias does not completely explain the asymmetry, since many of the beneficial effects reported from smaller studies were not significant. Plausible explanations for these results are that methodological flaws in the smaller studies, or changes in the standard of care (widespread adoption of treatments such as aspirin, heparin, and thrombolysis), led to apparent beneficial effects of magnesium. This belief was reinforced by the subsequent publication of the MAGIC trial, in which magnesium added to these treatments which also found no evidence of benefit on mortality (odds ratio 1.0, 95% confidence interval 0.8 to 1.1).34

Fig 5 Comparison of fixed and random effects meta-analytical estimates of the effect of intravenous magnesium on mortality after myocardial infarction
We recommend that when review authors are concerned about funnel plot asymmetry in a meta-analysis with evidence of between study heterogeneity, they should compare the fixed and random effects estimates of the intervention effect. If the random effects estimate is more beneficial, authors should consider whether it is plausible that the intervention is more effective in smaller studies. Formal investigations of heterogeneity of effects may reveal explanations for funnel plot asymmetry, in which case presentation of results should focus on these. If larger studies tend to be methodologically superior to smaller studies, or were conducted in circumstances more typical of the use of the intervention in practice, it may be appropriate to include only larger studies in the meta-analysis.
Extrapolation of a funnel plot regression line
An assumed relation between susceptibility to bias and study size can be exploited by extrapolating within a funnel plot. When funnel plot asymmetry is due to bias rather than substantive heterogeneity, it is usually assumed that results from larger studies are more believable than those from smaller studies because they are less susceptible to methodological flaws or reporting biases. Extrapolating a regression line on a funnel plot to minimum bias (maximum sample size) produces a meta-analytical estimate that can be regarded as corrected for such biases.35 36 37 However, because it is difficult to distinguish between asymmetry due to bias and asymmetry due to heterogeneity or chance, the broad applicability of such approaches is uncertain. Further approaches to adjusting for publication bias are described and discussed in the appendix.
Discussion
Reporting biases are one of a number of possible explanations for the associations between study size and effect size that are displayed in asymmetric funnel plots. Examining and testing for funnel plot asymmetry, when appropriate, is an important means of addressing bias in meta-analyses, but the multiple causes of asymmetry and limited power of asymmetry tests mean that other ways to address reporting biases are also of importance. Searches of online trial registries can identify unpublished trials, although they do not currently guarantee access to trial protocols and results. When there are no registered but unpublished trials, and the outcome of interest is reported by all trials, restricting meta-analyses to registered trials should preclude publication bias. Recent comparisons of results of published trials with those submitted for regulatory approval have also provided clear evidence of reporting bias.38 39 Methods for dealing with selective reporting of outcomes have been described elsewhere. 40
Our recommendations apply to meta-analyses of randomised trials, and their applicability in other contexts such as meta-analyses of epidemiological or diagnostic test studies is unclear.41 The performance of tests for funnel plot asymmetry in these contexts is likely to differ from that in meta-analyses of randomised trials. Further factors, such as confounding and precision of measurements, may cause a relation between study size and effect estimates in observational studies. For example, large studies based on routinely collected data might not fully control confounding compared with smaller, purpose designed studies that collected a wide range of potential confounding variables. Alternatively, larger studies might use self reported exposure levels, which are more error prone, while smaller studies used precise measuring instruments. However, simulation studies have usually not considered such situations. An exception is for diagnostic studies, where large imbalances in group sizes and substantial odds ratios lead to poor performance of some tests: that proposed by Deeks et al was designed for use in this context.4
Summary points
Inferences on the presence of bias or heterogeneity should consider different causes of funnel plot asymmetry and should not be based on visual inspection of funnel plots alone
They should be informed by contextual factors, including the plausibility of publication bias as an explanation for the asymmetry
Testing for funnel plot asymmetry should follow the recommendations detailed in this article
The fixed and random effects estimates of the intervention effect should be compared when funnel plot asymmetry exists in a meta-analysis with between study heterogeneity
Notes
Cite this as: BMJ 2011;342:d4002
Footnotes
Contributors: All authors contributed to the drafting and editing of the manuscript. DA, JC, JD, RMH, JPTH, JPAI, DRJ, DM, JP, GR, JACS, AJS and JT contributed to the chapter in the Cochrane Handbook for Systematic Reviews of Interventions on which our recommendations on testing for funnel plot asymmetry are based. JACS will act as guarantor.
Funding: Funded in part by the Cochrane Collaboration Bias Methods Group, which receives infrastructure funding as part of a commitment by the Canadian Institutes of Health Research (CIHR) and the Canadian Agency for Drugs and Technologies in Health (CADTH) to fund Canadian based Cochrane entities. This supports dissemination activities, web hosting, travel, training, workshops and a full time coordinator position. JPTH was funded by MRC Grant U.1052.00.011. DGA is supported by Cancer Research UK. GR was supported by a grant from Deutsche Forschungsgemeinschaft (FOR 534 Schw 821/2-2).
Competing interests. JC, JJD, SD, RMH, JPAI, DRJ, PM, JP, GR, GS, JACS and AJS are all authors on papers proposing tests for funnel plot asymmetry, but have no commercial interests in the use of these tests. All authors have completed the ICJME unified disclosure form at www.icmje.org/coi_disclosure.pdf (available on request from the corresponding author) and declare that they have no financial or non-financial interests that may be relevant to the submitted work.
Provenance and peer review: Not commissioned; externally peer reviewed.