Decision analysis and the implementation of research findings
BMJ 1998; 317 doi: https://doi.org/10.1136/bmj.317.7155.405 (Published 08 August 1998) Cite this as: BMJ 1998;317:405
- R J Lilforda, professor of health services research,
- S G Paukerb, professor,
- D A Braunholtza, senior research fellow,
- Jiri Chardc, research associate
- aDepartment of Public Health and Epidemiology, University of Birmingham, Birmingham B15 2TT
- bDepartment of Medicine, New England Medical Centre, Tufts University, 750 Washington Street, Boston, MA 02111, USA
- cMRC Health Services Research Collaboration, University of Bristol, Bristol BS8 2PR
- aCorrespondence to: Professor Lilford rlilford@doh.gov.uk
This is the sixth in a series of eight articles analysing the gap between research and practice
Series editors: Andrew Haines and Anna Donald
Evidence based medicine is more than just reading the results of research and applying those results to patients because patients have particular features that may make them different from the “average” patient studied in a clinical trial.1There are two types of differences. The first type of differences comprise those that affect probability (for example, the probability that treatments will have the same absolute or relative effects as those measured in the trial). The second type of differences comprise those values (or utilities) that affect how much of a side effect a person is prepared to trade off against the positive advantages of treatment.
Thus it is necessary for doctors to relate the results from a trial to their particular patient. Health professionals usually do this intuitively, but formal decision analysis provides an intellectual framework for developing an explicit decision making algorithm which can be criticised and improved. Although, currently, time constraints make it unrealistic to conduct a separate decision analysis for each patient, computer programs may soon help overcome this problem. It is, however, feasible for decision analyses to be done for categories of patients with similar clinical features and personal utilities. The results of such generic decision analyses provide a sound basis for developing clinical guidelines. Decision analysis thus provides a rational means of allowing health professionals to move from finding evidence to implementing it.
Summary points
Decision analysis reconciles evidence based medicine with patients'preferences
Decision analysis uses Bayesian probabilities together with values assignedto different outcomes to determine the best course of action
Although it is currently unrealistic to do a separate decision analysis foreach patient, computer programs may soon overcome this problem
In the meantime, decision analysis can be used to provide guidelines for managing groups of patients with similar clinical features
Calculating specimen decision analyses can be helpful for patients with different values
Anexample of decision analysis
Decision analysis is described in detail elsewhere,2–5but we will illustrate it with an example. Megatrials have shown that thrombolytic drugs save lives in cases of suspected myocardial infarction.6However, these drugs can cause stroke, which may leave the patient severely incapacitated. Also, there is a choice of drugs; the genetically engineered accelerated tissue plasminogen activator seems more effective than streptokinase in preventing death from myocardial infarction, but it has a higher chance of causing stroke. The risk of causing a stroke does not depend on when treatment is given. However, the probability of preventing death from myocardial infarction does depend on how soon treatment begins after the onset of symptoms and on whether the patient has actually had a myocardial infarction and on their risk of dying if they have had one. To further complicate the picture, the relative advantage of tissue plasminogen activator over streptokinase in preventing cardiac death dissipates after about six hours, and thrombolytic drugs can cause other complications (such as haemorrhage and anaphylaxis).

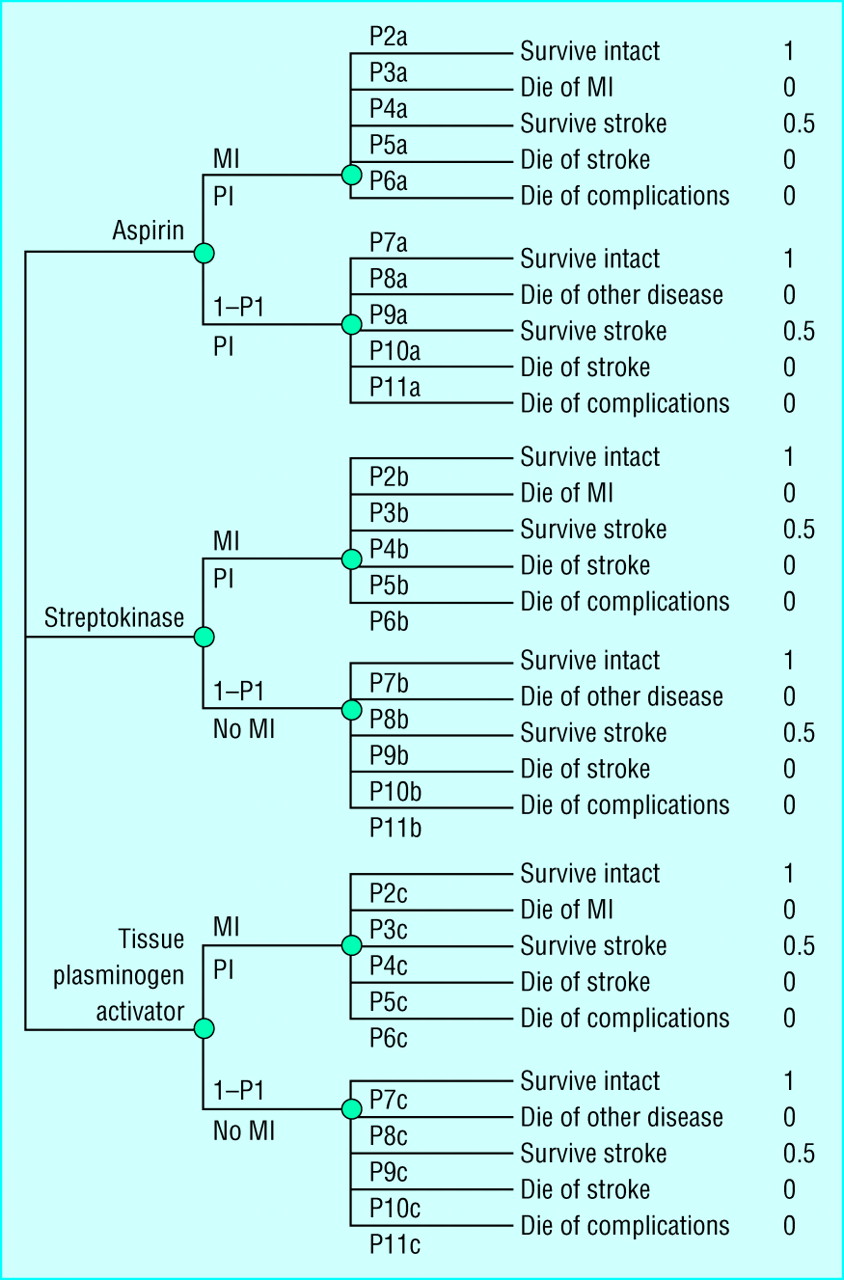
How can the clinician account for these factors? We base our example on the work of Kellett and Clarke, who did a systematic review and then modelled all of these variables using decision analysis (fig 1).7Probabilities of the main outcomes according to the treatment given are presented in table (table 1). Specimen utilities are used for the various outcomes, a value of 1 for healthy survival and 0 for death. About half of patients who have a stroke in these circumstances will survive, but often with some degree of impairment; the mean utility of existence after stroke is 0.5.8 The results of running the base case model (that is, for a 55 year old man with chest pain of recent onset and classical changes on electrocardiography, typical of participants in trials of thrombolysis) are shown in table (table 2). Clearly, there is much expected utility to be gained by using thrombolytic drugs, and, moreover, tissue plasminogen activator is the drug of choice. Even if we assume a passionate desire to avoid the disability associated with stroke, giving it a utility of −1 (for example, a healthy person who would equate a 20% risk of death with a 10% risk of stroke), the thrombolytic treatments remain optimal (data not shown). However, we get very different results as we move away from the base case. For example, chest pain in a 55 year old man with a normal electrocardiogram is associated with only a 17% risk of myocardial infarction, and thrombolytic drugs would lower the expected utility in these circumstances. The same man with a normal ST wave but an abnormal T wave has about a 24% risk of myocardial infarction; thrombolysis is advantageous, but only slightly and it would be disadvantageous if he was younger (his risk of dying if he had a myocardial infarction would drop to 5% at age 45), if he presented late (after 6 hours), or if he was particularly strongly averse to residual morbidity from stroke.
Key definitions in decision analysis Utility
A utility represents a patient's preference for one outcome over others. A utility is given a numerical value which is then used in the decision analysis. Utilities (or values) are quantified on a scale (usually from 0 to 1) that allows meaningful comparison between alternative outcomes.
Probability
Decision analysis is based on bayesian statistics. Probabilities of clinical outcomes are the doctor's best guess, based on indirect evidence such as laboratory studies, updated with data from relevant clinicalstudies by Bayes's theorem.
Decision tree
The various decision points and their consequences are mapped (with their associated probabilities and utilities) to form a decision tree—a visual representation of the decisions available. The aim of decision analysis is the logical reduction of a decision process into its individual decision points. Probabilities and utilities are assembled logically to determine the optimum treatment (that is, the treatment with the highest expected utility).
Sensitivity analysis
Sensitivity analysis is used to determine the robustness of a choice made using decision analysis. By varying the utilities and outcome probabilities it is possible to see how easily a decision would change—that is, how sensitive it is. This makes it possible to produce guidelines so that treatment can be tailored to groups of patients with similar characteristics; the final choice is, of course, the patient's.

Decision tree for choice of treatment in case of suspected myocardial infarction (MI) of aspirin only v aspirin and streptokinase v aspirin and tissue plasminogen activator. P stands for probability. For example, P2a is the probability of surviving without impairment for someone who has had an MI and who has been treated with aspirin only. The formulas for expected utilities are aspirin, P1{(1*P2a) + (0*P3a) + (0.5*P4a) + (0*P5a) + (0*P6a)} + (1P1){(1*P7a) + (0*P8a) + (0.5*P9a) + (0*P10a) + (0*P11a)}; streptokinase, P1{(1*P2b) + (0*P3b) + (0.5*P4b) + (0*P5b) + (0*P6b)} + (1P1){(1*P7b) + (0*P8b) + (0.5*P9b) + (0*P10b) + (0*P11b)}; tissue plasminogen activator, P1{(1*P2c) + (0*P3c) + (0.5*P4c) + (0*P5c) + (0*P6c)} + (1P1){(1*P7c) + (0*P8c) + (0.5*P9c) + (0*P10c) + (0*P11c)}. Figures on the far right are values
Probability
Effective care in general, and decision analysis in particular, are underpinned by probabilities. Much of clinical research is concerned with providing the necessary probabilistic information.
Epidemiological studies provide baseline estimates of risk (for example, the risk of death from myocardial infarction) and data for revising these risks on the basis of test results (here test denotes any information about a patient, not only results from a laboratory). The ratio of the probability of an observed test result if the patient is or is not affected is known as the likelihood ratio. Given the patient's prior odds of being affected (odds are simply a ratio of probabilities) and the likelihood ratio for the observed test result, the revised (posterior) odds, and hence the probability that the patient is affected by a condition, can be calculated by multiplying the prior odds by the likelihood ratio. For example, a young woman whose only brother has Duchenne's muscular dystrophy has prior odds of being a carrier of the disease of 1:2. A raised concentration of creatine kinase (likelihood ratio 28) gives posterior odds of 14:1 (a probability of 93%). Likelihood ratios of multiple tests can be multiplied together, provided they are relatively independent.
Probabilities of various events occurring after suspected myocardial infarction according to treatment received by a typical patient in the trials and according to whether myocardial infarction has occurred. Probabilities are expressed as percentages
Interventional studies such as clinical trials provide data on the effects of treatments. These studies can give two kinds of probability:conventional and bayesian. Conventional (frequentist) statistical analyses give P values and confidence intervals based on the probability of seeing the observed result (or a more extreme result)given a particular state of the world, typically that different treatments are equally effective. However, decision analysis, and bedside decisions generally, requires not the probability of already observed results given some assumed particular treatment effect, but rather the posterior probabilities of particular differences in the effects, given the observed data.9
Relative expected utilities of aspirin v aspirin and streptokinase v aspirin and tissue plasminogen activator determined for different probabilities of myocardial infarction and death given myocardial infarction. Probabilities are expressed as percentages
If a trial comparing treatments X and Y finds an improvement in survival of 10 percentage points with treatment Y, a patient who is similar in relevant characteristics to those in the trial does not want to know that this observed improvement had only a 2.5% chance of occurring if the treatments are equivalent. The patient needs to know, for example, what the probability is that survival with treatment Y really is better than with treatment X. Probabilities that describe beliefs about the size of true effects are known as bayesian, and their calculation requires that a prior belief, expressed as a probability distribution, is updated according to the results of research. Because bayesian probabilities relate to the probability of the true state of the world they are the rational basis for the implementation of a finding and for calculating parameters, such as the number of patients who must receive a new treatment to help (or harm) one patient. When studies are very large, as in trials of thrombolytic drugs, the two types of statistics will give similar results.
In our example of a myocardial infarction we considered two kinds of patient variables. We first considered features that affect absolute risk, such as age, but not relative treatment effects, such as the 25%improvement in cardiac mortality that occurs over a wide range of ages when patients are treated with thrombolytic drugs. The second type of patient variable has an influence on relative treatment effects (for example, the duration of symptoms affects the effectiveness of thrombolysis). Of course, if trials were infinitely large we could look up the precise relative treatment effect for any given category of patient. However, even when overall effects are measured precisely the effects in subgroups of patients (strata) are typically imprecise.
Should clinicians take the overall effect and apply it to the subgroup, or should they use the imprecise measurement made in the subgroups? For example, the second international study of infarct survival (ISIS 2)trial of thrombolytic drugs was analysed in subgroups. Unsurprisingly, this showed a null effect for people who had had their pain for a long time, but it also unexpectedly found a null effect for those born under the star sign Gemini. On what basis can we believe one analysis of a subgroup and not the other? In a bayesian analysis of subgroups we must state our prior beliefs for how the effect in the subgroup may relate to the effect in the remainder of the group. 10 11This prior belief would be that there is little or no difference between Geminis and non-Geminis. The observed difference will therefore fail to shift our prior belief, and our posterior belief will remain that Geminis and non-Geminis benefit similarly. Our prior belief in the difference between patients with prolonged pain and others would be less precise and would reflect our belief that those with prolonged pain will benefit less than patients with a shorter duration of pain; for example, from our knowledge of drugs and infarcts, we expect the benefits to be largest when these drugs are administered quickly. In this case the data reinforce our prior belief and enable us to be more precise about how benefit is reduced as delay increases.
Values (utilities)
The great strength of decision analysis is that it is based not just on probabilities but also on the value placed on various outcomes. It therefore represents a method for synthesising both medical facts (probabilities) and human values (utilities), which together determine the best course of action—that is, the course that stands to maximise expected utility.12Decision analysis reconciles evidence based medicine with patients'preferences.
There is debate about the best way to obtain these utilities. Utilities imply a trade off: the extent to which the disadvantages of one outcome can be offset by the advantages of another. For example, for certain patients with cancer of the larynx survival is better for those who have radical surgery than for those treated with radiotherapy. However, radical surgery limits the ability to speak, at least in the short term. There is then a trade off between survival (maximised by surgery) and the ability to communicate (which is retained to a much better degree with radiotherapy). If a patient would run a 10% chance of dying to avoid losing the power of speech then the patient values life with this impediment at 0.9 on a scale from 1.0 (healthy life) to 0 (death). The subject of utilities and how they can be elicited is discussed in more detail elsewhere.13–16
Sensitivity analysis, generic decision analysis,and the individual patient
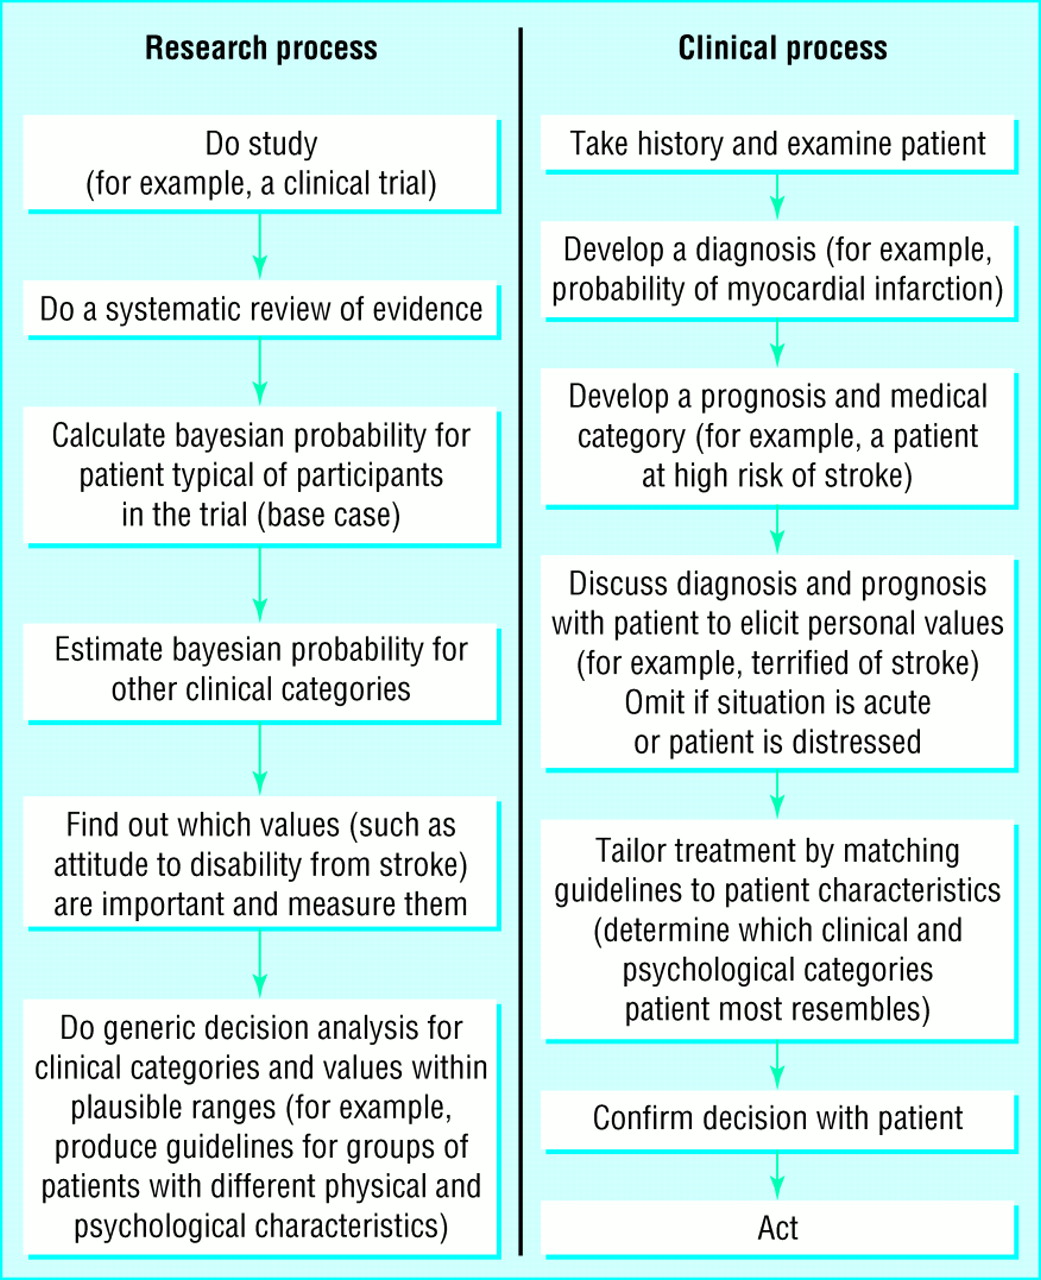
When consulting with individual patients it is important to elicit their personal values or at least to get a sense of them. However, it is not essential to redo an analysis for every patient in a busy clinic. Decision analysis may also be done outside the consulting room using a selection of different probability and utility figures within a reasonable range; this is known as sensitivity analysis. We used this technique to see how the expected utility of thrombolytic drugs might vary according to a patient's medical and psychological characteristics to produce the guidelines in table (table 2). The sequence of events followed in performing a decision analysis, developing a guideline based on that analysis, and implementing the guideline are shown in figure 2.

The sequence of events followed in performing a decision analysis, developing a clinical guideline based on the analysis, and implementing the guideline
Information on short term outcomes is often available from clinical trials but long term outcomes must be derived from observational studies. Since long term outcomes are often more important to the patient and third party payer, these should be modelled by decision analysis. For example, modelling was required to extrapolate the results of a trial evaluating the short term effects of different types of angioplasty from the information collected in the trial.17 Decision analysis is also useful when a clinical problem requires input from more than one set of study results; the effects of hormone replacement therapy have been analysed in many different studies, each concerned with different outcomes and with each outcome being valued differently.18Furthermore, observational studies have shown that women have different risks at baseline (for example, thin women are at higher risk of fractures). Decision analysis has shown how these factors may be integrated to optimise individual treatment.19
Decision analysis is used to determine how to maximise an individual's expected utilities. By obtaining the median values of utilities from a large number of people the methodology can also be used to derive expected utilities for the community. When the costs of various options are included this is called a cost utility analysis. However, using decision analysis to make decisions for groups of patients creates some thorny ethical issues, especially when there is a conflict between maximising utility and maximising equity.
Conclusions
Decision analysis depends on probabilities and values, neither of which can be measured with certainty. These problems are not lessened when health professionals approach them intuitively; decision analysis makes these uncertainties explicit. The attempt to make complex decisions intuitively inevitably results in gross oversimplifications because it is impossible to incorporate and consider several components of a decision simultaneously. There is a large amount of empirical literature on the limitations of intuitive reasoning that is summarised by Dawes et al.20
Most research findings are applied unsystematically and intuitively. If evidence based medicine is to be seen through to its logical conclusion and if both empirical evidence and human values are to be incorporated into decision making, then this duality (the explicit collection of data v its implicit use) must be addressed.21 22