Article Text

Abstract
Objective To assess the effect of a real world, ongoing telehealth service on the use of secondary healthcare.
Design A retrospective observational study with anonymous matched controls.
Setting Primary and community healthcare. Patients were recruited over 4 years in 89 general practices in Liverpool, UK and remotely managed by a dedicated clinical team in Liverpool Community Health.
Participants 5154 patients with chronic obstructive pulmonary disease, heart failure or diabetes were enrolled in the programme, of whom 3562 satisfied the inclusion criteria of this study.
Intervention At least 9 weeks of telehealth including vital sign collection, questionnaires, education, support and informal coaching by clinical staff.
Primary outcome Reduction in the number of emergency admissions in the 12 months after start, compared with the year before start. Secondary subgroup analysis to improve future targeting and personalisation of the service.
Result The average number of emergency admissions for the intervention group at baseline is 0.35, 95% CI 0.32 to 0.38. The differential decrease in emergency admissions in the intervention group in comparison with the control group, the average treatment effect, is 0.08, 95 CI 0.05 to 0.11, corresponding to an average percentage decrease of 22.7%. In subgroup analysis, a score is calculated that can be used prospectively to predict individual benefit from the intervention. Patients with an above median score (37%) are predicted average reduction in emergency admissions of 0.15, 95% CI 0.09 to 0.2, corresponding to a percentage decrease in admissions of 25.3%.
Conclusion The telehealth intervention has a positive impact across a wide cohort of patients with different diseases. Prospective scoring of patients and allocation to targeted telehealth interventions is likely to improve the effectiveness and efficiency of the service.
- primary care
- telemedicine
- chronic airways disease
- heart failure
- diabetes & endocrinology
This is an open access article distributed in accordance with the Creative Commons Attribution Non Commercial (CC BY-NC 4.0) license, which permits others to distribute, remix, adapt, build upon this work non-commercially, and license their derivative works on different terms, provided the original work is properly cited, appropriate credit is given, any changes made indicated, and the use is non-commercial. See: http://creativecommons.org/licenses/by-nc/4.0/.
Statistics from Altmetric.com
Strengths and limitations of this study
A real-world telehealth study with a comparatively large number of participants.
Use of anonymised matched controls and a careful matching methodology to limit selection bias. Methodological limitations of this study are:
Beyond the 9-week minimal intervention length cut-off for inclusion in the analysis, patients received the intervention at various lengths and with possible interruptions.
Pseudonymisation codes for patients refusing the intervention were not recorded. It is therefore not known to what extent they are included in the matched control cohort.
In spite of care taken to limit confounding due to selection bias in the control group, some residual confounding may remain.
Introduction
One of the top priorities in the UK health system has been to reduce avoidable admissions.1 These account for 16% of emergency admissions at a cost of £1.42 billion in 2012 and are rising fast. Less than half of that increase can be explained by population growth and ageing.2 This suggests that other, modifiable, factors are related to the occurrence of these admissions. Healthcare systems have responded to these challenges with disease management programmes that bring together themes of proactive management of chronic disease, empowerment of patients, integrated models of care, support for self-management and prevention. In Liverpool, UK, these themes have been combined into a growing and ongoing telehealth programme on the initiative of the Clinical Commissioning Group (CCG). Telehealth is used across Liverpool to empower patients to actively manage long-term conditions such as chronic obstructive pulmonary disease (COPD), heart failure (HF) and type 2 diabetes (T2DIA) to encourage behaviour change through supported care. The service has evolved over time to offer more efficient and effective clinical pathways and processes for delivering care. It can help patients to stay well and become more independent while giving them and their families or carers peace of mind in their own homes.
There is recognition in the literature that the evidence for telehealth is contradictory.3 At the same time, there are ongoing programmes with telehealth aspects that address the inexorable pressure that healthcare systems face. It is therefore important that large programmes ensure that their results make their way into the scientific literature and overcome methodological challenges that this invariably presents. In that context, it is instructive to look at a few larger trials and observational studies in more detail, partly to put the patient numbers we report on here in perspective, partly to illustrate the heterogeneity of interventions and partly to provide a context for a discussion on evaluation methods below. Table 1 summarises the patient numbers and key results. For completeness, we have added the result from this work in this table.
Summary results from larger studies in the literature and this work showing some heterogeneity in reported measures and evaluation methods used
The VHA work4 5 has run for many years the world’s largest and ongoing telehealth programme. In 2011, it was said to manage 50 000 patients annually with a broad range of conditions such as diabetes, hypertension, Chronic Heart Failure, COPD, Post Traumatic Stress Disorder, Depression and Mental Health. The WSD6 trail addressed people with diabetes, COPD or HF with three different telehealth interventions in three different regions. Gesundes Kinzigtal7 8 was a broad population health programme (ACO) in southwest Germany that enrolled 9568 people over a range of 20 preventative and health promotion programmes. A project of a regional insurance company in Bayern9 in Germany targeted patients with COPD. Monitoring of spirometry, oximetry and questionnaires (CAT and general well-being) was complemented by telephone coaching at 2–3-week intervals. The Healthlines10 programme provided telephone coaching to patients at risk of a cardiovascular event in the next 10 years of 20% or more calculated using the QRISK2 score. Coaching occurred monthly by lay health advisors using coaching content from Duke University. Patients also self-monitored some vitals.
The purpose of this paper is to evaluate the impact of the telehealth programme in Liverpool and place its benefit or otherwise in the context both of other published programmes of similar size and in the context of the overall healthcare system in Liverpool.
Methods
Participants
The programme was rolled out across Liverpool on a General Practitioner (GP) practice by GP practice basis. The clinical lead of the telehealth nursing hub visited each GP practice to inform the practice team and seek their agreement to join the programme. After agreement with the practice team, patients were identified using a search of the practice register which included the following criteria:
Patients had to be 18 years of age or over.
They had to have a confirmed diagnosis of either COPD, HF and/or T2DIA.
Patients registered as Palliative were highlighted but not excluded—the primary clinician (GP) was responsible for deciding their inclusion.
Mental capacity. The search identified patients with dementia; these patients were not excluded but suitability is assessed at the enrolment visit by the nurse assessor.
The search also identified patients that had been on telehealth before.
Patients were approached by phone on behalf of their GP practice by the telehealth nursing hub. They were offered a personal visit to explain the programme and to assess individual needs and suitability. Ultimately, it was the patient’s choice if they wished to participate in telehealth. If the patient agreed to join the programme, formal informed consent was obtained. The details of these steps were adjusted during the programme in response to patient feedback and clinical input. It was found that 37% of patients agreed at the phone stage, of whom 60% would then consent at the personal visit. The equipment was installed separately by technical experts, who also undertook patient training. Negligible attrition took place at the installation stage, but 7% of patients requested deinstallation within 4 weeks of starting the programme. Patients followed the telehealth programme for typically 5 months, but depending on their progress and residual clinical and psychological need, the programme length was altered. Over the 4 years of the programme, it was possible that individuals were enrolled more than once. Where this has happened, the first enrolment date was taken as the start of the programme.
Patient and public involvement
Liverpool CCG has an ongoing programme of patient and public involvement. In particular, the published findings (https://www.liverpoolccg.nhs.uk/get-involved/previous-consultations-engagements/healthy-liverpool/) of the ‘Healthy Liverpool’ programme on Digital Care and Innovation, GP and Community Care and Urgent and Emergency Care were incorporated in the development of the telehealth programme. However, patients were not directly involved in the design of the telehealth service. No participants were involved in the design or conduct of this research study. There are no plans to disseminate the results of the research individually to patients.
Data sourcing and processing
Risk modelling has become an important part of healthcare delivery.11 In Liverpool, the Welsh Predictive Model12 is used to predict per patient the probability of an emergency admission in the next 12 months. Every month, data are collected from primary care, secondary care and demographic sources and a risk score is generated from a number of variables including demographics, polypharmacy, comorbidity and previous service utilisation. The calculated risk score and the risk factors, alongside some clinical disease registers and service utilisation statistics are then made available. Clinicians use this for direct patient care. Liverpool CCG receives a pseudonymised version for commissioning purposes. These data were used here.
Data were pseudonymised at source, using a tool with a unique key. NHS numbers are replaced by pseudonymised alphanumeric codes, date of birth is changed to age and postcode is shortened to the first four digits. For the authors of this paper, the pseudonymisation was irreversible. Therefore, the data flows were outside the General Data Protection Regulation and satisfied the Duty of Confidentiality.
A Data Protection Impact Assessment was completed to enable understanding of the controls put in place for the data flows. Data Sharing Agreements existed with all parties.
Matched controls
The matching methodology is as follows:
Intervention subjects are matched with up to three randomly drawn controls who, on the (first) date of enrolment of the intervention subject, match that subject exactly in terms of COPD, HF and diabetes (co)morbidity and who have had the same number of emergency admissions in the previous 12 months. Moreover, the match is also made within a maximum combined distance against the continuous variables of risk, age, deprivation and polypharmacy. Controls are randomly drawn with replacement, so they can be candidates for other intervention subjects, though not in the same starting month.
The controls for each intervention subject are combined (averaged) into a single, constructed control subject per intervention subject. This step avoids evaluation bias for those intervention subjects with a full set of controls over those with fewer controls.
Subgroups of the intervention and control group are always created pairwise. This avoids selection bias of, for instance, high acuity intervention subjects whose high acuity controls may be dropping out of the data set. Consequently, for each subset, only intervention subjects with existing control data are included.
Inclusion for analysis
To be included in the analysis, the records for each patient have to satisfy the following:
They have risk data for the month that they start the service and 3 months afterwards. This is so that controls can be matched to patient characteristics at the start of the service.
At a chosen evaluation month (typically 12 months after the start of service), there are risk data for the patient in the intervention group and the anonymous control patient(s).
Patients have participated for at least 9 weeks in the service.
The effects of inclusion items 2 and 3 on the primary outcome are explored in the online supplemental information.
Supplemental material
Intervention
A clinically led nursing hub that interfaces with both patients and their primary carer was responsible for the daily monitoring and triage of patients on their caseload. The hub’s primary objective was to empower patients to actively self-manage their disease through coaching and education. Patients accessing the service were issued with a tablet PC (https://www.philips.co.uk/healthcare/solutions/population-health-management) wirelessly connected to vital sign measurement equipment such as weight scales, blood pressure devices and pulse oximeters. Patients also received scheduled education videos about their condition, symptom surveys and regular mental and physical health questionnaires. The information was collected via the tablet PC and transferred securely to a clinical user interface (CUI) in the clinical hub. The CUI raised alerts where necessary for the staff to respond to. The CUI provided clinical overviews for all patients and staff could also consult the GP records for each patient. Staff interacted with patients and liaised with the GP practice either through the CUI or by telephone.
Developed under the supervision of a Clinical Reference Group, a series of clinically designed digital care plans determined the scheduling and selection of the questionnaires, education videos and the regularity at which vital sign information was collected based on the patients’ disease condition. All care plans followed NICE guidelines but could be tailored by senior clinicians to meet individual needs.
Prospective scoring
To assist appropriate targeting of the service in future and enable the personalisation of telehealth, we analyse characteristics, activities and attitudes that would be able to identify, in advance, those patients that are likely to see a significant decrease in admissions in comparison to the control group.
Telehealth activity indicators may be predictive factors for a beneficial outcome of a telehealth service. The factors we use are the number of days per month a person generates tasks (hub workload), the average number of vital sign measurements they complete (programme compliance) and self-reported indicators such as changes in lifestyle, preparedness to use telehealth in the future and the friends and family test (engagement). These predictive factors help to optimise the delivered service and can be used to identify patients that will benefit from the service with greater accuracy. The prospective score used here is an equal weight combination of the regression score of the telehealth activity indicators and emergency admissions risk calculated using the Welsh Model12 parameters, the latter with regression coefficients that were optimised for the Liverpool population.
Results
Patient characteristics
In total there were 5154 patient enrolments between March 2013 and November 2017 from 89 GP practices in Liverpool. Of these 72 involved patients that had enrolled/disenrolled some time before. In total there were 5082 patients uniquely identified by pseudonymised code.
Of these, 4875 patients satisfy criterion 1 and 3562 satisfy all three criteria. Descriptive baseline statistics are given in figures 1 and 2.
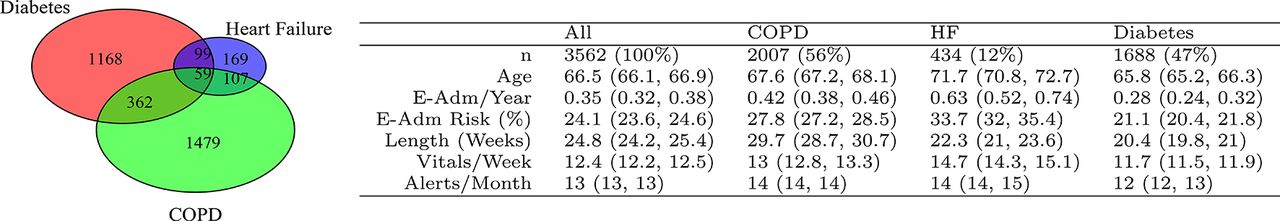
Characteristics of the patient cohort. The Venn diagram illustrates patient numbers in different disease groups and comorbidities. For instance, 59 patients had diabetes and HF and COPD. The table provides average values and 95% CI. E-Am/Year: number of emergency admission in the year before joining the programme, E-Adm Risk: probability of one or more emergency admissions in the next 12 months calculated at the point of joining, Length (weeks): mean duration of the programme for an individual, Vitals/Week: mean number of vital sign measurements submitted per week, Alerts/Months: mean number of days per month an alert was generated in the clinical hub. COPD, chronic obstructive pulmonary disease; HF, heart failure.

Distribution statistics of the entire intervention cohort. Mean values are given in column ‘all’ in figure 1. Shown is the distribution of participant age at the time of joining the programme, the probability of one or more emergency admissions in the next 12 months calculated at the point of joining, and the length in weeks that people were on the programme. Note the lower cut-off at 9 weeks as this was an inclusion criterion.
The average number of vital measurements (Blood Pressure, weight, SpO2 and glucose) that people submitted via the technology was 12.4 (12.2, 12.5) per week This varied with each telehealth protocol ranging from 8 to 17. The average SD inside each protocol group is 3.8, whereas the SD of the means of the protocol groups is 2.5. Hence the variation between groups is less than the variation inside each group. People also submitted survey responses. The mean number of survey responses was 2.2 per week.
On average, the submitted vitals, surveys and scheduled reviews triggered alerts on 9 days per month per patient.
Matching quality
All 4875 unique patient IDs that satisfy criterion 1 are used in the matching. On average, 2.998 (CI 2.996 to 2.999) controls were found for each intervention patient. This average is slightly lower for higher risk patients. For instance above 25% risk, the average is 2.994 (CI 2.99 to 2.999).
Because control matching is performed with replacement, a single control may be used multiple times, in different months. Table 2 illustrates the number of times unique controls are used in total. Out of the 10 627 unique controls, 7986 were used once, 1818 were used twice and so on.
Frequency table of the number of times each unique control used as match against an intervention subject
As mentioned, the matching between intervention and control individuals for disease and the number of previous admissions is exact by design and therefore perfect (R 2=1, S=1). The matching for the continuous variables of risk, age, deprivation and polypharmacy is shown in figure 3. Note that the slope for Risk is close to unity (S=0.99), but less for age, deprivation and polypharmacy (S=0.9–0.93), which means that (on average) control subjects are slightly younger, better off and lower pharmacy users than their respective intervention subjects.

Match between intervention and control parameters. Shown are the correlation plots for risk of one or more emergency admissions in the next 12 months calculated at the point of joining. Age, deprivation score and polypharmacy use also all observed at the point of joining the programme.
Primary outcome results
The analysis in this and subsequent sections applies to the 3562 patients that satisfy all three criteria for a 12 month evaluation date.
The estimated average number of emergency admissions for the intervention group is 0.35, 95% CI 0.32 to 0.38. As shown in table 3, for the controls the estimated average number of emergency admissions is numerically identical at the stated accuracy. The difference between the decrease in emergency admissions in the intervention group and the decrease in the control group, the average treatment effect, is 0.08, 95% CI 0.05 to 0.11. This corresponds to an average percentage decrease of 22.7%.
Average emergency admissions with 95% CI in the 12 months before and after start of the telehealth for the 3562 patients in the intervention arms (first two rows), the 1:1 matched controls (rows 3 and 4) and the pairwise difference between intervention subject and their matched control (last row).
Subgroups results
Impact quartiles
To study how the outcomes are distributed over patients/control pairs, pairs are grouped into quartiles by decrease in emergency admissions. Figure 4 shows the box plots for these. The first quartile contains pairs that show an increase in emergency admissions over 12 months whereas the last quartile contains pairs with the largest decreases. The results show there is an average increase in emergency admissions in the first quartile, on average no change in the second quartile and two quartiles with substantial decreases in the number of emergency admissions over 12 months.

Average emergency admissions statistics for net decrease-in-admission quartiles. Boxplots illustrate median (bold line), interquartiles (box) and extreme values (whiskers). COPD, chronic obstructive pulmonary disease.
For the two top quartiles together (the top half), the difference between the decrease in emergency admissions in the intervention group and the decrease in the control group, the average treatment effect, is 0.56, 95% CI 0.53 to 0.59, corresponding to a percentage decrease in admissions of 138%. Note that a percentage decrease larger than 100% is possible because part of the effect is due to the increase in emergency admissions in the control group.
Disease subgroups
The results within the top half by each disease group are illustrated in figure 5. The first box plot shows the top half of all the patients. The other three box plots in figure 5 split this out by disease group. Most impact can be seen for HF. For HF the effect is due to a decrease in emergency admissions in the intervention group, while for COPD the control group shows a substantial increase in emergency admissions, which adds to the effect size for that group. Hence, while for one group the intervention reduces admissions, for the other group the suggestion is that it prevents an increase. For diabetes, intervention and control show roughly equal, but opposite, effects. Overall the absolute effect is smaller for the patients with diabetes at 0.45, 95% CI 0.41 to 0.49 but, because of a low baseline, corresponds to a large percentage decrease of 171%.

Impact in the top half by disease group. Boxplots illustrate median (bold line), interquartile (box) and extreme values (whiskers), outliers beyond 1.5. IQR are plotted as dots. COPD, chronic obstructive pulmonary disease.
Prospective score subgroup
The prospective score combines the risk for emergency admissions and predictive telehealth activity indicators. Statistically significant decrease exists for the patients with an above median score of 0.15, 95% CI 0.1 to 0.21, corresponding to a percentage decrease in admissions of 27%. More information on this result can be found in the online supplemental information.
Discussion
In this paper, we have assessed the effect of a large, ongoing, real world telehealth service. Principal finding is that telehealth gives a net reduction in annual emergency admissions of 22.7%. These results are in line with that found in other studies with large patient groups.4 6 7 10 A key feature of this paper is that it concerns a large, ongoing, real world telehealth service. Real world services have larger patient numbers4 7 than even large RCTs6 10 can manage. One of the strengths of this paper is that we have sought to limit evaluation and selection bias and provide detailed results of the quality of the matching itself. We acknowledge, however, that some confounding factors13 may remain.
A feature of the results is that there are wide statistical spreads, with complex dependencies. We speculate that, if present in other studies, then it may be a contributing factor to the conflicting nature of the literature on telehealth.3 It also makes it hard to guarantee that an individual will benefit from the service in terms of reduced emergency admissions. This problem can be solved to some degree through prospective scoring to identify patients who are more likely to benefit from reduced emergency admissions. Though promising, work of the prospective scoring is at an early stage and external validation has not yet been possible to perform, which is a limitation.
A reduction in emergency admissions is not the only benefit of the telehealth service and indeed does not provide the sole, or even main, justification for it. The healthcare system in Liverpool has benefited in a number of ways from the service and uses it as an instrument of change.14 Telehealth has been a driver for service and culture change across community and hospital care. For example, the scope of the enrolment visit has been broadened to include other primary care assessments on behalf of the general practice and clinical referral pathways have widened to a ‘soft landing’ after acute hospital admissions with a facilitated phased handover to primary care. Moreover, healthcare professionals report that they are able to manage more patients on their case load: HF specialist nurses being a particular example.
For the patients, setting realistic goals has been essential in engaging them fully with the service. One patient’s goal was: ‘If I could just explain to my family what my COPD means’. Telehealth supported this aim through educational material to watch and digest at their own leisure, helping them and their families understand the condition, how it affects them and what they can do to stay well.
Footnotes
Contributors All authors have contributed to the work described in this paper, the preparation of the paper, drafting of relevant sections, revising it critically and final approval. They agree to be accountable for all aspects of the work. The authors have contributed in the following way. CvB: Statistical analysis and coordinating the preparation of the paper. PA: Project Management of the telehealth service, preparation of the intervention protocols. CH: Clinical Leadership for the telehealth hub, stakeholder management and patient champion. MS: Senior GP clinical leadership. As CCG board member responsible for the vision and objectives of the telehealth service. DH: Senior CCG programme management. Responsible for integrated and sustainable design and delivery. HD: CCG Intelligence Lead. Responsible for data quality and stewardship.
Funding The authors have not declared a specific grant for this research from any funding agency in the public, commercial or not-for-profit sectors.
Competing interests None declared.
Patient consent for publication Not required.
Provenance and peer review Not commissioned; externally peer reviewed.
Data availability statement The data were processed under the legal mandate of the CCG and cannot be transferred to a 3rd party.