Article Text

Abstract
Objective To investigate trends in incident and prevalent diagnoses of type 2 diabetes mellitus (T2DM) and its pharmacological treatment between 2000 and 2013.
Design Analysis of longitudinal electronic health records in The Health Improvement Network (THIN) primary care database.
Setting UK primary care.
Participants In total, we examined 8 838 031 individuals aged 0–99 years.
Outcome measures The incidence and prevalence of T2DM between 2000 and 2013, and the effect of age, sex and social deprivation on these measures were examined. Changes in prescribing patterns of antidiabetic therapy between 2000 and 2013 were also investigated.
Results Overall, 406 344 individuals had a diagnosis of T2DM, of which 203 639 were newly diagnosed between 2000 and 2013. The incidence of T2DM rose from 3.69 per 1000 person-years at risk (PYAR) (95% CI 3.58 to 3.81) in 2000 to 3.99 per 1000 PYAR (95% CI 3.90 to 4.08) in 2013 among men; and from 3.06 per 1000 PYAR (95% CI 2.95 to 3.17) to 3.73 per 1000 PYAR (95% CI 3.65 to 3.82) among women. Prevalence of T2DM more than doubled from 2.39% (95% CI 2.37 to 2.41) in 2000 to 5.32% (95% CI 5.30 to 5.34) in 2013. Being male, older, and from a more socially deprived area was strongly associated with having T2DM, (p<0.001). Prescribing changes over time reflected emerging clinical guidance and novel treatments. In 2013, metformin prescribing peaked at 83.6% (95% CI 83.4% to 83.8%), while sulfonylureas prescribing reached a low of 41.4% (95% CI 41.1% to 41.7%). Both remained, however, the most commonly used pharmacological treatments as first-line agents and add-on therapy. Thiazolidinediones and incretin based therapies (gliptins and GLP-1 analogues) were also prescribed as alternate add-on therapy options, however were rarely used for first-line treatment in T2DM.
Conclusions Prevalent cases of T2DM more than doubled between 2000 and 2013, while the number of incident cases increased more steadily. Changes in prescribing patterns observed may reflect the impact of national policies and prescribing guidelines on UK primary care.
- DIABETES & ENDOCRINOLOGY
- EPIDEMIOLOGY
- PUBLIC HEALTH
- THERAPEUTICS
This is an Open Access article distributed in accordance with the Creative Commons Attribution Non Commercial (CC BY-NC 4.0) license, which permits others to distribute, remix, adapt, build upon this work non-commercially, and license their derivative works on different terms, provided the original work is properly cited and the use is non-commercial. See: http://creativecommons.org/licenses/by-nc/4.0/
Statistics from Altmetric.com
Strengths and limitations of this study
This is, to the best of our knowledge, the first study to examine both changes in rates of incident and prevalent diagnosis of type 2 diabetes mellitus and antidiabetic prescribing patterns using ‘real world’ UK primary care data between 2000 and 2013.
This study does not contain data from secondary care; however, type 2 diabetes mellitus is largely managed in the primary care setting.
Although several explanations for the factors that might have triggered changes in prescribing patterns of antidiabetic medications over time are provided, there is no means of determining the exact rationale behind prescribing decisions without gathering more detailed information on prescribing for each therapeutic category.
Introduction
Type 2 diabetes mellitus (T2DM) is an increasing public health burden, and managing the disease and its complications accounts for close to 10% of the entire National Health Service (NHS) budget in the UK.1 T2DM was historically managed in hospitals, but there has been a gradual shift towards primary care. The NHS quality and outcomes framework (QOF), introduced as part of the general practitioner (GP) contract in 2004, offers several financial incentives to encourage better monitoring and management of several diseases in primary care, including diabetes.2 Hence, primary care data from the UK is increasingly being used to study the disease and its management.3 ,4
Significant developments over the past decade have influenced both the diagnosis and pharmacological treatment of T2DM in the UK. In 2000, for example, implementation of the revised WHO diabetes diagnostic criteria led to a lower fasting plasma glucose threshold of 7.0 mmol/L being used for diagnosis rather than 7.8 mmol/L.5 There has also been a greater awareness of the need for aggressive treatment of T2DM to reduce and delay long-term complications such as cardiovascular and renal disease.6
Several new therapies have emerged in the past decade, such as incretin-based therapies and SGLT-2 inhibitors, making the choice of suitable antidiabetic regimens challenging.7 This may partly explain the inertia in intensifying treatment for T2DM.8 Periodic guidance from national and international bodies, such as National Institute of Health and Care Excellence (NICE), American Diabetes Association (ADA) and European Association of Diabetics (EASD), in particular, have offered more objective advice to prescribers.9 ,10
Our aim was to investigate how the incidence and prevalence of T2DM diagnoses as well as prescribing patterns have changed between 2000 and 2013 using data from The Health Improvement Network (THIN) primary care database.
Methods
Data source
THIN is one of the largest databases to collect information on patient demographics, disease diagnosis, management and prescribing from UK primary care. THIN contains anonymised medical records from over 550 general practices throughout the UK, with around 12 million patients contributing data. It is reasonably representative of the UK population.11 ,12 Information is collected during routine patient consultations with GPs from when a patient registers at a THIN affiliated general practice. Symptoms and diagnosis of disease are recorded using the Read code, hierarchical coding system.13 ,14 THIN also provides information on referrals made to secondary care and anonymised free text information. A measure of social deprivation recorded as quintiles of Townsend scores is also provided.15
Study population and period
All data included in this study was from practices which met the acceptable mortality reporting (AMR) and acceptable computer usage (ACU) standards. These are measures of quality assurance for THIN data.16 ,17 The AMR date is the date after which the practice is confirmed to have a rate of mortality sufficiently similar to that expected for a practice with its demographic characteristics, based on data from the Office for National Statistics.16 The ACU date is the date after which the practice is confirmed to have on average at least one medical record, one additional health record and two prescriptions per patient per year.17 We included all individuals aged 0–99 years who were registered with a general practice contributing data between 2000 and 2013.
The recording of diabetes diagnoses and management in THIN is comprehensive and hence, there are several ways an individual may be identified as diabetic. We developed an algorithm to identify individuals with diabetes mellitus on whether they had at least two of the following records: (1) a diagnostic code for diabetes, (2) supporting evidence of diabetes, for example, screening for diabetic retinopathy or (3) treatment for diabetes. The first record of any of these three was considered as the date of diagnosis. As some Read codes are non-specific, we sought to distinguish patients with diabetes as type 2 based on age at diagnosis, types of treatment and timing of the diabetes diagnosis.18 For example, patients with diabetes aged ≥35 years at time of diagnosis, on non-insulin antidiabetic treatment or being managed without treatment were classified as type 2. Patients with diabetes diagnosed <35 years of age and on insulin were classified as type 1. A sample of 500 complete electronic healthcare records for individuals with diabetes were reviewed manually in THIN to assess if our clinical classification algorithm for diabetes type based on parameters above had identified diabetes type correctly. In all 500 cases, manual assignment of diabetes type based on clinical assessment of the entire record and algorithmic assignment led to equivalent classification.
Definition of main outcomes
Incidence of T2DM
The date at which the first recording of T2DM was made was classified as the index date for diagnosis. Therefore, our use of the term incidence with respect to T2DM in this study refers to the first record of T2DM to appear in a patient's electronic primary care record in the THIN database. We excluded those who had their first recording of T2DM made within the first 9 months of practice registration as these were more likely to be prevalent cases.19 We accounted for deaths and patients who had left the practices in our denominator (follow-up time).
Prevalence of T2DM
For our analysis on prevalence of T2DM, we included as our numerator all individuals who were first recorded as having T2DM within our study period and those recorded as having T2DM from previous years. The denominator included all individuals registered with a general practice between 2000 and 2013. We accounted for deaths and patients who had left the practices.
Prescription patterns analysis
The prevalence of use of different antidiabetic medicines for T2DM was also compared across the time period 2000–2013. We grouped antidiabetic medications by therapeutic class into nine categories: metformin, sulfonylureas, insulins, thiazolidinediones, gliptins, GLP-1 analogues, SGLT-2 inhibitors, meglitinides and acarbose. Prevalence of prescribed medications was calculated by dividing the total number of individuals issued a prescription for a particular antidiabetic medication class by the total number of individuals issued any antidiabetic medication in that calendar year.
Patients with an incident recording of T2DM between 2000 and 2013 were analysed to examine how prescribing habits may have changed over time for newly diagnosed T2DM specifically. We determined what antidiabetic drug was prescribed for initiating treatment in T2DM, and then examined what antidiabetic agents were typically added on by prescribers at a later stage (when the disease had progressed further).
Statistical analyses
The overall crude incidence of T2DM was estimated per 1000 person years at risk (PYAR). This was determined by totalling the number of patients with a first recording of T2DM between 2000 and 2013, and then dividing this number by the total person years of follow-up for all patient records for this period. We also determined crude incidence rates by age, gender, social deprivation (Townsend Score), and calendar year by restricting the person years of follow-up to the respective category in question. Person time was measured from the latest of: the date of general practice registration plus 9 months or 1 January 2000 to the earliest of: date of first recording of T2DM, date of death, date patient left the practice, last date of data collection from that practice or 31 December 2013. Multivariable Poisson regression analysis with (log) person time as an offset was used to analyse changes in incidence by age, gender, social deprivation and calendar year while controlling for the other respective variables.
The overall crude prevalence of T2DM was calculated by dividing the total number of patients with T2DM by the total number of GP-registered patients between 2000 and 2013 accounting for deaths and patients who had left the practices. Crude prevalence by age, gender, social deprivation and calendar year was also determined. Multivariable Poisson regression analysis was used to analyse changes in prevalence of T2DM and also the effect of age, gender, social deprivation and calendar year while controlling for the other respective variables.
To investigate the impact of clustering by practice, multilevel random intercept models were compared to all our standard Poisson models. Likelihood ratio tests were used to explore the significance of interaction between variables.
Prescription records were also analysed to describe changes over time in prescribing habits in primary care. The percentage of patients with T2DM prescribed different antidiabetic therapies for ever-use (prevalence), first-line use and as add-on therapy was determined for each calendar year and the CIs were calculated.
Stata (Version 13.1) was used to conduct all analyses.
Ethics
THIN has been used for scientific research since approval from the NHS South-East Multi-Centre Research Ethics Committee in 2003. Scientific approval to undertake this study was obtained from CMD Medical Research’s Scientific Review Committee in February 2015. (SRC Reference Number: 15-011).
Results
In total, 406 344 individuals with T2DM were identified and among these, 203 639 were newly diagnosed between 2000 and 2013.
Incidence of T2DM
The incidence of T2DM increased from 3.69 per 1000 PYAR (95% CI 3.58 to 3.81) in 2000 to 3.99 per 1000 PYAR (95% CI 3.90 to 4.08) in 2013 for men; and from 3.06 per 1000 PYAR (95% CI 2.95 to 3.17) to 3.73 per 1000 PYAR (95% CI 3.65 to 3.82) in 2013 for women (table 1 and online supplementary appendix 1). Incidence peaked in 2004 for both men and women: 4.80 per 1000 PYAR (95% CI 4.70 to 4.90) and 4.28 per 1000 PYAR (95% CI 4.19 to 4.38), respectively. There was a significant interaction between age and gender (p<0.001); hence, all results are presented separately for men and women in table 1. Women had a lower incidence of T2DM than men (incidence rate ratios (adjusted) 0.81 (95% CI 0.80 to 0.82) and individuals from the most socially deprived areas had a significantly higher incidence than individuals from the least deprived areas (Townsend Quintile 5 vs Townsend Quintile 1; (IRR 1.57 95% CI 1.54 to 1.60) for men and (IRR 1.92 95% CI 1.88 to 1.97) for women). In general, incidence of T2DM increased with age, peaking between 70 and 79 years. Between ages 10 and 40 years, the incidence of T2DM was higher among women. However, after the age of 40 years, the crude incident rate became higher among men though adjusted incidence rates were similar.
Incidence of type 2 diabetes mellitus by sociodemographic factors and year
Prevalence of T2DM
The prevalence of T2DM more than doubled from 2.39% (95% CI 2.37% to 2.41%) in 2000 to 5.32% (95% CI 5.30% to 5.34%) in 2013 (table 2 and online supplementary appendix 2). Prevalence was lower among women (IRR 0.77, 95% CI 0.77 to 0.77) and highest among individuals in the most deprived areas (Townsend quintile 5 vs Townsend quintile 1; (IRR 1.75, 95% CI 1.74 to 1.75)). The prevalence increased with age. The highest crude percentage of patients with T2DM was seen in the 60–69 years age band: 37.65% (95% CI 37.50% to 37.79%). However, the highest adjusted prevalence was seen among the 70–79 years age band (70–79 years age band vs 40–49 years age band (IRR 5.95, 95% CI 5.92 to 5.97)) (table 2).
Prevalence of type 2 diabetes mellitus by sociodemographic factors and year
Prescribing in T2DM
Prevalence of antidiabetic medicine prescribed in patients with T2DM
A total of 305 765 (75.2%) patients of 406 344 with T2DM were prescribed antidiabetic medication. The prescribing of metformin rose from 55.4% (95% CI 55.0% to 55.8%) in 2000 to 83.6% (95% CI 83.4% to 83.8%) in 2013, while the prescribing of sulfonylureas decreased from 64.8% (95% CI 64.3% to 65.2%) in 2000 to 41.4% (95% CI 41.1% to 41.7%) of treated patients with T2DM by 2013 (figure 1 and online supplementary appendix 3).
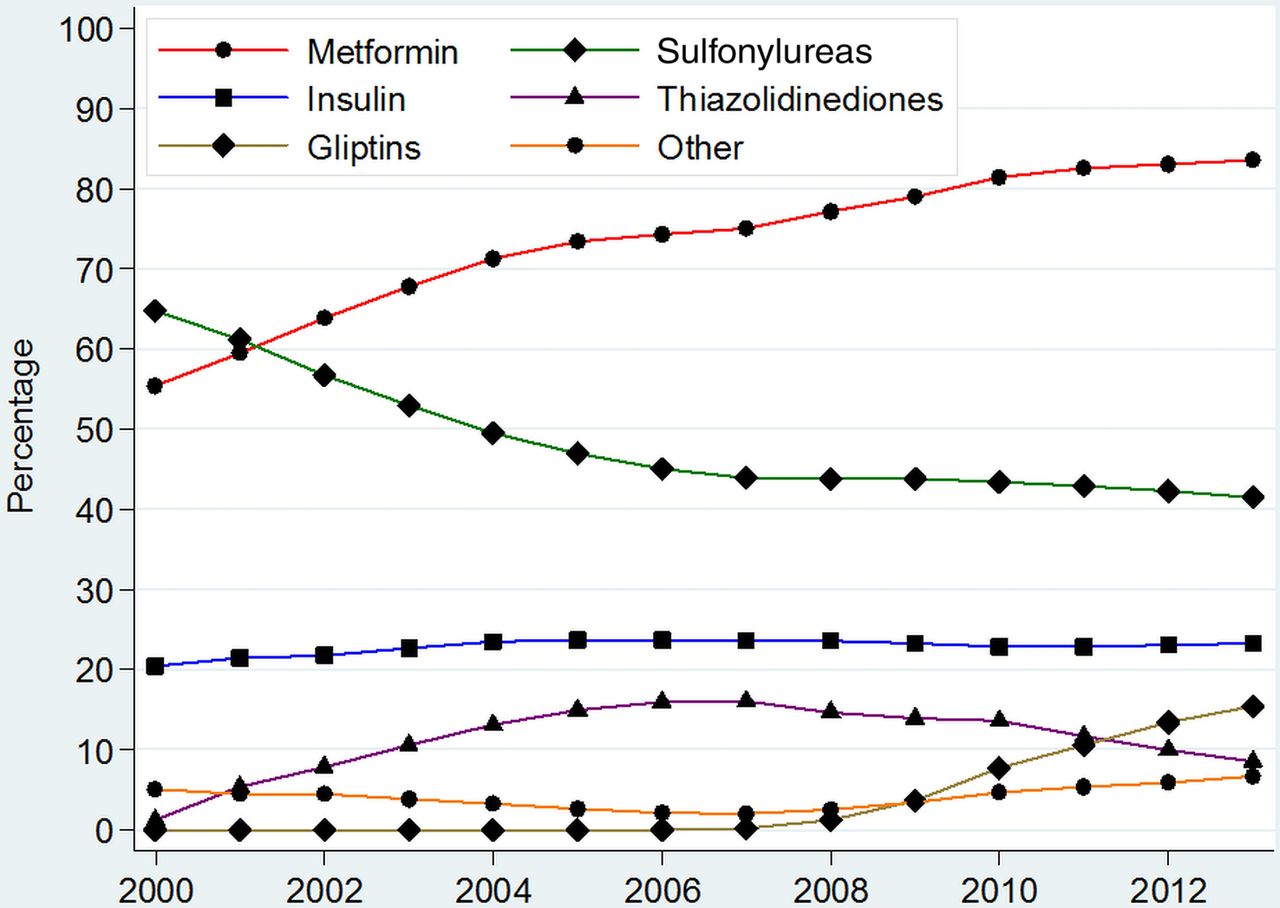
Prevalence of prescribing of different anti-diabetic medications among all patients with type 2 diabetes on treatment. *Other=Sum of prevalence of Acarbose, GLP-1 analogues, Meglitinides and SGLT-2 inhibitors. **For detailed values of point estimates and CIs, please consult online supplementary appendix 3.
Prescribing of thiazolidinediones peaked in 2007 at 16.0% (95% CI 15.8% to 16.3%), while that of gliptins peaked in 2013 at 15.4% (95% CI 15.2% to 15.7%) of all treated patients (figure 1). Prescribing of acarbose and meglitinides declined and were prescribed in <0.5% of patients with T2DM on antidiabetic medications by 2013. Prescribing of insulin, however, remained stable with 20–24% of treated patients being annually prescribed insulin between 2000 and 2013.
Medicines used to initiate treatment in newly diagnosed patients with T2DM
A total of 127 523 (62.6%) of 203 639 newly diagnosed patients with T2DM were initiated on treatment between 2000 and 2013. In 2000, 51.1% (95% CI 49.2% to 53.0%) were initiated on sulfonylureas and 45.1% (95% CI 43.2% to 47.1%) on metformin (figure 2 and online supplementary appendix 4). Use of metformin as first-line therapy increased annually and by 2013, 91.0% (95% CI 90.5% to 91.5%) of newly diagnosed T2DM patients requiring treatment were being initiated on this therapy. However, sulfonylureas usage as first-line therapy declined by 2013 to 6.3% (95% CI 5.9% to 6.8%). Few patients with newly diagnosed T2DM were prescribed insulin as first-line therapy in 2013 1.7% (95% CI 1.4% to 1.9%).

Prevalence of prescribing of different anti-diabetic medications used to initiate treatment in newly diagnosed patients with type 2 diabetes. *Other=Sum of prevalence of Insulins, Thiazolidinediones, Gliptins, Acarbose, GLP-1 analogues, Meglitinides and SGLT-2 inhibitors. **For detailed values of point estimates and CIs, please consult online supplementary appendix 4.
Use of thiazolidinediones as first-line therapy remained low and peaked in 2004 (1.1% (95% CI 0.9% to 1.3%)). Other antidiabetic therapies, such as gliptins, GLP-1 analogues, acarbose or meglitinides, were used very rarely as first-line treatments (<1%) in any calendar year.
Medicines prescribed as add-on agents after initiation with metformin in patients with newly diagnosed T2DM
Sulfonylureas were the most common add-on therapy used in newly diagnosed patients with T2DM already on metformin between 2000 and 2013; (figure 3 and online supplementary appendix 5). However, sulfonylurea use as an add-on declined from 75.9% (95% CI 72.6% to 79.3%) in 2000 to 61.7% (95% CI 59.2% to 64.2%) in 2013. The use of thiazolidinedione as add-on therapy to metformin peaked in 2002 at 26.9% (95% CI 25.0% to 28.8%), but the prescribing then declined to 1.9% (95% CI 1.2% to 2.7%) by 2013.

Prevalence of prescribing of different anti-diabetic medications as add-on therapy in patients with type 2 diabetes on metformin. *Other=Sum of prevalence of Insulins, Acarbose, GLP-1 analogues, Meglitinides and SGLT-2 inhibitors. **For detailed figures on point estimates and CIs, please consult online supplementary appendix 5.
Gliptins have become the second most common class of antidiabetic medication added to metformin therapy, with the use at 26.9% (95% CI 24.7% to 29.2%) in 2013. Other antidiabetic therapies were less commonly added on (figure 3).
Medicines prescribed as add-on agents after initiation with sulfonylureas in patients with newly diagnosed T2DM
Metformin was the most common treatment added on to newly diagnosed patients with T2DM on sulfonylureas between 2000 and 2013; (figure 4 and online supplementary appendix 6). In total, 89.8% (95% CI 87.7% to 92.0%) of patients diagnosed with T2DM in 2000 went on to have metformin add-on therapy after a sulfonylurea, while 79.9% (95% CI 74.8% to 85.0%) had metformin added on in 2013.

Prevalence of prescribing of different anti-diabetic medications as add-on therapy in patients with type 2 diabetes on sulfonylureas. *Other=Sum of prevalence of Acarbose, GLP-1 analogues, Meglitinides and SGLT-2 inhibitors. **For detailed figures on point estimates and CIs, please consult online supplementary appendix 6.
Insulins were the second most common add-on therapy to sulfonylureas, accounting for 13.4% (95% CI 9.1% to 17.7%) of patients in 2013 (figure 4). Thiazolidinediones and gliptins were the second and third most common add-on therapies, respectively. Prescribing of meglitinides remained <1% throughout, while GLP-1 analogues and acarbose were used in <0.3% of patients as add-on medication in any given year.
Discussion
The incidence of T2DM in UK primary care rose significantly between 2000 and 2005; thereafter, it stabilised around 3.99 per 1000 PYAR in men and 3.73 per 1000 PYAR in women by 2013. Prevalence more than doubled over the duration of the study to 5.3%. Men were 23% more likely to have T2DM and those who were most socially deprived were 75% more likely to have T2DM, as compared to those least deprived. Individuals aged 70–79 years had the highest adjusted prevalence of T2DM, which was nearly six times higher than the reference age band (40–49 years). Prescribing for T2DM also changed considerably over the study, with metformin rising to account for 91.0% of first-line therapy among newly diagnosed patients with T2DM and 79.9% of add-on therapy for patients on sulfonylureas by 2013. Use of gliptin therapy also increased and was used as an add-on medicine in 26.9% of metformin-treated patients; insulin rose to be used as an add-on treatment in 13.4% of patients after a sulfonylurea by 2013.
The incidence of T2DM observed in this study is comparable to data that has been published previously.20 ,21 Previous studies were restricted to the period prior to 2010; however, our study includes data up to 2013. The initial rise in diagnoses between 2000 and 2005, and the plateau thereafter may be explained by the lowering of plasma glucose threshold for diagnosis of diabetes in 2000.5 The increase in incidence observed in 2004 in this study could also relate to the introduction of incentivised payments in the UK as part of the quality and outcomes framework for better monitoring of patients with diabetes mellitus. Women were at greater risk of developing T2DM relative to men between the ages of 10 and 40 years, in keeping with other published work;21 after this age, rates increased more significantly in men. Individuals from the most socially deprived areas in our study were at greatest risk of developing the disease. This is of concern as a study in the US has shown a strong association between socioeconomic status and diabetes-related mortality.22
The rise in prevalence of T2DM described in this study was similar to that reported by Diabetes UK and the International Diabetes Federation in 2013.23–25 Prevalence rates of T2DM observed in this study in the UK are similar to what has been observed in other European countries, such as Denmark and Sweden, but lower than that observed in Germany and the US, particularly for the recent years.26 ,27
Similar studies on prescribing conducted with smaller cohorts in the US have shown medication choices to be quite different. For example, in a US cohort study of data between 2009 and 2013 (n=15 516), 57.8% of patients with T2DM initiated therapy with metformin, 23.0% with sulfonylurea, 13.1% with gliptins and 6.1% with thiazolidinediones,28 while the corresponding percentages in our study (n=57 518) for the same period 2009–2013 were 90.0%, 7.6%, 0.4% and 0.1%, respectively. This significant selection of metformin over other therapies in the UK suggests an adherence, particularly for treatment initiation, to cost-effective care as published via periodic updates by NICE. This reliance on metformin for first-line therapy has also been evident in other studies conducted in Germany and Denmark, in particular.29 ,30
Metformin use increased steadily from 2000 and was prescribed to 91% of newly diagnosed patients with T2DM requiring treatment in 2013. In 2000, metformin was recommended by NICE for first-line use in obese patients with T2DM only, while non-obese patients were still being recommended sulfonylureas and insulins.31 However, by 2005, metformin was the recommended first-line treatment choice by all bodies as it is well tolerated,9 ,10 does not induce weight gain or hypoglycaemia, and was the only diabetic treatment found to have a long-term benefit in reducing cardiovascular risks and organ damage.6 ,10
We found that the use of sulfonylureas as a first-line agent declined among newly diagnosed patients with T2DM, in keeping with published clinical guidance.9 ,10 This decline may also be explained by the availability of more treatment options, the risk of weight gain and hypoglycaemia attributed to this class of drugs; and because these were shown not to reduce long-term complications of diabetes.32 ,33 Nevertheless, 61.7% of patients with T2DM diagnosed in 2013 still had sulfonylureas added to their metformin treatment.
We observed a decline in thiazolidinedione prescribing after 2003 in response to an increasing awareness of adverse effects of these drugs, such as cardiotoxicity, highlighted in safety alerts for rosiglitazone by regulatory agencies in 2007.34 Additionally, risks of weight gain, fractures and bladder cancer still exist among currently licensed thiazolidinediones, which may explain their limited use despite evident efficacy.35
Since their emergence in 2006, gliptins have rarely been used as first-line therapy in newly diagnosed patients with T2DM. However, their usage as add-on therapy has risen rapidly, perhaps, as they do not induce weight gain or hypoglycaemia.36 Further increase in gliptin use may depend on data emerging on their long-term benefits for microvascular and macrovascular complications.37
GLP-1 analogues were the first antidiabetic treatments to become available that could induce weight loss; however, we have shown that their prescribing in UK primary care particularly as add-on therapy after metformin remains low (1.1%). This is in considerable contrast to prescribing in Denmark where a study examining data for a similar period (2000–2012) provided evidence that nearly 7% of patients with T2DM on metformin had GLP-1 therapy added on.29 Lower use in the UK may be explained by the publication of the NICE appraisal of the GLP-1 analogue, liraglutide, in 2010 that recommended use of these drugs only in those patients who were already on two other therapies, had high BMIs or were contraindicated to at least three other antidiabetic medications.38
A small percentage of newly diagnosed patients with T2DM (1.7%) are still being initiated on insulin and a growing number are having insulin prescribed as add-on therapy. Though current guidance does not support early introduction of insulin, some studies have demonstrated a benefit.39
Meglitinides were used in less than 2% of patients annually, between 2000 and 2013. These drugs require multiple daily dosing, carry a risk of inducing hypoglycaemias, and are more costly than sulfonylureas.9 Use of acarbose has also continued to fall, perhaps as NICE restrict their recommendation to use in patients who cannot tolerate other oral agents.40 SGLT-2 inhibitors have been the latest class of antidiabetic therapy to emerge; hence, overall prescribing was low (0.5% in 2013). These have been recommended by NICE as add-on treatment, and can aid with weight loss and blood pressure control. They do, however, carry an increased risk of genitourinary tract infections and long-term benefits are unknown.41 ,42
Strengths and limitations of this study
This is the first study, to the best of our knowledge, to detail changes in recording of diagnoses as well as prescribing for T2DM using UK primary care data between 2000 and 2013. We have also provided insight into factors that may have driven these changes. Furthermore, THIN has been shown to be broadly representative of the UK population and a particularly suitable database for drug utilisation work.11 There are, however, certain limitations to highlight. Though our algorithm for identification of patients with T2DM utilised several variables in addition to diagnostic codes, such as treatment and time of diagnosis, there still remains a risk of some misclassification of T2DM. Also, this study did not measure prescribing of antidiabetic medicines in secondary care. However, it is well established that the majority of prescribing for T2DM is in primary care.43 We also did not examine prescribing patterns in important clinical subgroups, such as patients with chronic kidney disease, which should be addressed in future work. Prescribing of a medication does not, of course, equate to adherence to therapy. However, the purpose of this study was to examine recording of diagnosis and physician prescribing choices only. Variation in dosages or between drugs within the same therapeutic class were not considered. Some of this has been explored previously.8
Conclusion
There has been a significant increase in the number of incident and prevalent cases of T2DM between 2000 and 2013. Though the incidence of T2DM has somewhat plateaued since 2005, the prevalence has continued to rise suggesting that patients with T2DM are being diagnosed younger and live longer. Being male, older, and from a more socially deprived area were factors all strongly associated with having T2DM.
Prescribing patterns reflected clinical guidance from NICE, in particular. Metformin emerged as the most widely prescribed agent though sulfonylureas, despite their limitations, remained the second most common therapy prescribed. Latest international guidelines, which may be reflected in future NICE updates, encourage greater use of the broader armamentarium now available for T2DM. We may, therefore, begin to see more varied, patient-specific prescribing. With these and further developments in practice anticipated, it will be important to review in the next few years how prescribing patterns in primary care for T2DM have further changed.
References
Supplementary materials
Supplementary Data
This web only file has been produced by the BMJ Publishing Group from an electronic file supplied by the author(s) and has not been edited for content.
- Data supplement 1 - Online supplement
Footnotes
Twitter Follow Manuj Sharma at @manujsharma10
Contributors MS, IN and IP were all involved in the conception and design of the study. MS performed the analysis, while IN and IP helped with the interpretation. MS prepared the manuscript, and IN and IP helped revise it as needed. All authors have read and approved the final manuscript.
Funding This work has been supported by a grant from Novo Nordisk A/S. The views expressed are those of the authors and do not necessarily represent those of Novo Nordisk A/S.
Competing interests IP, IN and MS report grants from Novo Nordisk A/S during the conduct of this study. They have nothing else to disclose.
Provenance and peer review Not commissioned; externally peer reviewed.
Data sharing statement No additional data are available.