Article Text

Abstract
STUDY OBJECTIVE Relative risks are frequently used to convey how strongly outcomes like mental illness and suicidal behaviour are associated with personal characteristics like ethnic background. This study examined whether RRs for deliberate self harm (DSH) in ethnic groups vary between small areas according to their ethnic mix.
DESIGN Small area study of DSH rates in ethnic groups, by local ethnic density, using negative binomial regression.
SETTING 73 south London electoral wards, 1994–1997.
SUBJECTS 1643 people attending casualty after DSH.
MAIN RESULTS African-Caribbean and Asian DSH rates, relative to the white population, varied between wards. A linear model indicated a decline by factors (relative rate ratios) 0.76 (95% confidence intervals (CI) 0.64 to 0.90) and 0.59 (95% CI 0.36 to 0.97) respectively per SD increase in the local size of these minority populations. However, for both groups, an inverted U shaped curve provided a better fit for the link between the relative DSH rate in these groups and their local population density.
CONCLUSIONS The DSH rate of minority groups relative to the white group is low (suggesting protection) in some areas, and high (suggesting risk) elsewhere. This has implications for management of suicidal behaviour in ethnic groups but also for interpretation, and policy implementation, of research on risk for suicidal behaviour, and, probably, many other outcomes. Relative risks or rates are not stable indicators of association in psychiatric epidemiology.
- deliberate self harm
- ethnic density
Statistics from Altmetric.com
Much research in psychiatric epidemiology and suicidology looks for variables that indicate risk.1 Thus, lists of relative risks (RRs) are frequently published for use by clinicians, policy makers and researchers.2 3 One factor of interest is ethnicity. Compared with white groups, rates of suicidal behaviour are reportedly high among UK Indian women4 and low among African-Caribbean people in the UK4 and the US.5
The use of ethnicity as risk or protective factor confounds group membership with minority status. Low acceptance of suicide may reduce its risk among African-Americans6 but the strain of being a minority may, in contrast, increase it.7 Thus, risk of outcomes such as suicidal behaviour in ethnic minority individuals may depend on the degree to which, locally, they are a minority or not. Such phenomena, formally examples of ecological effect modification,8 are also known, in sociology, as density9 or status integration10 effects. The latter refer to the possibility that mutually incompatible role statuses, such as membership of a given ethnic group, and, simultaneously, an address in area where this group is a minority, create role strain and thus increased risk of outcomes like suicidal behaviour. The density hypothesis9 predicts a negative association between the risk of ethnic minority individuals and the size of their group—its density—locally. These sociological versions of ecological effect modification imply that the effects of exposure to risk factors like ethnicity decline steadily with increasing prevalence of that factor. However, evidence to support this is scant and often contradictory, not only as regards suicidal behaviour11 12 but also other mental health outcomes.9 13
The link between ethnicity and suicidal behaviour has been examined mainly in large regions or even countries4 5 14-16 and it is unclear whether the findings also apply at the finer geographical level. This study examined whether ethnic deliberate self harm (DSH) rates, in London, decline, from highest in areas with low, to lowest in areas with high ethnic densities.
Methods
STUDY AREA
The study area consisted of the electoral wards of the Inner London boroughs Lambeth (n=22), Southwark (n=25) and Lewisham (n=26) (total 1991 census population 690 934 of whom 18.7% (range 3.9% to 46.4%) are African or Afro-Caribbean and 5.1% (range 1.7% to 14.9%) Asian). Ward populations averaged 9465 (range 5591 to 14 169).17 Proportions of ward populations represented by any minority (minority density), Africans and African-Caribbeans (African-Caribbean density) and Asians (Asian density) were computed. Local Jarman underprivileged area scores18 were recalculated using all variables (unemployment rates, overcrowding, proportion of unskilled workers, pensioners living alone, single parents with children younger than 16 years, and migrants) excluding the ethnicity variable contained in this score so that minority/ethnic densities could be analysed separately from deprivation.
PERSONS AND ATTENDANCES
King's College Hospital (KCH) has the main accident and emergency department (A&E) (83 000 attendances annually) in Lambeth and Southwark (area 1). Lewisham Hospital (LH) A&E (55 000 attendances annually) lies centrally in Lewisham (area 2). Patients attending after DSH (excluding accidental and uncertain cases but including DSH other than by overdose) were assigned to an ethnic group specified in the 1991 census17 (White, Black Caribbean, Black African, Black Other, Indian, Pakistani, Bangladeshi, Chinese, Other Asian). However, given uncertainty about the status of the Black Other group,19 and small numbers in some Asian categories, groups were aggregated into White, African-Caribbean and Asian. Registration, in the period 1994–1997, covered 560 consecutive days in KCH and 1116 in LH. Repeat episodes were counted once only. Persons were linked to wards (using postcodes) so that they could be related to local ethnic, gender and age (<25, 25–54, >54) specific person years at risk.
STATISTICAL ANALYSIS
The main analyses used only those who attended their own A&E. Thus, Lewisham ward populations were at risk for DSH related attendance at LH, and those of Southwark and Lambeth wards for attendance at KCH. As the geography of DSH person occurrences was not Poisson distributed (likelihood ratio test versus Poisson χ2(1)=535.9, p<0.001), negative binomial regression was used, which allows for overdispersion (clustering) at the level of units of analysis.20 Ecological variables (deprivation and densities) were standardised to the total set of 73 wards so that RRs represent change associated with one standard deviation's shift on the independent variables.
Firstly, crude associations were examined of the DSH rates of wards with deprivation and minority/ethnic density indices. Subsequently, full models were specified for the link between the respective density indices and DSH, adjusting for wards' deprivation levels and attenders' ethnicity, gender, age and catchment area. Interaction terms between the density index and the other covariates were included in case of probability levels of 0.050 or less. To allow for other than straight linear associations between minority/ethnic DSH rates and minority/ethnic population densities, we finally examined, using LR tests, whether inclusion, in the fully adjusted models, of squared and cubed density terms, improved their fit.
The sensitivity of the main results to bias because of missing data on attenders' ethnic group, or unbalanced migration between areas 1 and 2, was examined by repeating analyses under the assumption that those with unknown ethnicity had all been White or non-White respectively, and including those who presented out of catchment area, assuming both A&Es to serve the entire study area.
Results
key points
-
There is concern about high rates of suicidal behaviour in some ethnic groups such as young Asian women while African-Caribbeans have been reported to have low rates.
-
Examination of DSH rates in ethnic groups at the level of local neighbourhoods indicates that membership of a given group may be associated with increased risk in one and with decreased risk in another area.
-
The degree to which membership of a given ethnic group implies minority status locally, modifies associations of ethnicity with outcomes such as suicidal behaviour.
-
This may also apply to other risk factors such as unemployment or deprivation, and outcomes, such as mental illness or completed suicide so that it is important to disentangle the effects of risk factor exposure, from the degree to which this exposure is a minority experience or not.
CRUDE NUMBERS.
At KCH 1341, and at LH 1011 persons attended for DSH. Of these 2352 consecutive attenders, 244 had no address recorded and 38 lacked information on ethnicity and address. Of the 2070 with recorded address, 178 lived outside the study area. Of the remaining 1892, 188 had ethnicity unrecorded, leaving 1704 subjects. Overall 97% of study area residents presented at their own A&E. This did not differ between ethnic groups. Given the randomness of inter area migration with respect to ethnicity, the main analysis used those only whose ethnicity was recorded and who presented at their own A&E (n=1643) (table1).
Consecutive persons attending for DSH at two Inner London hospitals
ECOLOGICAL ASSOCIATIONS
Crude DSH attendance rates were lower in wards with higher deprivation levels (RR per SD deprivation 0.84 (0.78 to 0.91); p<0.001). This association did not differ between areas (LRI χ2 (1)=0.3; p=0.600), age groups (LRI χ2(2)= 1.2; p=0.550), genders (LRI χ2 (1)=0.5; p=0.542) and ethnic groups (LRI χ2 (2)=4.0; p=0.138). After adjustment for these variables the RR was 0.87 (0.80 to 0.95); p<0.001.
Crude DSH rates were lower in wards with relatively more Asian residents. There were no crude associations between wards' DSH rates and their minority and African-Caribbean populations densities respectively.
DENSITY EFFECTS
Linear associations of DSH attendance rates with minority, African-Caribbean and Asian population densities respectively were adjusted for confounding and effect modification by deprivation, area, and attenders' gender, age and ethnicity. Rates were higher in area 1 than area 2, but, given this difference, patterns were similar in both areas. Links of local minority and ethnic densities with DSH rates differed between White and non-White groups, the regular pattern being that, as local minority and ethnic population sizes increased, White rates rose more or declined less than of members of those respective minority or ethnic groups. However, the fit of these fully adjusted linear models improved significantly by inclusion of squared and cubed density indices, suggesting curvilinear, rather than straight linear relations between ethnic/minority density and the (relative) risk of DSH in the respective groups (table 2).
Ethnic/minority density and DSH person rates; relative rates (95% CIs, p values) per SD shift on density indices, crude and adjusted for deprivation, age, sex, area and ethnic group
As the same exposure (local minority or ethnic density) held different associations with minority and White DSH, it follows that a given ethnicity may appear a risk factor in one and a protective factor in another context. Figures 1 to 3 plot DSH rates in specific groups relative to Whites using the ratio of relative rates. The linear model yields a steady decline of DSH rates in given ethnic groups relative to the White group with increasing ethnic density, while the better fitting curvilinear model yields an inverted U shaped curve with maximum relative rates in wards with minority/ethnic densities around a standard deviation below the study area mean.

DSH rates in non-Whites relative to Whites by local minority density.
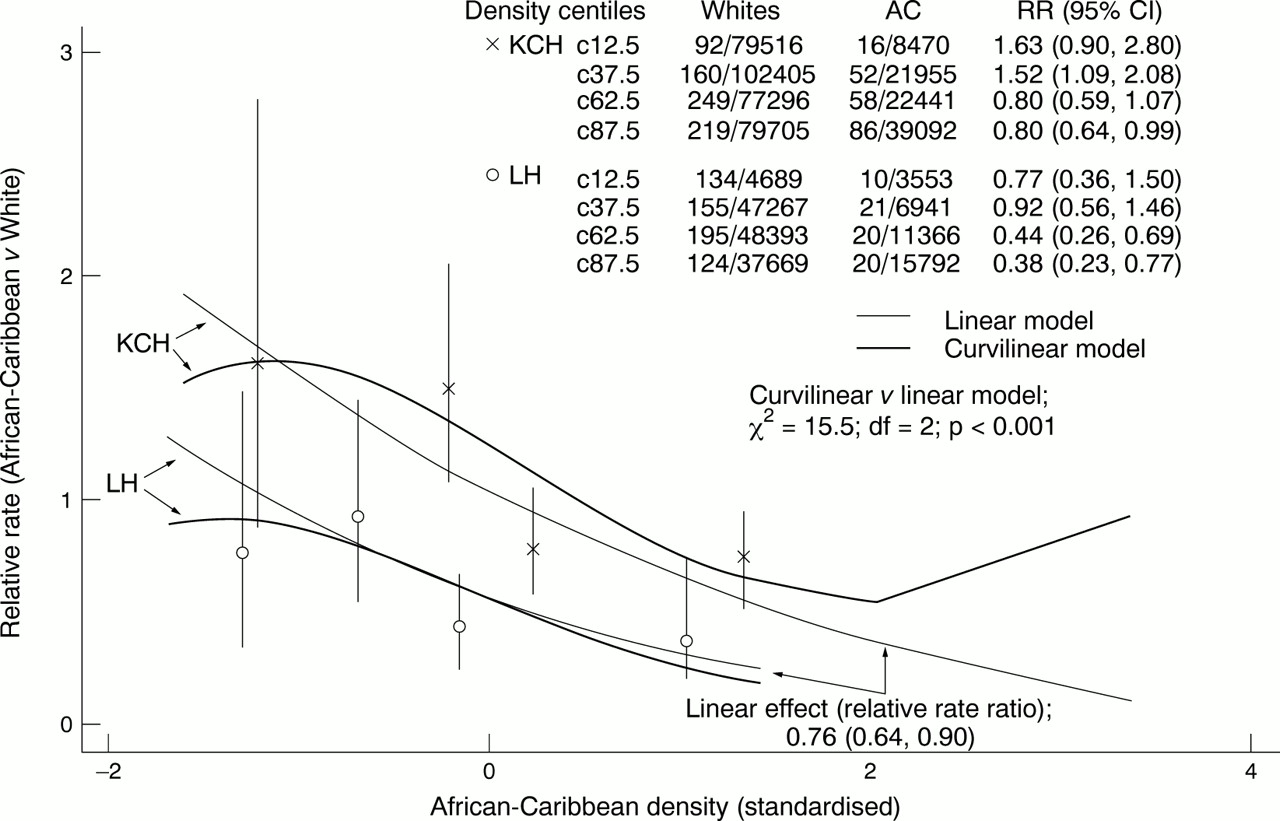
DSH rates in African-Caribbeans (AC) relative to Whites by local AC density.

DSH rates in Asians relative to Whites by local Asian density.
SENSITIVITY OF RESULTS TO MISSING DATA AND INTERCATCHMENT AREA MIGRATION
Similar proportions of the White (207 of 1717=12%), African-Caribbean (35 of 353= 10%), Asian (2 of 42=5%) and undetermined ethnic groups (38 of 240=16%) lacked information on address (including the undetermined group χ2 (3)=6.9; p=0.080. Excluding undetermined group χ2 (2)=3.2; p=0.197).
Analyses, rerun under the assumption that those who had been excluded because of unrecorded ethnicity (n=188) had all been White or non-White respectively, did not change results, RRRs being comparable, in size and significance to those given in figs 1-3. The same applied when data were reanalysed including those who attended the other A&E (n=61) (results of sensitivity analyses available from JN).
Discussion
Risk factor research is fraught with contradictory findings.1 In case of ethnicity this is often attributed to imprecise classification of ethnic group.21 This study of associations between DSH and ethnicity, identifies a more general explanation for the confusion. A given ethnicity implies membership of a group and, separately, a degree of minority status dependent on that group's local size (density). When these are considered separately, ethnic DSH rates, relative to White groups, range from values larger than 1—indicating risk—, to smaller than 1—suggesting protection. The manner in which ethnic density at the small area level modifies the link between ethnicity ands DSH risk is only partly compatible with the density9 and status integration10 hypotheses; as reported elsewhere in connection with divorce as suicide risk factor,11 risk does not decline steadily as the risk factor's prevalence increases, but rather curvilinearly.
Absolute DSH rates were not calculated as a sizable proportion of DSH in the community escapes medical attention.22 The study's focus was on comparing relative rates. The diverging pattern of associations between ethnic/minority densities and DSH rates of White and non-White groups suggests that ethnic individuals' local minority status modifies their DSH risk. However, the results could also have arisen if rates of help seeking following DSH were lower in larger ethnic groups, for instance because of better developed lay referral systems in them.23 24 Such help seeking bias is unlikely to fully explain the results, particularly as the density effect not only applies to minority groups but to White groups also. Moreover, the results fit a previous study, conducted in the same area, documenting density effects on risk of completed suicide, an outcome that surfaces irrespective of helpseeking.12 Some other circumstances support the validity of the findings. The focus was on calculations of RRs within, and their comparison between ethnic groups. Missing data and inter area migration were random with respect to the variables of interest. Findings applied in both areas despite independent data collection. More importantly, the calculation of ethnic specific relative rates and ratios of relative rates between ethnic groups, cancels out error factors because of missing data, unbalanced migration and ethnic differences in help seeking.
In small area analyses, individual instances of the outcome frequently concentrate in adjoining neighbourhoods.25 Negative binomial regression adjusts for this phenomenon to which two factors may have contributed. Firstly, DSH clusters not only because of high prevalence of risk factors in communities but also because of imitation.26 Moreover, attempters living near the casualties may have been more likely to present than those living elsewhere so that clustering may have arisen centrally in the areas.
Electoral wards, the base for indexing ethnic density, varied in size from around 5000 to 15 000 residents. Especially in larger wards, the ethnic mix may have varied between neighbourhoods. Analyses at a finer level, such as that of enumeration districts, would have reduced this heterogeneity but were not feasible as deprivation and census data by ethnic group, age and gender, are unavailable at levels lower than that of wards. However, the fact that density effects were apparent despite residual ethnic heterogeneity within wards, emphasises this phenomenon's robustness.
Attenders were asked to describe their own ethnic group following census procedure.17 The extent of missing data illustrates the difficulties of this in busy inner city A&E departments. The decision to analyse White, African-Caribbean and Asian groups will attract criticism given the large heterogeneity within these groups and the practical difficulties of taking mixed ethnic origin into account. However, our aim was not to obtain ethnic DSH rates but to examine density effects, which are based more on the notion of (dis)similarity than exact matching of ethnic descriptors.
Factors other than ethnicity and suicidal behaviour have been examined in the literature, supporting the notion that one's fit with one's social environment modifies one's risk of adverse outcomes. Associations of religious belief with depression27 or suicide acceptance28 depend on the local dominance of religion. Suicide risk associated with alcohol use is lower when overall consumption is high.29 DSH rates in the unemployed are lower when unemployment is common.30 Relative deprivation, which sets one apart from one's neighbours, may contribute more to suicide risk than absolute poverty levels.31 This may explain our failure to find positive associations between deprivation and DSH rates, in contrast with previous reports.32 The study area is one of the most deprived in the UK. When a risk factor becomes more prevalent it explains fewer individual cases,33 because, in such situations, personal exposure, for instance to deprivation, is less likely to be aggravated by marginalisation or stigmatisation. This possibility, another example of a density effect, is suggested by the data but could not be confirmed, as information on personal deprivation was unavailable.
The density/status integration hypotheses predict a steady decline of risk as the risk factor in question becomes more prevalent and thus less associated with role strain. The inverted U shaped curves found in this study suggest a more complicated process. Not only social causation—increased strain associated with minority status—but also social selection may have contributed to the effect described. For instance, migration of ethnic minority people into more affluent, predominantly White, may indicate increased resilience; this may outbalance the effects of being isolated from one's own ethnic group in the lowest ethnic density wards. Longitudinal, individual level studies are needed to disentangle how opposing processes such as these contribute to variation of ethnic DSH risk according to the demography of small neighbourhoods.
The RR is widely used as a measure of aetiological force. The expectation that it should be stable across populations34has caused neglect of the phenomenon described here. At most, density effects tend to be considered as nuisance factors in ecological studies.8 Our study suggests that the extent to which exposure to either risk or protective factors is a minority experience, strongly modifies RRs. These therefore cannot be interpreted without knowledge of the exposure's prevalence in original study areas. Health policy decisions based on assumptions of invariant relative risks across large regions, may be misinformed.
Acknowledgments
We thank staff at the casualty departments for their kind cooperation.
References
Footnotes
-
Funding: this study was funded by the UK Medical Research Council.
-
Conflicts of interest: none.