Article Text

Abstract
Aim: To determine the age, sex, and cause specific prevalences of blindness and visual impairment in adults 30 years of age and older in Bangladesh.
Methods: A nationally representative sample of 12 782 adults 30 years of age and older was selected based on multistage, cluster random sampling with probability proportional to size procedures. The breakdown of the cluster sites was proportional to the rural/urban distribution of the national population. The examination protocol consisted of an interview, visual acuity (VA) testing, autorefraction, and optic disc examination on all subjects. Corrected VA retesting, cataract grading, and a dilated fundal examination were performed on all visually impaired subjects. The definitions of blindness (<3/60) and low vision (<6/12 to ≥3/60) were based on the presenting visual acuity in the better eye. The World Health Organization/Prevention of Blindness proforma and its classification system for identifying the main cause of low vision and blindness for each examined subject was used.
Results: In total, 11 624 eligible subjects were examined (90.9% response rate) across the 154 cluster sites. A total of 162 people were bilaterally blind (1.53% age standardised prevalence) while a further 1608 subjects (13.8%) had low vision (<6/12 VA) binocularly. Visual acuity was >6/12 in the “better eye” in the remaining 9854 subjects (84.8%); however, 748 of these people had low vision in the fellow eye. The main causes of low vision were cataract (74.2%), refractive error (18.7%), and macular degeneration (1.9%). Cataract was the predominant cause (79.6%) of bilateral blindness followed by uncorrected aphakia (6.2%) and macular degeneration (3.1%).
Conclusions: There are an estimated 650 000 blind adults (95% CI 552 175 to 740 736) aged 30 and over in Bangladesh, the large majority of whom are suffering from operable cataract. This survey indicates the need for the development and implementation of a national plan for the delivery of effective eye care services, aimed principally at resolving the large cataract backlog and the inordinate burden of refractive error.
- blindness
- visual impairment
- prevalence survey
- Bangladesh
Statistics from Altmetric.com
A ccording to the World Health Organization worldwide there are an estimated 45 million people that are blind with an additional 135 million individuals visually impaired.1 Globally it is known that cataract is the leading cause of blindness, with some 16–20 million people suffering from blinding cataract.2,3 In country specific terms, India is the country with the highest number of blind people (over 9 million) with the most prevalent cause of blindness and low vision being unoperated cataract, as indicated by several population based studies over the past two decades.4–7
In the neighbouring region, blindness prevalence surveys have been conducted in Nepal nationally and in one region of Pakistan that yielded all age blindness prevalence rates of 0.8% and 1.0% respectively.8,9 A subsequent survey in two administrative regions of Nepal identified a blindness prevalence of 3.0% in people 45 years and older.10
Before this present study, no nationwide study had been conducted in Bangladesh—a country of over 130 million inhabitants—concerning the extent of blindness or the main causes of vision impairment.11 This lack of vital information is particularly serious, given the strategies identified in the WHO Global Initiative for the Elimination of Avoidable Blindness by 2020 (Vision 2020).1 The absence of reliable population based epidemiological data on blindness and low vision in Bangladesh is a serious impediment to the effective national planning of eye care programmes.
In order to redress the lack of blindness and low vision data among adults for this populous country, a nationwide survey was designed. The purpose of this study was to estimate the age and sex specific prevalence rates of blindness and visual impairment in adults 30 years of age and older in Bangladesh and to identify the cause specific prevalence in the sample.
METHODS
The methodology implemented in this survey has been described in full in a separate publication, which also outlines the training period, the eye examination protocol and results from the rural pilot study.12 A summary of the key methodological details is provided below.
Sampling design
Official estimates for the year 2000 indicated that Bangladesh had a total population of 130 million people.11,13 Accordingly, there were an estimated 44.8 million people within the target age group of age 30 years or older (34.5% of the total population).11 Demographic data indicate that the majority of the population resides in rural areas (79.9%) while the remaining fifth lives in urban zones (20.1%).14
Multistage stratified cluster random sampling, with probability proportional to size (PPS) procedures, was adopted as the strategy for the selection of a cross sectional, nationally representative sample of the population.15,16 For the purposes of this survey, a rural cluster consisted of a village while an urban cluster comprised a street block. Stratification of the sample according to rural and urban residence—corresponding to official municipality ordinance status—was incorporated in the sample selection process.14 Proportional allocation of the cluster sites for each of the six major administrative divisions in Bangladesh was taken into account based on the estimated numbers of people 30 years of age and older living in each division. The relative numbers of rural and urban clusters per division were proportional to census data regarding residence of inhabitants in each of the six divisions.
A total of 154 cluster sample sites were selected by PPS, of which 104 were rural villages while the remaining 50 were urban block areas. For logistical purposes, for example, working within a time frame for completing the survey between monsoon seasons, the rural clusters consisted of 100 subjects, while the urban study areas consisted of 50 subjects each (see Fig 1).

Map of Bangladesh showing sample sites.
Before the examination of subjects, enumeration of eligible subjects in each cluster site was undertaken—that is 100 adults for each rural site and 50 for each urban cluster. Proceeding systematically from an identified reference point within the cluster—for example, a mosque or school, the names and ages of all habitual occupants of the households were listed until the requisite number of subjects of the target age group had been enumerated for each given cluster.16 All eligible subjects were informed that they would be asked to attend for an examination in their community in the near future.
Identification of the specific street blocks for subject enumeration within the 16 urban clusters of Dhaka City was based on comprehensive, digitised geographic information system (GIS) maps. According to these maps the Dhaka metropolitan area (population of approximately 10 million people) is divided into 90 administrative wards, providing details of all streets in the ward, including the slum areas of the city.17 Taking into account the urban wards that were selected via the PPS sampling strategy, each street block was assigned a number, one of which was then randomly chosen for enumeration purposes.
Three teams performed the survey. Each team included an ophthalmologist, a senior ophthalmic nurse, two technicians, two enumerators, two post-enumeration logisticians, an interviewer, and a driver.
Ethical approval
The Bangladesh Medical Research Council (BMRC) provided written ethical approval for this survey. Additionally, oral informed consent was sought from each subject, following explanation of the procedures to be conducted, before examining the subject.
Clinical examinations
Detailed descriptions of the clinical examination carried out in the survey are provided in the published article referred to previously.12 The essential components of the examination protocol for all subjects were presenting visual acuity using a logMAR tumbling E chart18 for each eye separately with the subject’s current distance refractive correction, if any worn; automated refraction on all subjects (Topcon Corporation Model RM-8000B, Tokyo, Japan); cup:disc ratio assessment and an undilated fundal examination with direct ophthalmoscopy on those subjects with ≥6/12 visual acuity in both eyes (see Fig 2).

Examination protocol.
In those people with <6/12 vision in either (or both) eyes, an additional set of examinations was conducted. These included retesting of visual acuity with the autorefraction result placed in a frame using trial lenses followed by cataract grading according to the Mehra-Minassian central lens opacity grading system.19
This cataract classification system consists of six categories based on obscuration of the red reflex of an undilated normal pupil as a result of the presence of a lens opacity, as assessed using direct ophthalmoscopy. The grading ranges are: 0, clear red reflex/no opacity; 1, few small dot opacities which occupy <1 mm2 maximum area; 2A, lens opacity obscuring red reflex with the area obscured smaller than area of clear reflex; 2B, area obscured is equal or greater than area of clear red reflex; 3, lens opacity totally obscuring the red reflex; 4, (pseudo-) aphakia or displaced lens; 5, unable to assess red reflex owing to corneal opacity, for instance.
Additionally, all patients with a visual acuity of <6/12 in either eye were dilated after testing for relative afferent pupil defect and these people then received a complete funduscopic examination. Specific conditions such as age related macular degeneration and diabetic retinopathy were graded according to standardised classification systems, as described elsewhere. Intraocular pressure (IOP) was measured by Schiotz tonometry (Biro Gerhard, Hausen, Germany) if either of the following two conditions were met:
-
IOP was measured in those subjects with a CDR of ≥0.7 at the time of the undilated optic disc examination that was carried out on all subjects.
-
In the subjects with a visual acuity <6/12 in either or both eye(s), IOP was measured in those individuals whose optic disc could not be visualised despite pupil dilatation.
Operational definitions
The WHO categories of visual impairment20 were used for this study. Blindness was defined as a presenting visual acuity of less than 3/60 (20/400, 0.05) in the better eye. Low vision was defined as presenting visual acuity of less than 6/18 (20/60, 0.3) but equal to or better than 3/60 in the better eye (comprising visual acuity criteria for categories 1 and 2 in ICD-10). Category 1 is visual impairment, less than 6/18 to 6/60, and category 2 severe visual impairment, less than 6/60 to 3/60. Subjects with presenting visual acuity worse than 6/12 in either eye were targeted for further examination. However, visual fields were not tested because of logistical and technical difficulties involved in conducting examinations in a primarily rural population. Therefore, field constriction was not considered in the definition of blindness, or in the identification of glaucoma as a cause of visual impairment.
Myopia was defined as a spherical equivalent refractive error of less than −0.50 dioptres. Myopia was further categorised as low myopia (≤−0.50 dioptres to >−5.00 dioptres), high myopia (≤−5.00 dioptres to >−10 dioptres), and extreme myopia (≤−10 dioptres). Hypermetropia was defined as a spherical equivalent refractive error of more than ≥+0.50 dioptres. Hypermetropia was further categorised as low hypermetropia (≥+0.50 dioptres to <+5.00 dioptres), high hypermetropia (≥+5.00 dioptres to <+10 dioptres), and extreme hypermetropia (≥+10 dioptres).
From a population based distribution of intraocular pressure (IOP) measured with the Schiotz tonometer on a randomly selected subsample during the main survey, the 95%, 97.5%, 99%, and 99.5% percentiles for IOP were calculated. For the purposes of this survey, a subject was recorded as a glaucoma case if the optic cup/disc ratio (CDR) was ≥0.7 in either eye in the presence of an IOP of ≥97.5%ile. Glaucoma suspects included those with a CDR of ≥0.7 and IOP <97.5%ile, and those where the optic discs were obscured but the IOP was >99.5%ile. Ocular hypertensives were defined as those subjects with a CDR (in either eye) of <0.7 and an IOP ≥97.5%ile.
Standardisation of the survey teams
The three teams were trained together for a month before the survey started and then retrained after 2 months in the field and a break for Ramadan. The initial training period involved testing for inter-nurse and intra-nurse agreement for visual acuity testing and inter-ophthalmologist agreement for the grading of cataract and cup:disc ratio assessment.21 Special emphasis was placed on agreement between ophthalmologists in the completion of the WHO/PBL record sheet. To this end, the supervising ophthalmologist (RB) reviewed each of the record sheets for subjects with <6/12 vision in either eye with the examining Bangladeshi ophthalmologist, involving discussion with the other ophthalmologists and the survey epidemiologist (BD) concerning identification of the main cause of low vision or blindness for each subject.
Statistical analysis
The supervising ophthalmologist, epidemiologist, and the three ophthalmologists coordinated a systematic approach for the decision making process regarding identification of the cause(s) of low vision and/or blindness, based on the ocular examination findings. In accordance with the coding instructions for the WHO/PBL Prevention of Blindness Proforma (Version III),22 the survey ophthalmologist would record all ocular disorders, for each eye separately, that were identified in the course of examining all subjects with <6/12 VA in either one or both eyes. After listing “all causes of blindness or low vision for each eye,” the ophthalmologist identified which of these disorders was the main cause of low vision or blindness for each eye separately. Next, the ophthalmologist decided what was the principal disorder responsible for low vision or blindness for the subject, taking into account the main cause for each individual eye. The final decision concerning the major cause of visual impairment for a particular subject was determined after considering the disorder in either eye that was “most amenable to treatment or prevention.” In the instance when different main causes had been identified for each eye separately in a given individual, the ophthalmologists chose as the principal disorder for that subject to be the one that was most readily curable or, if not curable, most easily preventable.
Based on the criteria of “most readily curable or most easily preventable,” the following ranking system for determination of the cause of low vision or blindness was utilised:
-
Uncorrected aphakia
-
Refractive errors/amblyopia (in the presence of a lens opacity graded 0 or 1 with SE ≥0.5 or ≤−0.5)
-
Cataract (when lens opacity grading was adjudged to be 2A, 2B, or 3)
-
Corneal opacities and phthisis
-
Glaucoma
-
Anterior uveitis.
Posterior segment disorders
Cataract was considered to be the principal cause of low vision/blindness for the subject if the lens opacity in the visually impaired eye(s) was of grade 2A, 2B, or 3, and if no other more “treatable” cause of vision loss was present for that person. In those cases when lens opacity grading was either grade 0 or 1 bilaterally and there was a refractive error ≥+0.5 dioptres or ≤-0.5 dioptres, then refractive error was identified as the main cause of visual loss.
All people with low vision or who were blind were referred to the nearest eye care facility—for example, a government district or non-government sponsored hospital.
All information from the personal data records and the visual examinations data was processed in a specially designed database in Epi-Info (Version 6.04b).23 In order to ensure optimal data quality control, all questionnaire data were sequentially entered into the database twice by two experienced data processors specially trained to work with this database. Validation of the doubly entered data was then performed and any corrections needed were made before proceeding on the data analysis in Epi-Info and SPSS (Statistical Package for the Social Sciences, Chicago, IL, USA).24
The prevalences for blindness and low vision were estimated, while accounting for design effects caused by the cluster sampling strategy according to the Taylor linearised deviation variance estimate approach.25 Multiple logistic regression was carried out in order to investigate the associations of sex, age, area of residence, and literacy status with visual impairment. The 95% confidence intervals for the prevalence estimates and regression odds ratios (OR) were also determined. Finally, p values less than 0.05 were taken to be statistically significant for χ2 and logistic regression analysis.
Non-responders
Those enumerated subjects who did not attend the examination process following the initial verbal invitation by the post-enumeration logisticians were repeatedly requested to attend if they were present in or near their home. Those subjects who agreed to participate but were unable (for example, infirmity) or unwilling to attend the temporary examination centre in the locality were instead examined at home. Visual acuity and a manual refraction were performed in all such people; in those with <6/12 VA, corrected visual acuity, cataract grading, and funduscopic examination were also performed. People who either refused to attend for the eye examination or were not available were listed as “non-responders,” with the reason for non-attendance recorded by the logistical staff. All non-responders were recorded as “believed blind” or “not blind” in each eye separately, depending on the answer given by the non-responder themselves, if available, or by a close relative or neighbour of the enumerated individual if s/he was absent.
RESULTS
Demographics
A total of 12 782 eligible adults 30 years of age and older were enumerated, of whom 11 624 subjects were examined (90.9% response rate). There were 9371 (90.9%) and 2253 (91.0%) subjects examined within the rural and urban clusters, respectively. In sex terms, the overall response rate for being examined was higher for women (94.65%) than that for men (87.37%) in the study. Stratified analysis according to 10 year age groups identified that there were substantially more males (p<0.001) that did not participate in the survey than females, especially among individuals of ages ranging from 30 to 59 years. Upon analysing the reasons identified for non-participation in the survey—as provided by family members or neighbours of the non-respondents—it was found that “working at the time of the examination” was the principal reason reported for males not being examined. This was most especially the case among males of ages 30–59 years, which corresponds to being economically active in Bangladesh. There was no difference however in the proportions of male and female non-responders amongst older subjects—that is, aged 60 and above, which typically relates to a status of economic dependency rather than being in active employment in Bangladesh.11 No statistically significant difference was found in the proportion of responders and non-responders across the six administrative divisions of Bangladesh or according to rural versus urban residence of the subject.
Distribution of examined subjects into two broad visual acuity groups (≥6/12 and <6/12), according to sex and by 10 year age groups is presented in Table 1. Analysis of the relative proportions of females and males having ≥6/12 or <6/12 VA in the better eye according to the age bands indicates that there was a significant difference (p<0.001) between sexes. This difference demonstrates that with increasing age, there is a higher proportion of females that are visually impaired (VA <6/12) when compared with males in the same 10 year age groups.
Distribution of examined subjects, by 10 year age groups, according to visual acuity status (≥ or <6/12 in the better eye)
Presenting and corrected visual acuity
A large majority of the examined subjects (9854 people, 84.77%) had a presenting visual acuity of ≥6/12 (logMAR <0.3) in the better eye. Of these, however, there were 748 subjects who had <6/12 vision in the fellow eye. A further 1770 (15.23%) people had <6/12 vision bilaterally. In total, therefore, there were 2518 subjects (21.66%, 95% CI 20.9 to 22.4) who had a presenting visual acuity of less than 6/12 in either one or both eyes. As described above, these individuals underwent a more comprehensive ocular examination that involved cataract grading and a dilated posterior segment examination, in order to identify the cause of low vision or blindness for these subjects. The distribution of all examined subjects by visual acuity category in the better eye is shown in Table 2.
Distribution of subjects according to presenting and corrected visual acuities in the better eye with age standardised prevalences based on presenting VA (n=11624)
A total of 162 subjects were found to be bilaterally blind on presentation (<3/60; >1.3 logMAR) in the study sample. This figure corresponds to a crude blindness prevalence of 1.39% (95% CI 1.17 to 1.62, design effect = 2.2), while the age standardised blindness prevalence was determined to be 1.53% (95% CI 1.31 to 1.75) in people over the age of 30 years, based on the most recent official population estimates available for Bangladesh.11
In relation to other grades of visual loss within the sample, 55 people (0.47%, 95% CI 0.33 to 0.61) had severe visual impairment upon presentation (<6/60 to ≥3/60) in the better eye, and 849 subjects (7.30%, 95% CI 6.72 to 7.89) who had moderate visual impairment (<6/18 to ≥6/60). Finally, a total of 704 people (6.06%, 95% CI 5.52 to 6.60) had “near normal” presenting visual acuity (<6/12 to ≥6/18) in the better eye.
Following trial lens correction based on the objective, autorefractometer result, these figures for blindness, severe visual impairment, moderate visual impairment, and near normal vision changed, indicating a notable shift towards improvement in visual acuity status. These new figures became 125 (1.08%, 95% CI 0.86 to 1.29), 26 (0.22%, 95% CI 0.14 to 0.31), 385 (3.31%, 2.89 to 3.74), 329 (2.83%, 95% CI 2.47 to 3.20), respectively. The subtotal of 9854 subjects (84.77%, 95% CI 83.80 to 85.75) with a presenting visual acuity of ≥6/12 in either one or both eyes, became 10 759 (92.56%, 95% CI 91.88 to 93.23) with correction. The crude and age standardised prevalence results for presenting and corrected visual acuities are presented in Table 2, as are age standardised prevalence figures based on presenting VA. By combining the blindness and severe visual impairment categories, the age standardised prevalence for having a presenting visual acuity <6/60 in the better eye was 2.05% (95% CI 1.79 to 2.31), while the age standardised prevalence for vision <6/12 in the better eye was 16.43% (95% CI 15.76 to 17.10).
Unilateral blindness
In addition to the 162 binocularly blind people, there were a further 313 subjects who were found to be unilaterally blind; this corresponds to a unilateral blindness prevalence of 2.69% (95% CI 2.39 to 2.98). The majority of those subjects found to be uniocularly blind (61.0%) had less than 6/12 vision in the other eye. The major causes of blindness in the affected eye were cataract (62.24%), central corneal opacity (9.18%), and phthisical/disorganised or absent globe (6.12%).
Visual acuity and age
Figure 3 illustrates the distribution of presenting visual acuity status according to age of the subject, in 10 year age groups. The proportion of subjects with normal vision (≥6/12) was shown to decrease significantly with increasing age. Overall this trend difference across the five visual acuity categories, by age, was found to be statistically significant (p<0.001). Moreover, there was a marked exponential increase in bilateral blindness prevalence according to increased age of the subject (Fig 4), culminating with a prevalence of 11.46% in people 70 years of age and older.

Distribution of presenting visual acuity categories across 10 year age groups.

Linear and exponential trends of blindness prevalence according to 10 year age groups.
Visual acuity and rural/urban residence
There was a significant difference in terms of rural versus urban residence regarding presenting visual acuity, with a higher proportion of rural dwellers being less than 6/12 when compared with urban residents (p <0.001, 95% CI OR 1.34 to 1.79). However, there was no statistically significant difference (95% CI OR 0.78 to 1.87) among those of rural or urban residence in relation to the proportion of blind subjects living in each area.
Visual acuity and sex
There was a marked difference in presenting visual acuity between women and men. There was a higher prevalence of blindness in women (1.72%) than men (1.06%). This difference was statistically highly significant (p <0.003, 95% CI OR 1.18 to 2.29) as was the difference in the proportion of women with <6/18 vision in the better eye when compared to men (p <0.02, 95% CI OR 1.17 to 1.33).
Visual acuity and administrative division
In terms of the geographic and administrative regions within Bangladesh, higher blindness prevalences were found to exist in the divisions of Barisal (2.28%; 95% CI 1.24 to 3.32) and Khulna (1.97%; 95% CI 1.28 to 2.69) located in the primarily rural south and western areas of the country when compared with the remaining four divisions. Most notable was the relatively low blindness prevalence in Dhaka division (1.13%; 95% CI 0.80 to 1.46), the largest and most urbanised of the six administrative divisions of Bangladesh.
Visual acuity, literacy, and occupation
Occupational status was classified into three major categories: manual, non-manual, and inactive/unemployed. The prevalences of low vision and blindness among those who were occupationally inactive—that is, either unemployed or retired were significantly higher when this subgroup was compared with other subjects (p <0.001).
The type of work undertaken by male participants was found to be associated with a statistically significant difference in visual acuity status. There was a higher proportion of manual workers with VA <6/12 in the better eye when compared with non-manual workers (p<0.001; 95% CI OR 2.09 to 3.18) as there was also for VA <3/60—that is, blind (p<0.02; 95% CI OR 1.11 to 9.35).
A higher prevalence of visual impairment was identified among illiterate subjects when compared with those able to read, both in terms of low vision (p<0.001; 95% CI OR 2.56 to 3.19) and for blindness (p<0.001; 95% CI OR 5.86 to 9.20).
Causes of low vision and blindness
As described previously, the ophthalmologists recorded each ocular disorder that was diagnosed in eyes with <6/12 visual acuity. In total, there were 4288 visually impaired eyes; this figure represents 18.44% of all the eyes examined, corresponding to 21.88% of the 11 624 examined subjects. Table 3 provides a breakdown of the lens opacity grading for all <6/12 eyes, indicating that more than two thirds (68.59%) of eyes were graded 2A, 2B, or 3, while only approximately one quarter (25.28%) either had no cataract (grade 0) or minimal lens opacity present (grade 1).
Distribution of all lens opacities in the 4288 eyes with <6/12 visual acuity
Table 4 outlines in further detail all the ocular disorders, including lens opacities, which were diagnosed in eyes with <6/12 vision. The percentages for this table are calculated on the basis of the 4288 total eyes. Principal among the disorders is that of refractive error for which approximately 80% of all subjects examined with <6/12 VA were found to have a spherical equivalent ≥0.5 SE or, alternatively, ≤−0.5 SE. A subanalysis of those subjects with refractive error was conducted in which the lens opacity grading was taken into account in order to determine the level of refractive error in eyes with non-existent (grade 0) or minimal cataract (grade 1). Overall 13.46% of visually impaired eyes, without significant lens opacity, were somewhat hypermetropic (SE ≥+0.5 to <+5.0) whereas “low grade” myopia (SE ≤−0.5 to >−5.0) was far less common (7.53%) in visually impaired eyes. Less common were high hypermetropia (0.46%) and high (0.40%) and extreme myopia (0.21%) in eyes with minimal or non-existent lens opacity. The remainder of Table 4 indicates the extent to which other disorders were diagnosed in <6/12 eyes.
Distribution of all ocular disorders in the 4288 eyes with <6/12 visual acuity
The presence of combined pathologies in the 4288 eyes with <6/12 visual acuity was a common finding, with the most frequently identified combinations being refractive error with cataract (52.3%), refractive error with AMD (9.0%), and cataract with AMD (8.6%).
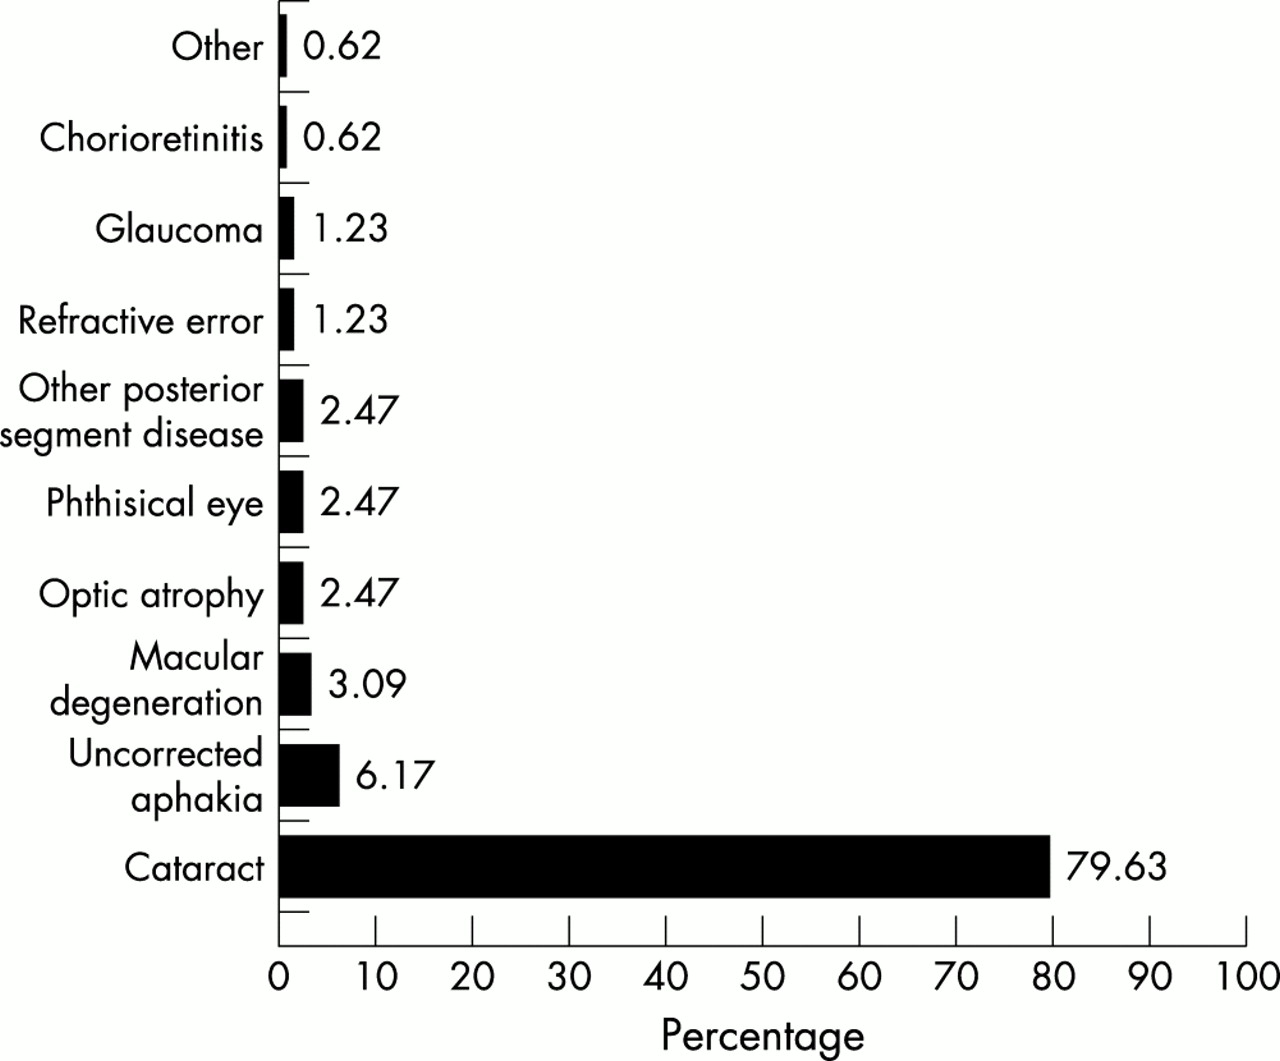
As shown in Table 5, the main cause of <6/12 presenting visual acuity for subjects was cataract (73.39%), followed by refractive error (18.87%) and uncorrected aphakia (1.19%). In relation to the causes of bilateral blindness, cataract was also the principal disorder, having been identified for 129 of the 162 blind subjects (79.63%) followed by uncorrected aphakia (6.17%), as shown in Figure 5. The lens opacity grading in 127 of 129 (98.45%) subjects blind due to cataract were either of grades 2B or 3, indicating a tendency towards the development of untreated, hypermature opacities, with the remaining two bilaterally blind cases having lens opacities that were graded 2A. The average age of those blind due to cataract was 71.02 years (SD 12.74) while the mean age in the other 33 bilaterally blind people was 61.76 years (SD 15.64); this difference was statistically significant (F=12.6; p<0.001). Macular degeneration was the third most common cause of blindness, with the mean age for the five subjects with blinding macular disease of 72.60 years (SD 7.99).
Distribution of the main cause of visual impairment in people with <6/12 presenting VA in the better eye
Main cause of blindness for people with visual acuity <3/60 in the better eye.
In relation to glaucoma, CDR and IOP were measured on certain individuals as described according to the examination protocol. From a population based distribution of intraocular pressure measured with the Schiotz tonometer, based on the cut-off measurements 95%, 97.5%, 99%, 99.5% percentiles were 18.9, 20.6, 29.25, and 31.9 mm Hg respectively. Of the 13 people identified with glaucoma as the main cause of <6/12 presenting vision in the better eye, the findings in each eye were recorded according to the categories of “glaucoma,” as shown in Table 6. The more “glaucomatous” category of each of the eyes is chosen as that for the individual.
Distribution of cases of glaucoma in subjects with <6/12 visual acuity
DISCUSSION
This survey is the first nationally representative study of the prevalence and causes of blindness and low vision in Bangladeshi adults. This study provides vital epidemiological data on the level of visual impairment among adults in the country that will be useful for the rational planning and implementation of organised eye care service delivery, particularly one focused on cataract surgical services initially. While national in scope and design, this research also yielded important information concerning the level of blindness and its causes within each of the six regional administrative divisions in Bangladesh.
The age standardised prevalence of bilateral blindness was calculated at 1.52% (95% CI 1.31 to 1.75) in the 11 624 people aged 30 years and older that were examined in the course of this national survey. The age specific blindness prevalence was found to be greater with increased age. Blindness was also found to be more prevalent among women, illiterate subjects, and in economically disadvantaged people. These findings are similar to those reported elsewhere in the region, in studies from India6,7 and Nepal.8,10
Based upon the blindness prevalence estimate obtained in this survey, by extrapolation to the national target population of Bangladeshi adults aged 30 years and older, it is estimated that there are approximately 650 000 adults (95% CI = 552 175 to 740 736) blind due to cataract in the country at present. Assuming the incidence of blinding cataract cases to be one fifth of those already existent,1 a further 130 000 new cases are thought to develop annually. Similarly, by extrapolation, there are an estimated 6.65 million (95% CI 6.94 to 7.23) adults with <6/12 vision in either or both eyes.
Thus, the principal finding arising from this survey is the very high level of blindness and low vision due to unoperated cataract and, to a lesser extent, uncorrected aphakia among the study subjects. The figure of 79.6% of blindness being attributed to unoperated lens opacities represents one of the highest ever reported from a population based study of this kind. One reasonable explanation for this finding deals with the relatively low cataract surgical output in Bangladesh.
In order to ameliorate this situation across Bangladesh, specific measures are in need of implementation. Such action is principally oriented towards increasing the currently inadequate cataract surgical coverage and resolution of uncorrected aphakic status. Included among these measures is the appointment of surgically trained ophthalmologists to each one of the 64 district hospitals in the country, as by the year 2001 the large majority of these facilities did not have a practising ophthalmologist and/or cataract surgery is not performed there. This situation exists despite the fact that there are approximately 400 qualified ophthalmologists in Bangladesh, some of who are trained in microsurgery techniques.
Another measure that needs to be implemented is the purchase and provision of essential surgical equipment to the district hospitals (for example, operating microscopes) in order to provide fundamental logistical support to the district ophthalmologist. The development and integration of primary eye care services in the already well organised primary healthcare structures in Bangladesh is another intervention that would facilitate community based eye health education/promotion and in the referral of cases for treatment. Finally the further training of more ophthalmologists in microsurgery techniques, of nurses in specialised ophthalmic nursing, and of paramedical assistants in the areas of basic eye disease recognition, treatment, and referral is required. Given the high rate of uncorrected aphakia as a cause of blindness, there is a need to ensure adequate provision (or maintenance and repair) of aphakic spectacles to those people in need of them. Alternatively, as part of the reorganisation of cataract surgical services, increased access to intraocular lenses placement should be countenanced, as a part of the overall strategy of high quality-high volume surgical services.
The absence of trachoma as a cause of blindness and low vision in Bangladesh, unlike that in neighbouring India, Pakistan, and Nepal also contributes to an increase of the relative proportion of cataract as the main cause. Moreover, data analysis regarding those study subjects who had been operated for cataract indicates that surgical coverage is disproportionately higher in male subjects than in females, resulting in a larger cataract burden for females.
As previously mentioned, all subjects with <6/12 visual acuity in either eye were dilated in order to allow for the identification of any posterior segment disease. The low level of diabetic retinopathy as the cause of visual impairment is quite notable within the examined subjects. Moreover, no subject was found to be blind due to diabetic retinopathy, similar to that found by Dandona et al in neighbouring India.6 The main reasons for these findings may be the relatively short life expectancy of Bangladesh adults and the relatively low minimum age (30 years) as the main subject inclusion criteria for the study. The authors recognise, however, that subtle retinal pathology in subjects with good vision (≥6/12 in both eyes) may have been less readily detected because the retinal examination was through undilated pupils.
Finally, despite a substantial reduction in the fertility rate in Bangladesh in recent years, overall population growth continues to rise.13 As such, there will be an estimated 180 million people in Bangladesh by the year 2025, with more than half of the population being over the age of 30 years, and one fifth (34 million) being 50 years of age and older. Based on the findings from this survey and future population dynamics, it is imperative that eye care service delivery be organised in Bangladesh in the near future, focusing principally on high quality and high quantity cataract surgical and refractive error correction services. This recommendation is consistent with the prioritised areas of action for the region as outlined by the WHO South East Asia policy document Vision 2020—the right to sight.26,27
Acknowledgments
The authors would like to recognise the financial and administrative support provided by Sight Savers International (SSI), UK, and the SSI office in Bangladesh over the course of this survey. Appreciation is also expressed to the staff—ophthalmologists, nurses, and ophthalmic technicians, of the National Institute of Ophthalmology, Dhaka, who participated in the study and to the administrative staff of the Bangladesh National Council for the Blind for their collaboration. Recognition of the enumeration, quality control and data processing staff of Mitra and Associates Research Consultants, Dhaka is also made.
Appreciation is also expressed to the Bangladesh Country Office of the World Health Organization and the Urban Planning Department of Dhaka City Corporation for their technical support in relation to the provision of the GIS maps of the Dhaka metropolitan area. Finally the authors thank Mr Dan Rosser, Mr Ian Murdoch, and Mr Darwin Minassian of the Institute of Ophthalmology, London, for their expert guidance on visual acuity testing and lens opacity classification.
REFERENCES
Linked Articles
- BJO at a glance