Article Text

Abstract
Background: In the UK and USA, government guidelines for childhood physical activity have been set (⩾60 min/day at ⩾3 metabolic equivalents of thermogenesis (METs)), and body mass index (BMI) chosen as the outcome measure.
Aim: To determine the extent to which physical activity at the government-recommended intensity is associated with change in body mass/fat and metabolic health in pre-pubertal children.
Methods: Non-intervention longitudinal study of 113 boys and 99 girls (born 1995/96) recruited from 54 schools. Physical activity (Actigraph accelerometers), changes in body mass (raw and age/gender-standardised BMI), fatness (skin-fold thickness and waist circumference) and metabolic status (insulin resistance, triglycerides, cholesterol/HDL ratio and blood pressure – separately and as a composite metabolic z score) were measured on four annual occasions (5, 6, 7 and 8 years).
Results: Mean physical activity did not change over time in either sex. Averaging the 7-day recordings from four time points rather than one increased the reliability of characterising a child’s activity from 71% to 90%. Some 42% of boys and 11% of girls met the guideline. There were no associations between physical activity and changes in any measurement of body mass or fatness over time in either sex (eg, BMI standard deviation scores: r = −0.02, p = 0.76). However, there was a small to moderate inverse association between physical activity and change in composite metabolic score (r = −0.19, p<0.01). Mixed effects modelling showed that the improvement in metabolic score among the more active compared to the less active children was linear with time (−0.08 z scores/year, p = 0.001).
Conclusions: In children, physical activity above the government-recommended intensity of 3 METs is associated with a progressive improvement in metabolic health but not with a change in BMI or fatness. Girls habitually undertake less physical activity than boys, questioning whether girls in particular should be encouraged to do more, or the recommendations adjusted for girls.
Statistics from Altmetric.com
Childhood obesity is increasing throughout the industrialised world, and underactivity and overnutrition are both believed to contribute.1 Obesity is of concern because it is thought to cause the insulin resistance that underlies diabetes and cardiovascular disease.2 With this in mind, similar government recommendations for physical activity in children have been set in the UK and USA: “all young people should participate in physical activity of at least moderate intensity for one hour or more a day”.3–6 A recent UK government action plan invoked the guideline in its public service agreement (PSA) to “…to halt the year-on-year increase in obesity among children under 11y by the year 2010”.7 However, a report published by the UK National Audit Office in February 2006 felt that the “evidence needed to determine whether the Government’s range of initiatives is sufficient to achieve their target is in short supply”.8 The proportions of US and UK children meeting the guideline have been reported previously, but not in relation to health status.9 10
A recent review of cross-sectional studies found inconsistent evidence of a link between physical activity (mostly questionnaire-based) and insulin resistance in children.11 Questionnaires are unreliable measures of physical activity, correlating poorly with accelerometry (r∼0.30),12 an objective technique which is re-writing the literature on physical activity in childhood.13 14
There have been no longitudinal studies describing the relationship between physical activity and changes in metabolic outcomes over time. We report here the amount of time spent in activities of at least moderate intensity (accumulated during a 3-year period) and relate it to changes in body mass, fatness and metabolic status (over the 3-year period) in a single cohort of pre-pubertal children.
METHODS
Participants
EarlyBird is a non-intervention prospective cohort study of 307 healthy children (170 boys and 137 girls). The children were recruited at age 5 years (school entry: January 2000 to January 2001) from 54 randomly selected Plymouth schools and covered a wide socio-economic mix (index of multiple deprivation 2004 score: cohort 26.1, Plymouth 26.3, England 21.7, with cities ranging from 8 to 4515). Most children (98%, n = 302) were white Caucasians, while five (2%) were of mixed race, reflecting the ethnic mix of the area. Approval was obtained from the local research ethics committee in 1999; the study’s rationale, recruitment procedures and protocol have been reported in detail elsewhere.16 The cohort is measured annually, and this report covers a period of 3 pre-pubertal years, using data from four time points: 5 years, 6 years, 7 years and 8 years (time between visits: mean 1.0 years, SD 1 month).
Physical activity
Actigraph (formerly MTI and CSA) accelerometers (Fort Walton Beach, FL) are small (50×41×15 mm), lightweight (43 g), robust, tamperproof, of good technical reproducibility17 and correlate well with criterion measures of free-living activity-related energy expenditure (r = 0.70 independent of body weight18 and r = 0.92 with body weight19). They record clock time and the intensity and duration of physical activity, collected into 1 min epochs. The accelerometers were worn on an adjustable belt around the child’s waist and were set to run continuously for 7 days (5 school days and a weekend) at each of the four annual time points. The sensitivity of each accelerometer was measured under controlled conditions using a motorised turntable.17 Seasonality was measured on a continuous scale by the number of daylight hours (8 am–9 pm) specific to Plymouth for the week the accelerometer was worn.20
The international unit of energy expenditure is the MET (metabolic equivalent of thermogenesis), where 1 MET equates to resting energy expenditure. The government recommends that children undertake activity of “at least moderate intensity”, which officially corresponds to ⩾3 METs.4 Three METs is equivalent to a walking speed of ∼4 km/h,4 21 and our own calibration trials (unpublished) indicate that pre-pubertal children walking at 4 km/h average ∼2500 counts/min on an Actigraph accelerometer. These are similar to the calibration data reported by Puyau et al involving 6–16-year-olds in four activities expending 2–4 METs in aerobic warm-up, walking at 4 km/h, Tae-Bo and unstructured playing (mean 2688 counts/min equivalent to 3.02 METs)18 and Schmitz et al (8–12-year-olds walking at 4 km/h or 2359 counts/min equivalent to 3.2 METs).19
Change in body mass and fatness
Body mass was assessed by body mass index (BMI) (both absolute and age-adjusted standard deviation scores (SDS) calculated from 1990 UK norms) and fatness by skin-fold thickness and waist circumference. Skinfold thickness was expressed as the sum of biceps, triceps, subscapular, paraumbilical and suprailiac measurements.
Change in metabolic status
Four metabolic variables (insulin resistance, triglycerides, cholesterol/HDL ratio and mean arterial blood pressure) are reported separately and as a composite metabolic z score (internally derived time point specific z scores were calculated for each of the four metabolic variables, and averaged, with equal weighting, for each child – the lower the score, the healthier the child). Insulin, glucose, triglycerides and the cholesterol/HDL ratio were measured in a fasting venous blood sample taken at 9 am. Insulin resistance was derived from the HOMA-IR program, which has been validated against the euglycemic clamp (r = 0.91) in healthy children.22 Systolic (SBP) and diastolic blood pressure (DBP) was taken with a semi-automated sphygmomanometer and mean arterial blood pressure was calculated [(SBP+2×DBP)]/3.
The change in each of the outcome variables over the 3-year period was calculated by subtracting the measurement at 5 years from the measurement at 8 years for each child.
This report is based on the 113 boys and 99 girls who had complete measurements for all four metabolic risk factors at both the 5-year and 8-year visits and had accumulated at least 20 days of physical activity data during the 3-year period (ie, at each time point the accelerometer had to be worn for at least 9 h/day on a minimum of 4 school days and 1 weekend day).
Statistics
Each annual 7-day sample of physical activity was adjusted for seasonality and for the sensitivity of each accelerometer. The numbers of 1 min epochs incorporating ⩾2500 counts/min over the 3-year period were added together, and averaged for the total number of days (range 20–28) for which the accelerometer was worn for at least 9 h. A child was deemed to meet the guideline if, over the four time points, he or she averaged ⩾60 min/day at ⩾2500 counts/min.
A single cohort studied at serial time points made it possible to establish the level of consistency of physical activity over time. The equation below23 was used to determine the % reliability (R) of characterising a child’s physical activity level using one, two, three or four annual time points. Repeated measures analysis of variance (physical activity at 5 years, 6 years, 7 years and 8 years) was performed to calculate within-subject variance and between-subject variance.

where t is number of time points, sw2 the within-subject variance and sb2 the between-subject variance.
Multiple linear regression analysis was performed to quantify the partial correlation between the number of minutes spent at ⩾3 METs and changes in body mass, fatness and metabolic status. Analysis of co-variance was performed to compare the changes in body mass/fatness and metabolic status by activity group (above and below the gender-specific median activity level). Both analyses controlled for exact age at baseline, years to follow-up, respective baseline measurements and socio-economic status. Change in metabolic status was further controlled for changes in body composition to establish any independent effect. Both multiple linear regression and analysis of covariance were carried out using SpSS v 14.0.
Linear mixed effects modelling was performed to test whether the trends in BMI SDS and composite metabolic score over all four time points differed by activity group (above versus below the median). For BMI SDS, the fixed effects were socio-economic status, age, activity group and age×activity group interaction. Random intercepts and age-related slope estimates for each individual child were included in the model. For the analysis of the composite metabolic score, BMI was also entered as a fixed effect to establish any independent effect. Linear mixed effect model analysis was carried out in R using the nlme package.
RESULTS
Baseline characteristics of the cohort are shown in table 1. Girls tended to have more body fat and a less favourable metabolic status than boys.
Attrition/compliance
During the 3-year period, 37 children left the study. Of the remaining 270 children, 256 underwent all the measurements of body mass/fatness and metabolic status at 5 years and 8 years. Of these, 44 children did not meet the minimum criterion of 20 days’ accelerometer data and thus were excluded from the analysis. The BMI SDS at 8 years of those excluded was no different from those remaining (boys: 0.13 SDS higher, p = 0.56; girls: 0.05 SDS higher, p = 0.93). The final analysis was therefore based on 212 children (113 boys and 99 girls).
Consistency and reliability of physical activity
There were no significant trends, up or down, in the mean daily number of minutes spent at ⩾2500 counts/min from 5 to 8 years in either gender (boys: 5 years = 54, 6 years = 58, 7 years = 58, 8 years = 57 min/day, p = 0.25 for trend; girls: 5 years = 43, 6 years = 48, 7 years = 45, 8 years = 45 min/day, p = 0.39 for trend). Year-on-year correlations of weekly physical activity ranged from r = 0.44 to r = 0.54 (all p<0.001). Thus, according to the equation above, a single time point recording physical activity for 7 days would provide 71% reliability in ranking/positioning the children, two would provide 82%, three 87% and four (used for this report) 90%.
Proportion of children meeting the guideline
Based on the mean of the four time points, the girls spent 27% less time than the boys at the government-recommended level of ⩾3 METs (45 vs 57 min/day, p<0.001), with only 11% (11/99) of girls compared to 42% (47/113) of boys meeting the guideline.
Associations of physical activity with changes in body mass, fatness and metabolic status
The number of minutes spent in activities ⩾3 METs was not associated with changes in body mass or fatness in either gender (boys: BMI and BMI SDS both r = 0.01, p>0.90; sum of five skinfolds r = 0.05, p = 0.62; waist circumference r = −0.10, p = 0.29; girls: BMI and BMI SDS both r = −0.07, p>0.49; sum of five skinfolds r = −0.05, p = 0.64; waist circumference r = −0.09, p = 0.38; all independent of age, time to follow-up, respective baseline measurements, seasonality and accelerometer sensitivity). However, there were small to moderate inverse partial correlations between the number of minutes spent in activities ⩾3 METs and changes in the composite metabolic z score in both genders, although this did not quite reach statistical significance in the boys (boys: r = −0.17, p = 0.07; girls: r = −0.23, p = 0.03). The size and significance of the partial correlations for the four individual metabolic markers varied within and between genders (insulin resistance: boys r = 0.04, p = 0.66; girls r = −0.20, p = 0.06; triglycerides: boys r = −0.12, p = 0.22; girls r = −0.26, p = 0.02; cholesterol/HDL ratio: boys r = −0.14, p = 0.14; girls r = −0.09, p = 0.39; mean blood pressure: boys r = −0.22, p = 0.02; girls r = −0.05, p = 0.63). Further adjustment for changes in body mass and fatness made little or no difference to these correlations (no r value changed by more than ±0.01). Table 2 compares the change in body mass, fatness and metabolic status of children in the more active group (above the median activity level: boys >56 min/day, girls >45 min/day) with those in the less active group (below the median). Mean BMI (raw and standardised), skin-fold thickness and waist circumference increased over the 3-year period in both sexes, but the change was the same irrespective of activity group (eg, BMI SDS boys: p = 0.70; girls: p = 0.93). However, the change in the composite metabolic z score was favourable in the more active group for both genders, although not quite reaching statistical significance in the girls (boys: p = 0.02; girls, p = 0.06). Group differences involving the metabolic changes were unaffected by further adjustment for changes in body mass and fatness.
Trends in BMI and composite metabolic score over time
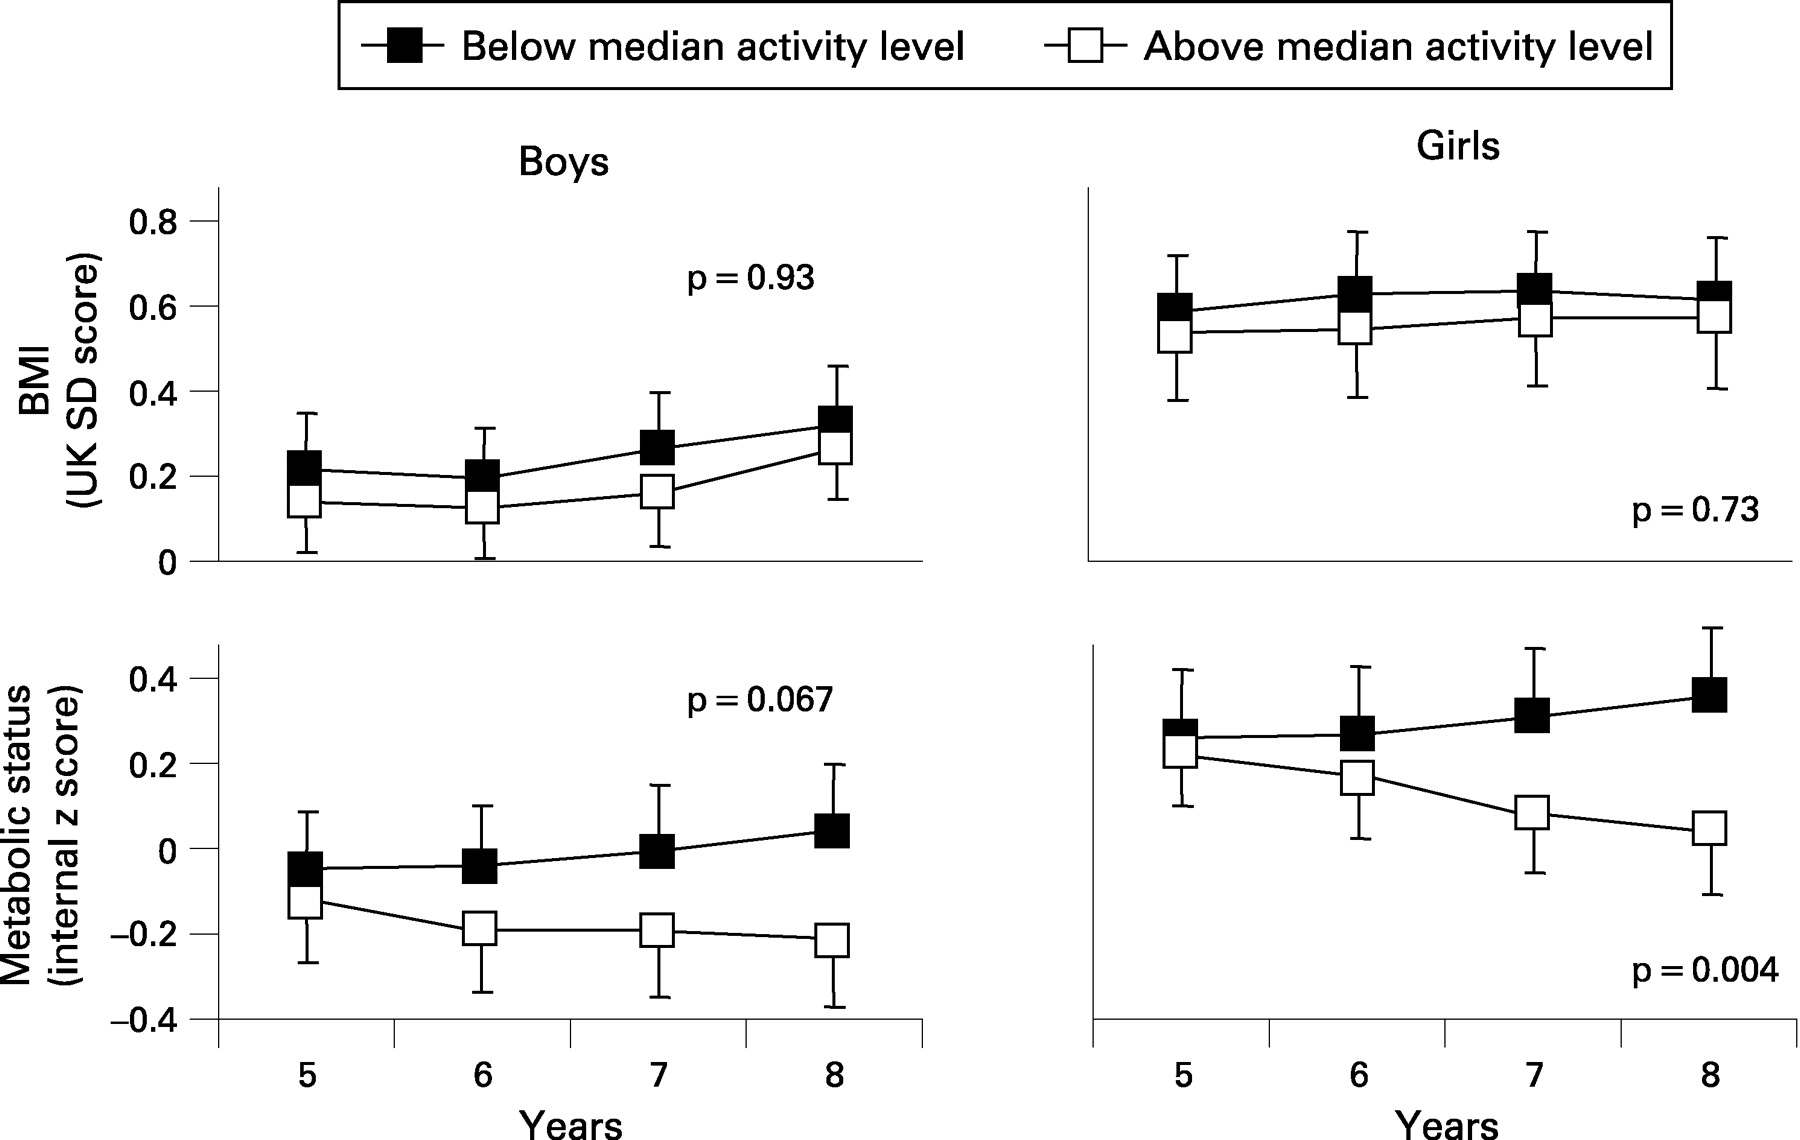
Figure 1 shows the mean BMI SDS and composite metabolic z score at 5 years, 6 years, 7 years and 8 years, categorised according to physical activity above or below the median. The linear mixed effects model confirmed that the metabolic z scores diverged, and that their divergence was linear over time (both sexes combined: 0.08 z scores/year, p = 0.001; boys: 0.06 z scores/year, p = 0.067; girls: 0.10 z scores/year, p = 0.004), while the trajectories for BMI remained parallel (both sexes combined: 0.007 SDS/year, p = 0.81; boys: 0.004 SDS/year, p = 0.93; girls: 0.012 SDS/year, p = 0.73).

The proportion of girls meeting the government guideline was too small at 11% to analyse. A gender difference in physical activity has been widely reported among children,13 14 24 25 implying that girls may be systematically less active than boys. We therefore undertook a post hoc analysis, adjusting the threshold for girls so that the proportion meeting it matched that of the boys (42%), and compared the changes in body mass, fatness and metabolic status by gender-specific activity categories. The results from the linear mixed effects model, comparing the 42% more active versus the 58% less active, showed a linear divergence in metabolic status (boys: 0.07 z scores/year, p = 0.035; girls: 0.11 z scores/year, p = 0.001) but not in BMI SDS (boys: 0.02 z scores/year, p = 0.56; girls: 0.02 z scores/year, p = 0.58), similar to that seen when comparing those above with those below the median.
DISCUSSION
To our knowledge, we report here the only data linking changes over time in the body mass, fatness and metabolic health of young children to their physical activity. The findings suggest that, while activity of at least moderate intensity (3 METs, the government’s recommendation) sustained over a period of years is associated with improving metabolic health as children approach puberty, it does not affect their BMI or other proxies of body fat. However, fewer than half the boys and only one in eight of the girls met the guideline of 60 min per day of moderate intensity activity and, worryingly no intervention has yet been successful in changing the activity habits of children long term.
Most studies using accelerometers rank individuals on the basis of data collected for 7 days or less at a single point in time,26 27 citing Trost et al as justification.28 However, it is clear from the present longitudinal data that there is variation from year to year when sampling just 1 week (mean r∼0.50). Reliance on measurements based on a single time point may result in miscategorisation and potential underestimation of the true health-related impact of physical activity. Had single time points been used in isolation to categorise the activity of children in this study, 16–20% of the boys and 19–23% of the girls would have been wrongly categorised.
What is already known on this topic
As childhood obesity continues to rise despite national initiatives, both the UK and US governments have issued guidelines for physical activity in an attempt to reduce childhood obesity, and use BMI to monitor the response.
Girls undertake less physical activity than boys and are particularly targeted in physical activity initiatives.
What this study adds
Metabolic health improves with government-recommended physical activity but, crucially, the improvement is not detectable using BMI.
Fewer than half of young boys and only one in eight girls meet the government guideline for physical activity.
Notwithstanding their lower levels, the metabolic benefits of physical activity are as strong in girls as they are in boys.
The present study was concerned with the current government guideline of 3 METs (∼2500 accelerometer counts/min), while others have applied different thresholds to “at least moderate” intensity and make correspondingly different recommendations. Thus, a recent cross-sectional study recommended that 9-year-old children should spend ∼2 h and 15-year-olds ∼1.5 h in activity of at least moderate intensity defined as 2000 counts/min.29 Another report that only 2.5% of boys and 0.5% of girls meet the guideline of 60 min/day was based on time spent at ∼4 METs (3600 counts/min).10
This study has strengths and limitations. Its longitudinal design and objective measures offer some novel insights into the longer term relationships between physical activity, body mass, fatness and metabolic health in children. Although we cannot be certain of the direction of causality from this data, the divergence in metabolic score over time is more likely to have been a cumulative response to the range of activity, which remained constant between groups, than its cause. The study is based on a single population of Caucasian children from southern England, and may not be generalisable. However, the BMI and activity levels were almost identical for 6-year-olds living in Glasgow (difference of 0.6%, p = 0.40 and 0.3%, p = 0.92, respectively)14 As BMI combines both lean mass and fat mass, it may be an inappropriate outcome measure for assessing changes in physical activity as any decrease in fat mass may have been off-set by an increase in lean mass. However, neither sum of skinfolds nor waist circumference indicated an activity-related change in fatness. While none of the measurements of body mass and fatness in this report were made with criterion methods, all four correlated closely with body fat by dual energy x-ray absorptiometry (DEXA) measured in these children at 8 years (boys: r = 0.82–0.95; girls: r = 0.90–0.95; all p<0.001) and all four correlated strongly from year to year (all r>0.85, p<0.001). Mei et al also found that BMI correlated strongly with body fat by DEXA in children of a similar age (r∼0.85).30
Three issues arise from this report. First, children who regularly spend more time engaged in physical activity at the intensity recommended by the current guidelines appear to benefit in metabolic health although not in BMI (or other measure of fatness). It may be that current guidelines are adequate, but the outcome measure used to monitor them (BMI) is too blunt. The move by UK government to defer the 2010 target to 2020 on the basis of BMI may have overlooked an important metabolic benefit of physical activity.31 Second, girls undertake systematically less physical activity than boys, and it is unclear whether the guideline should be lowered for girls, to allow for what may be a biological difference, or particular encouragement given to girls to do more. Whichever, and notwithstanding the lower levels, the metabolic benefits of physical activity are as strong in girls as they are in boys. Finally, relatively few children achieve the current guideline. To extend the positive health benefits shown here to less active children, we first need to understand why some undertake more physical activity than others, and this may not be straightforward.
REFERENCES
Footnotes
Funding: Funding was provided by Diabetes UK, Bright Futures Trust, Smith’s Charity, Child Growth Foundation, Diabetes Foundation, Beatrice Laing Trust, Abbott, Astra-Zeneca, GSK, Ipsen and Roche. None of the sources funding this study had any involvement in its design, analysis, interpretation or writing.
Competing interests: None.
Ethics approval: Ethics approval was obtained.
Contributions: The authors have contributed as follows and have seen and approved the final version. BM: data entry, analysis and writing; LV; co-ordinator of the EarlyBird study/writing; JH: data entry and analysis; AJ: data collection; TW: director of the EarlyBird study/writing.