The Urban Heat Island in an Urban Context: A Case Study of Mashhad, Iran


Abstract
:1. Introduction
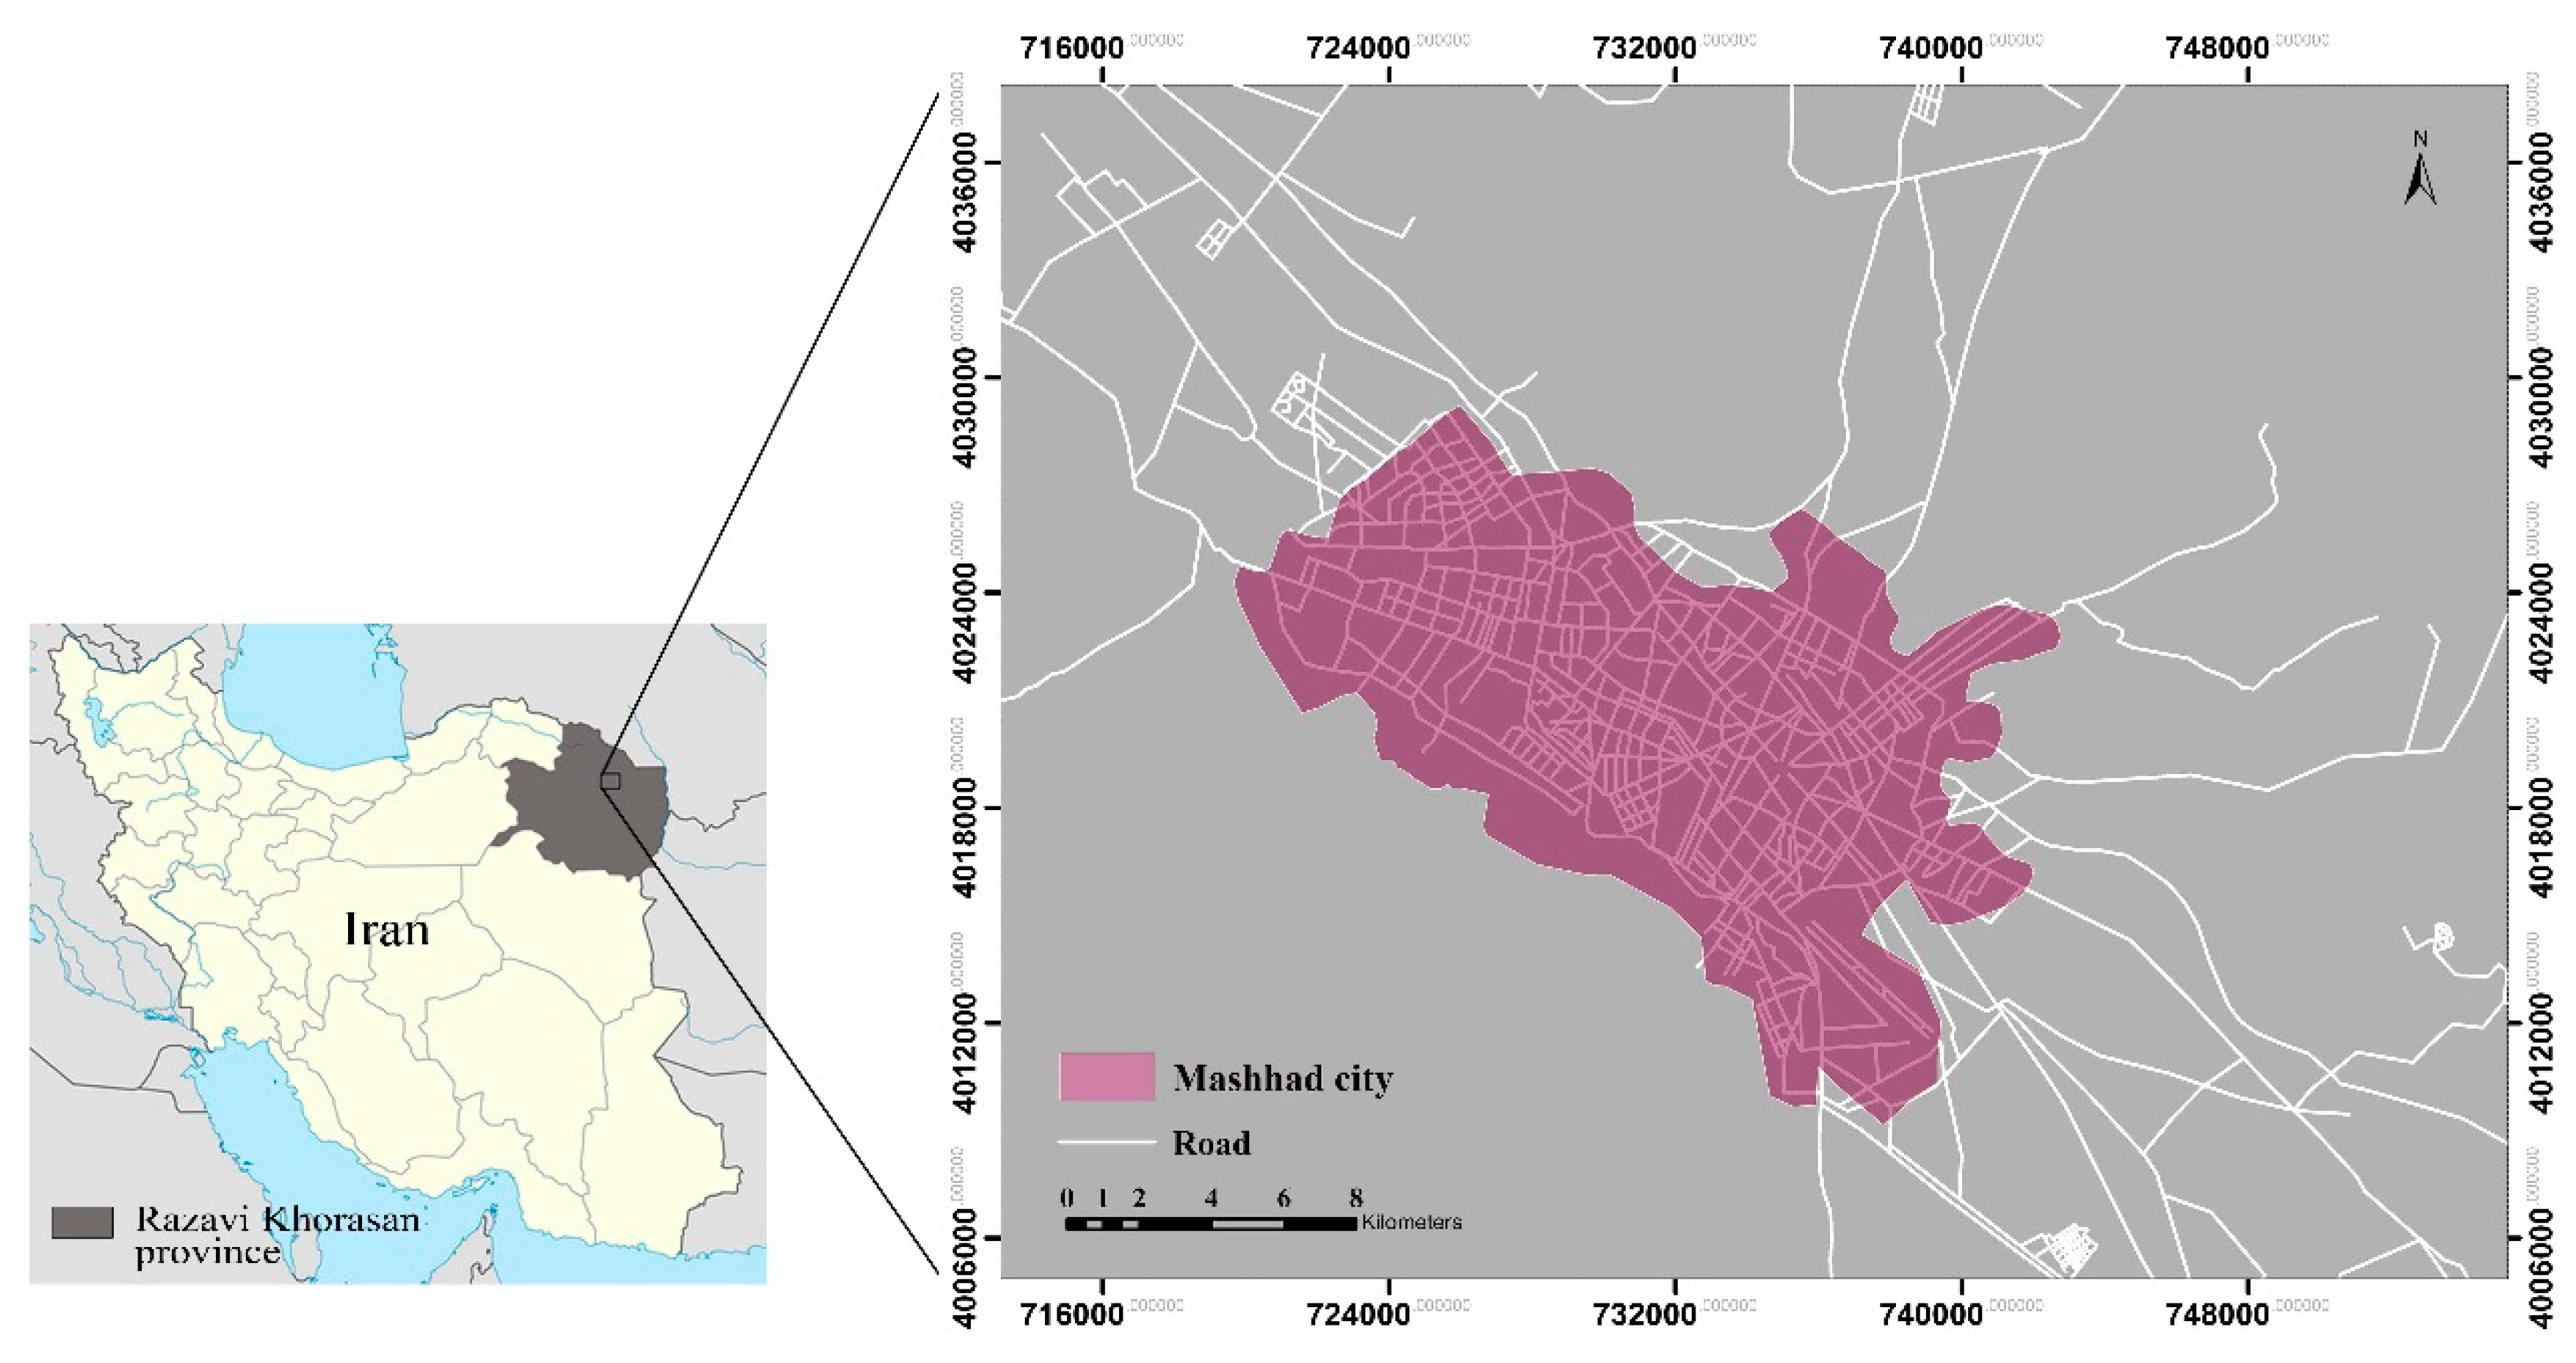
2. Study Area
3. Methodology
3.1. Remote Sensing Data, Image Pre-Processing and LST Calculation
3.2. Land Cover Classification
3.3. NDVI and NDBI
4. Results and Discussion
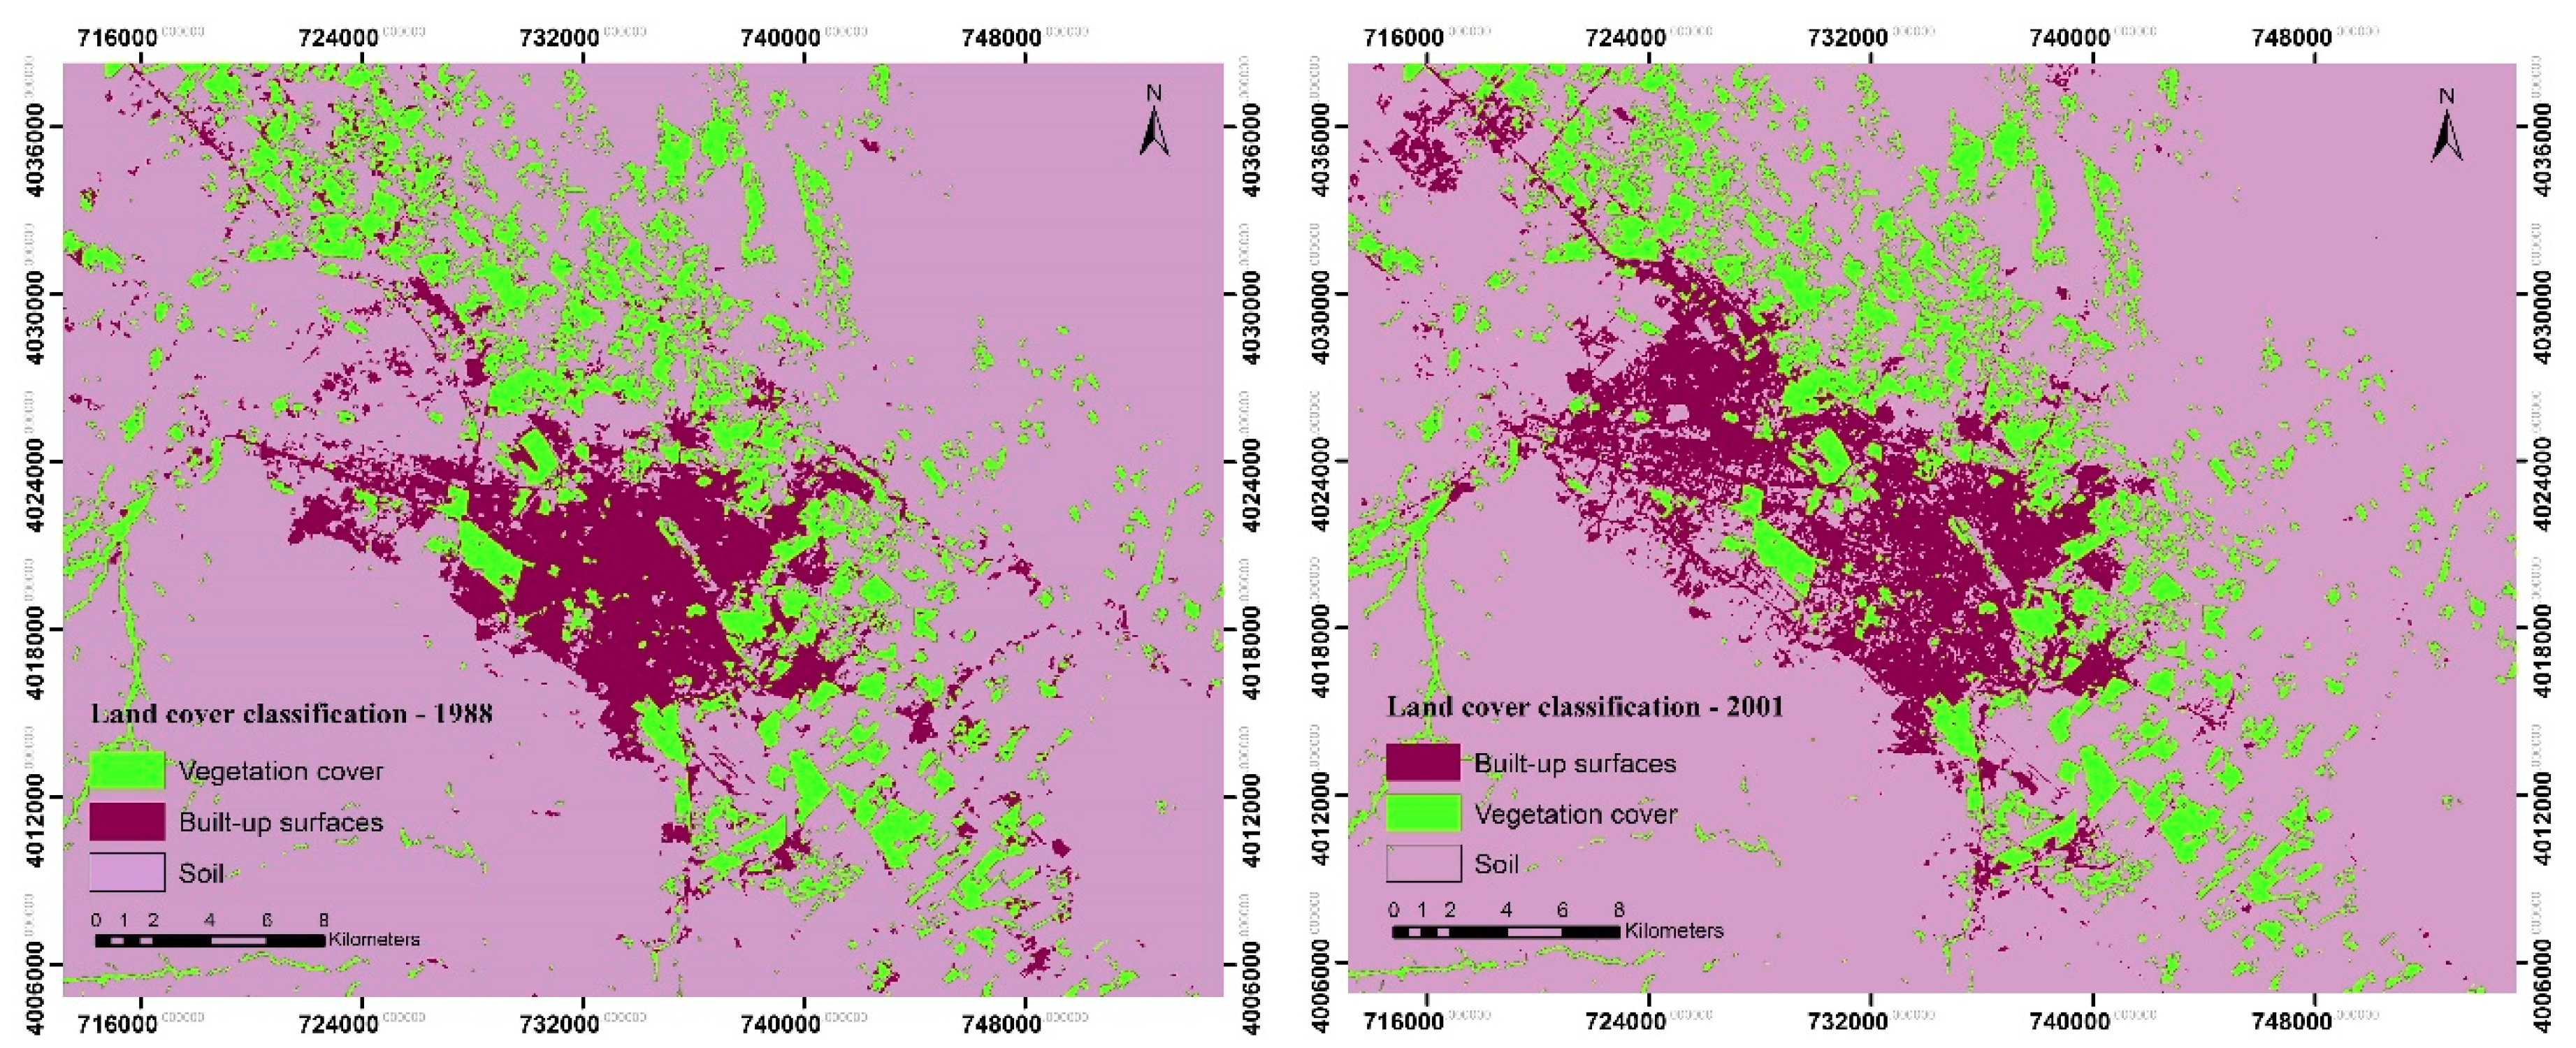
4.1. Land Cover Mapping
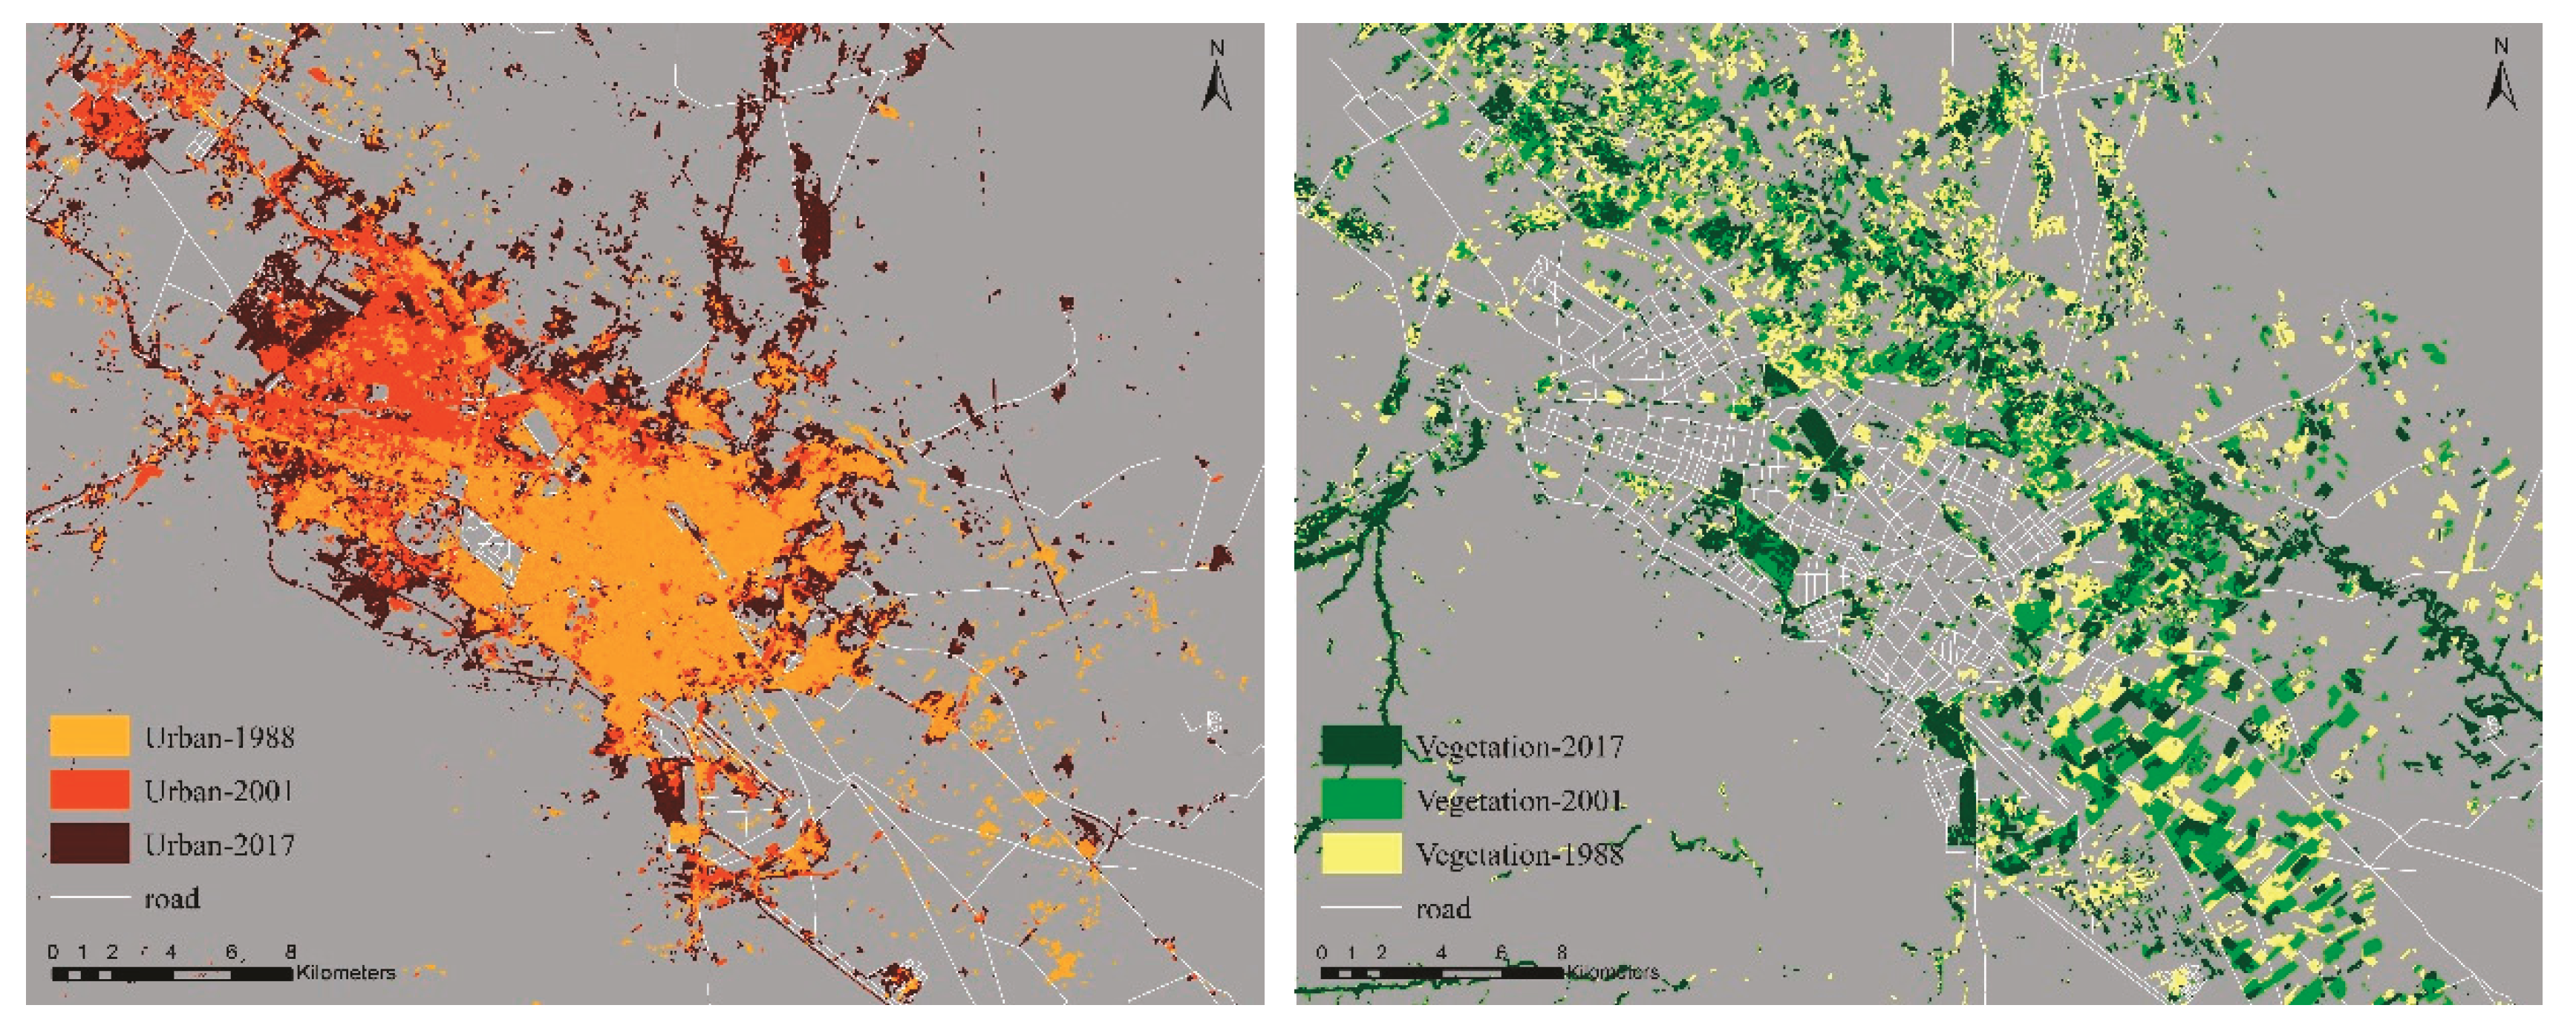
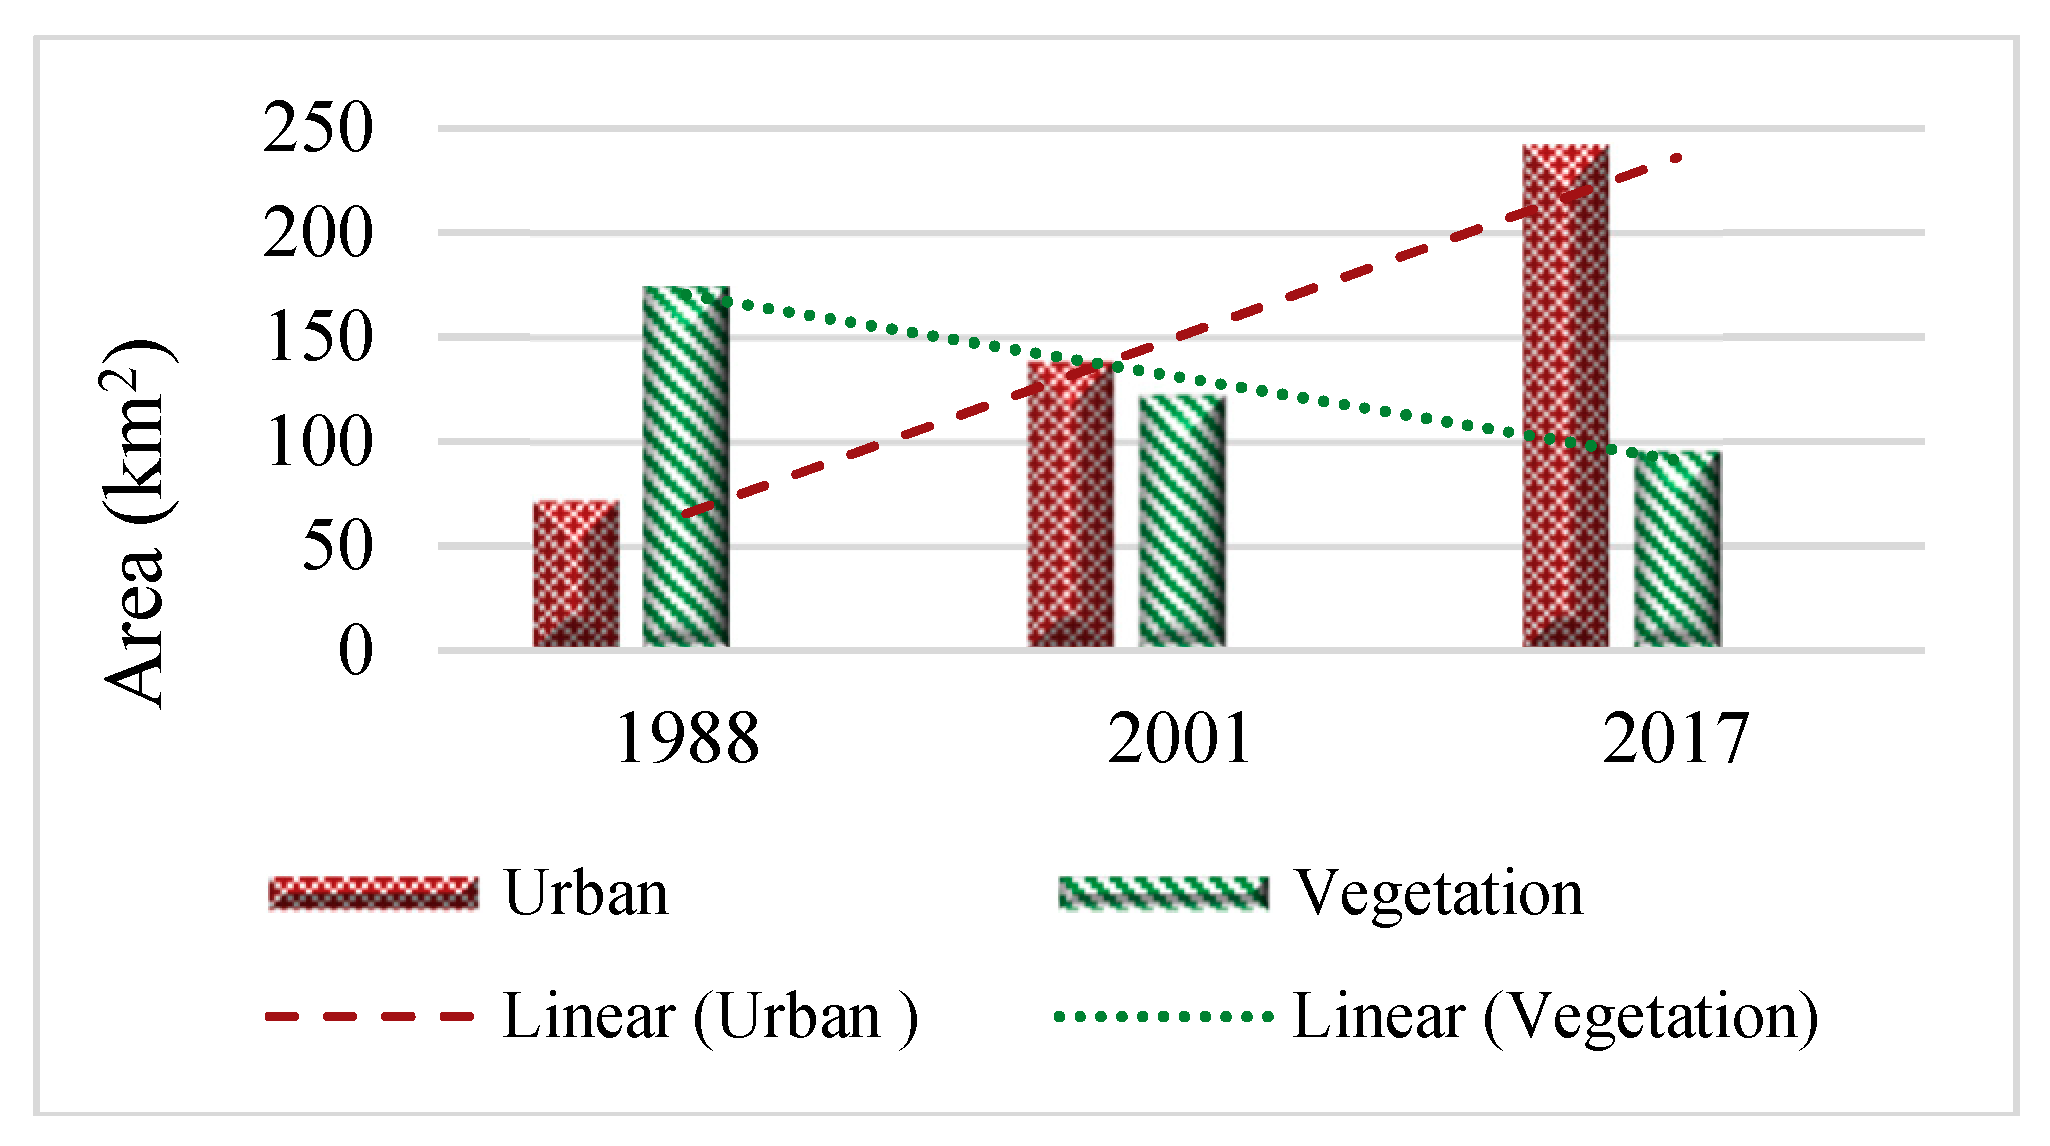
Spatial Distribution of the Constructed Areas and Vegetation Cover during the Period of Study
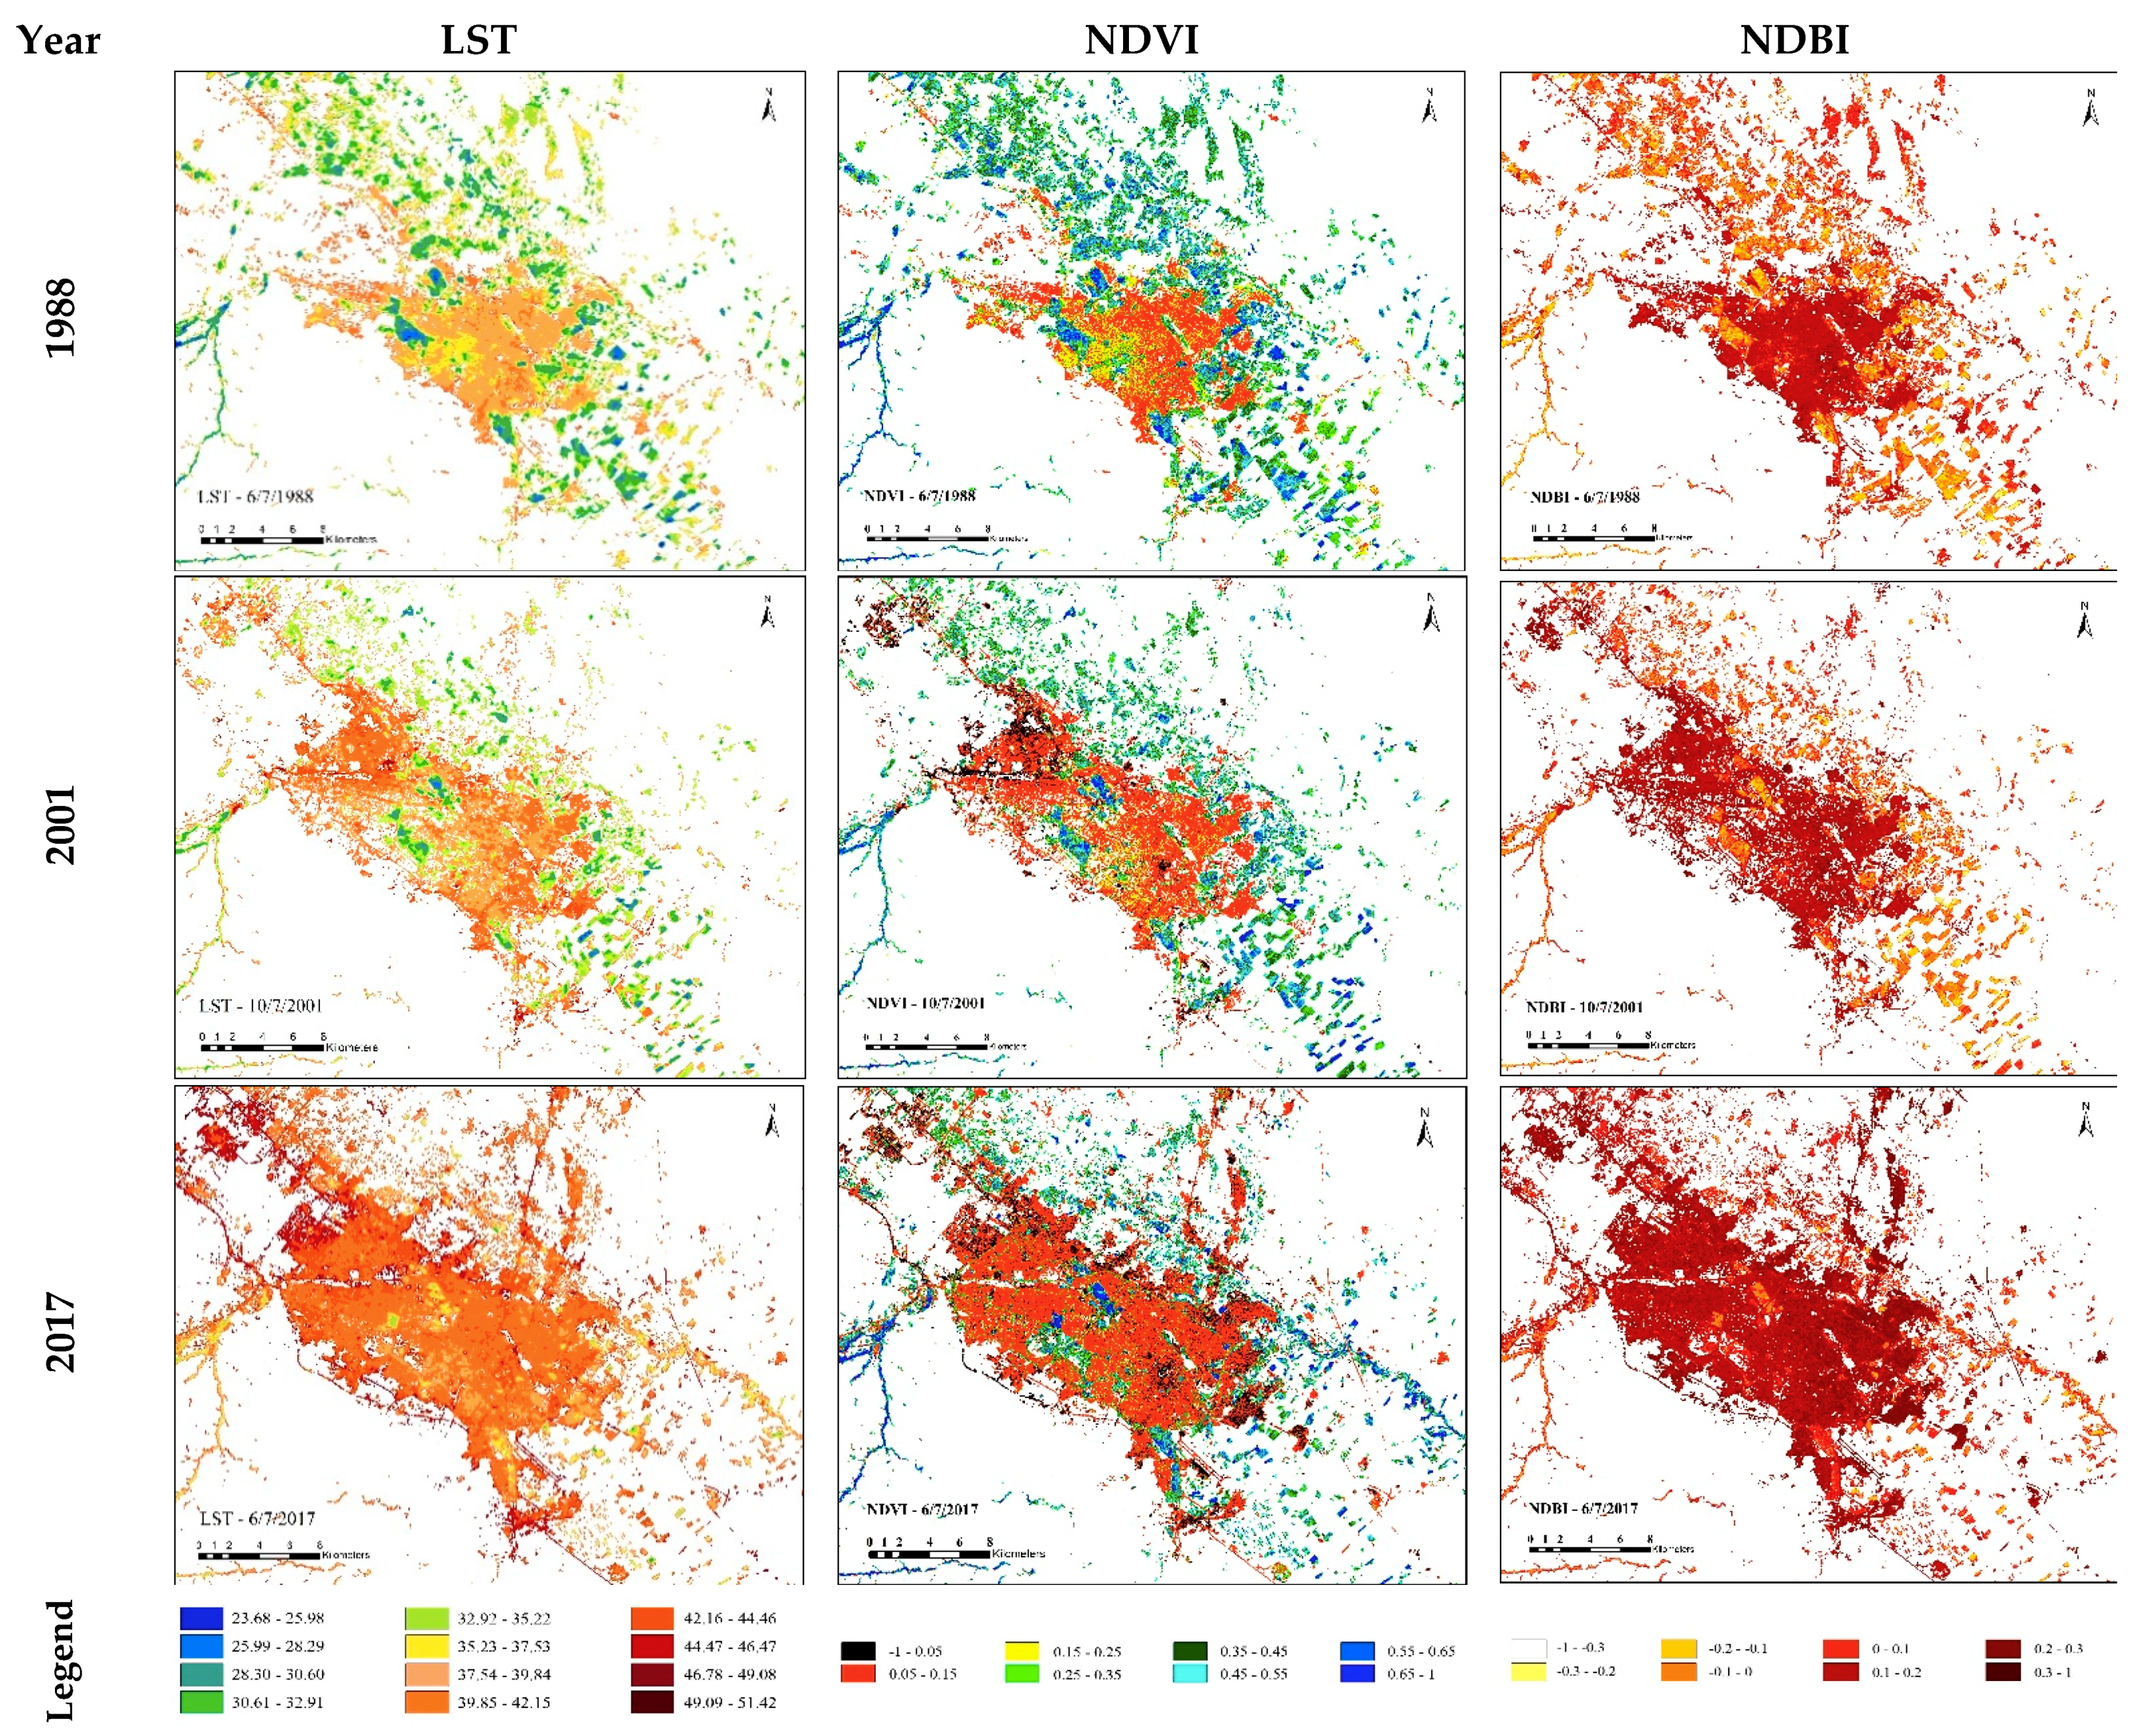
4.2. Spatial and Temporal Distribution of LST
4.3. Relationship between LST and LC Types
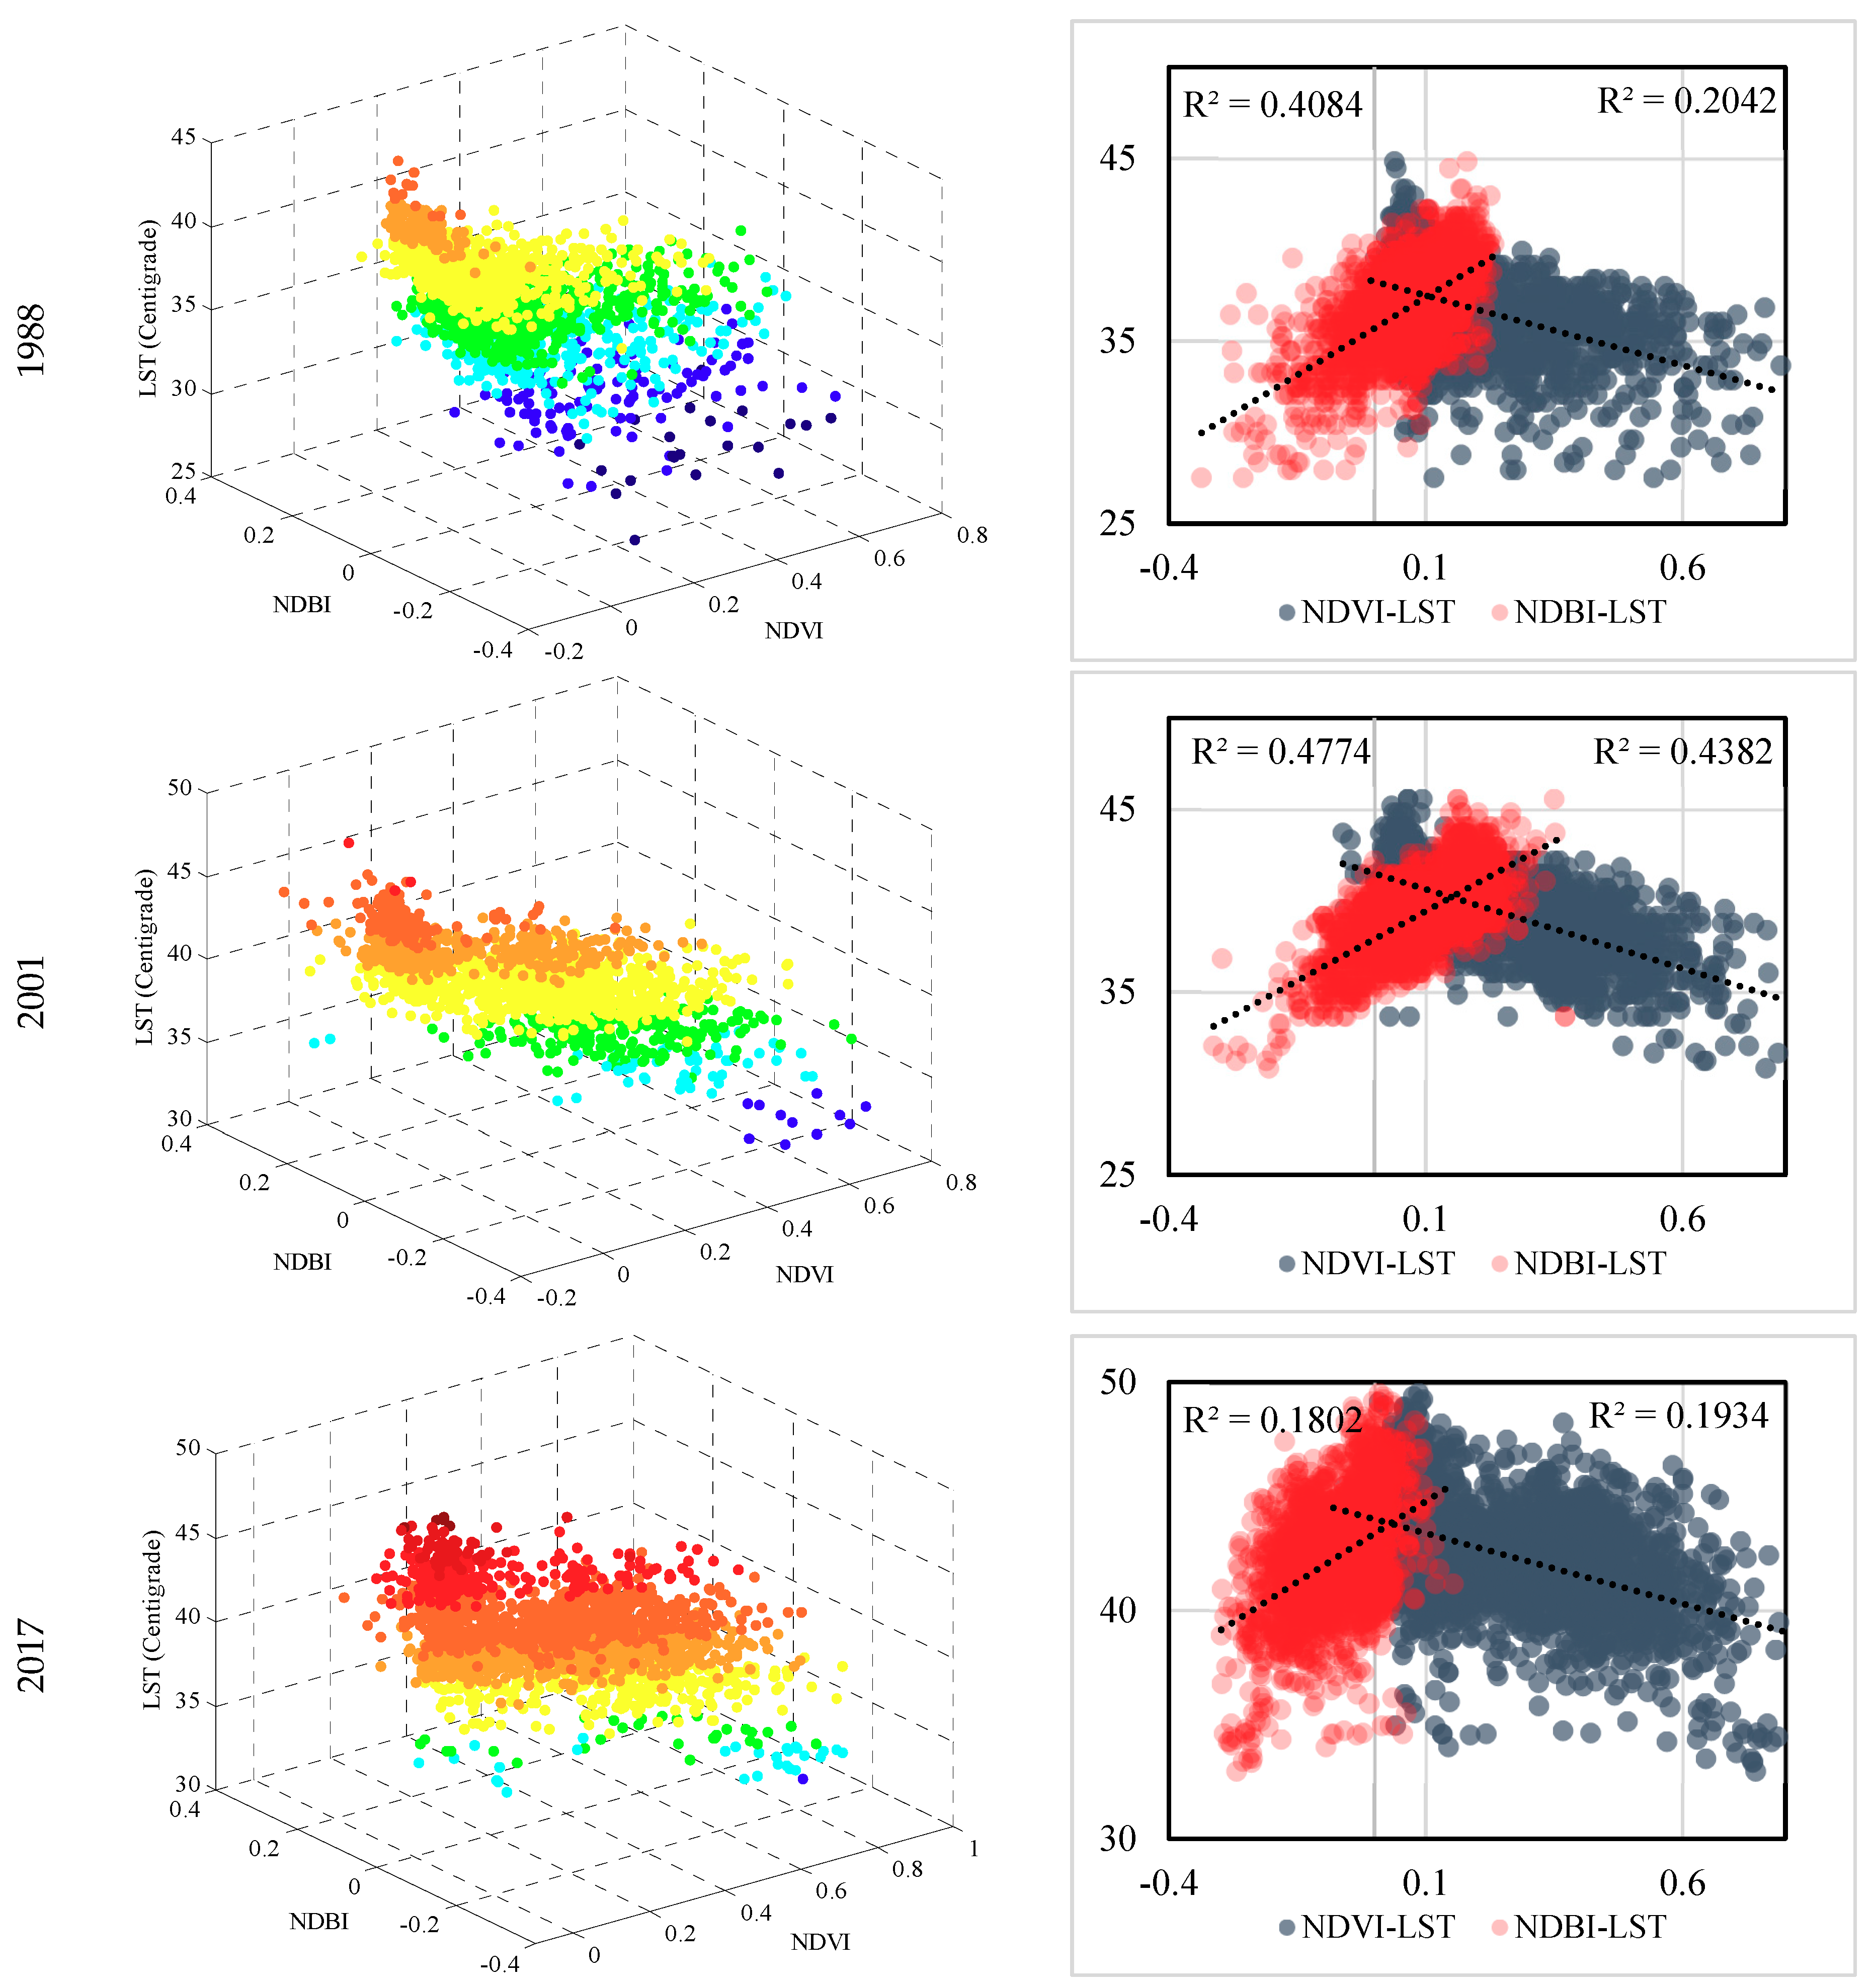
4.3.1. Relationship of LST-NDVI and LST-NDBI
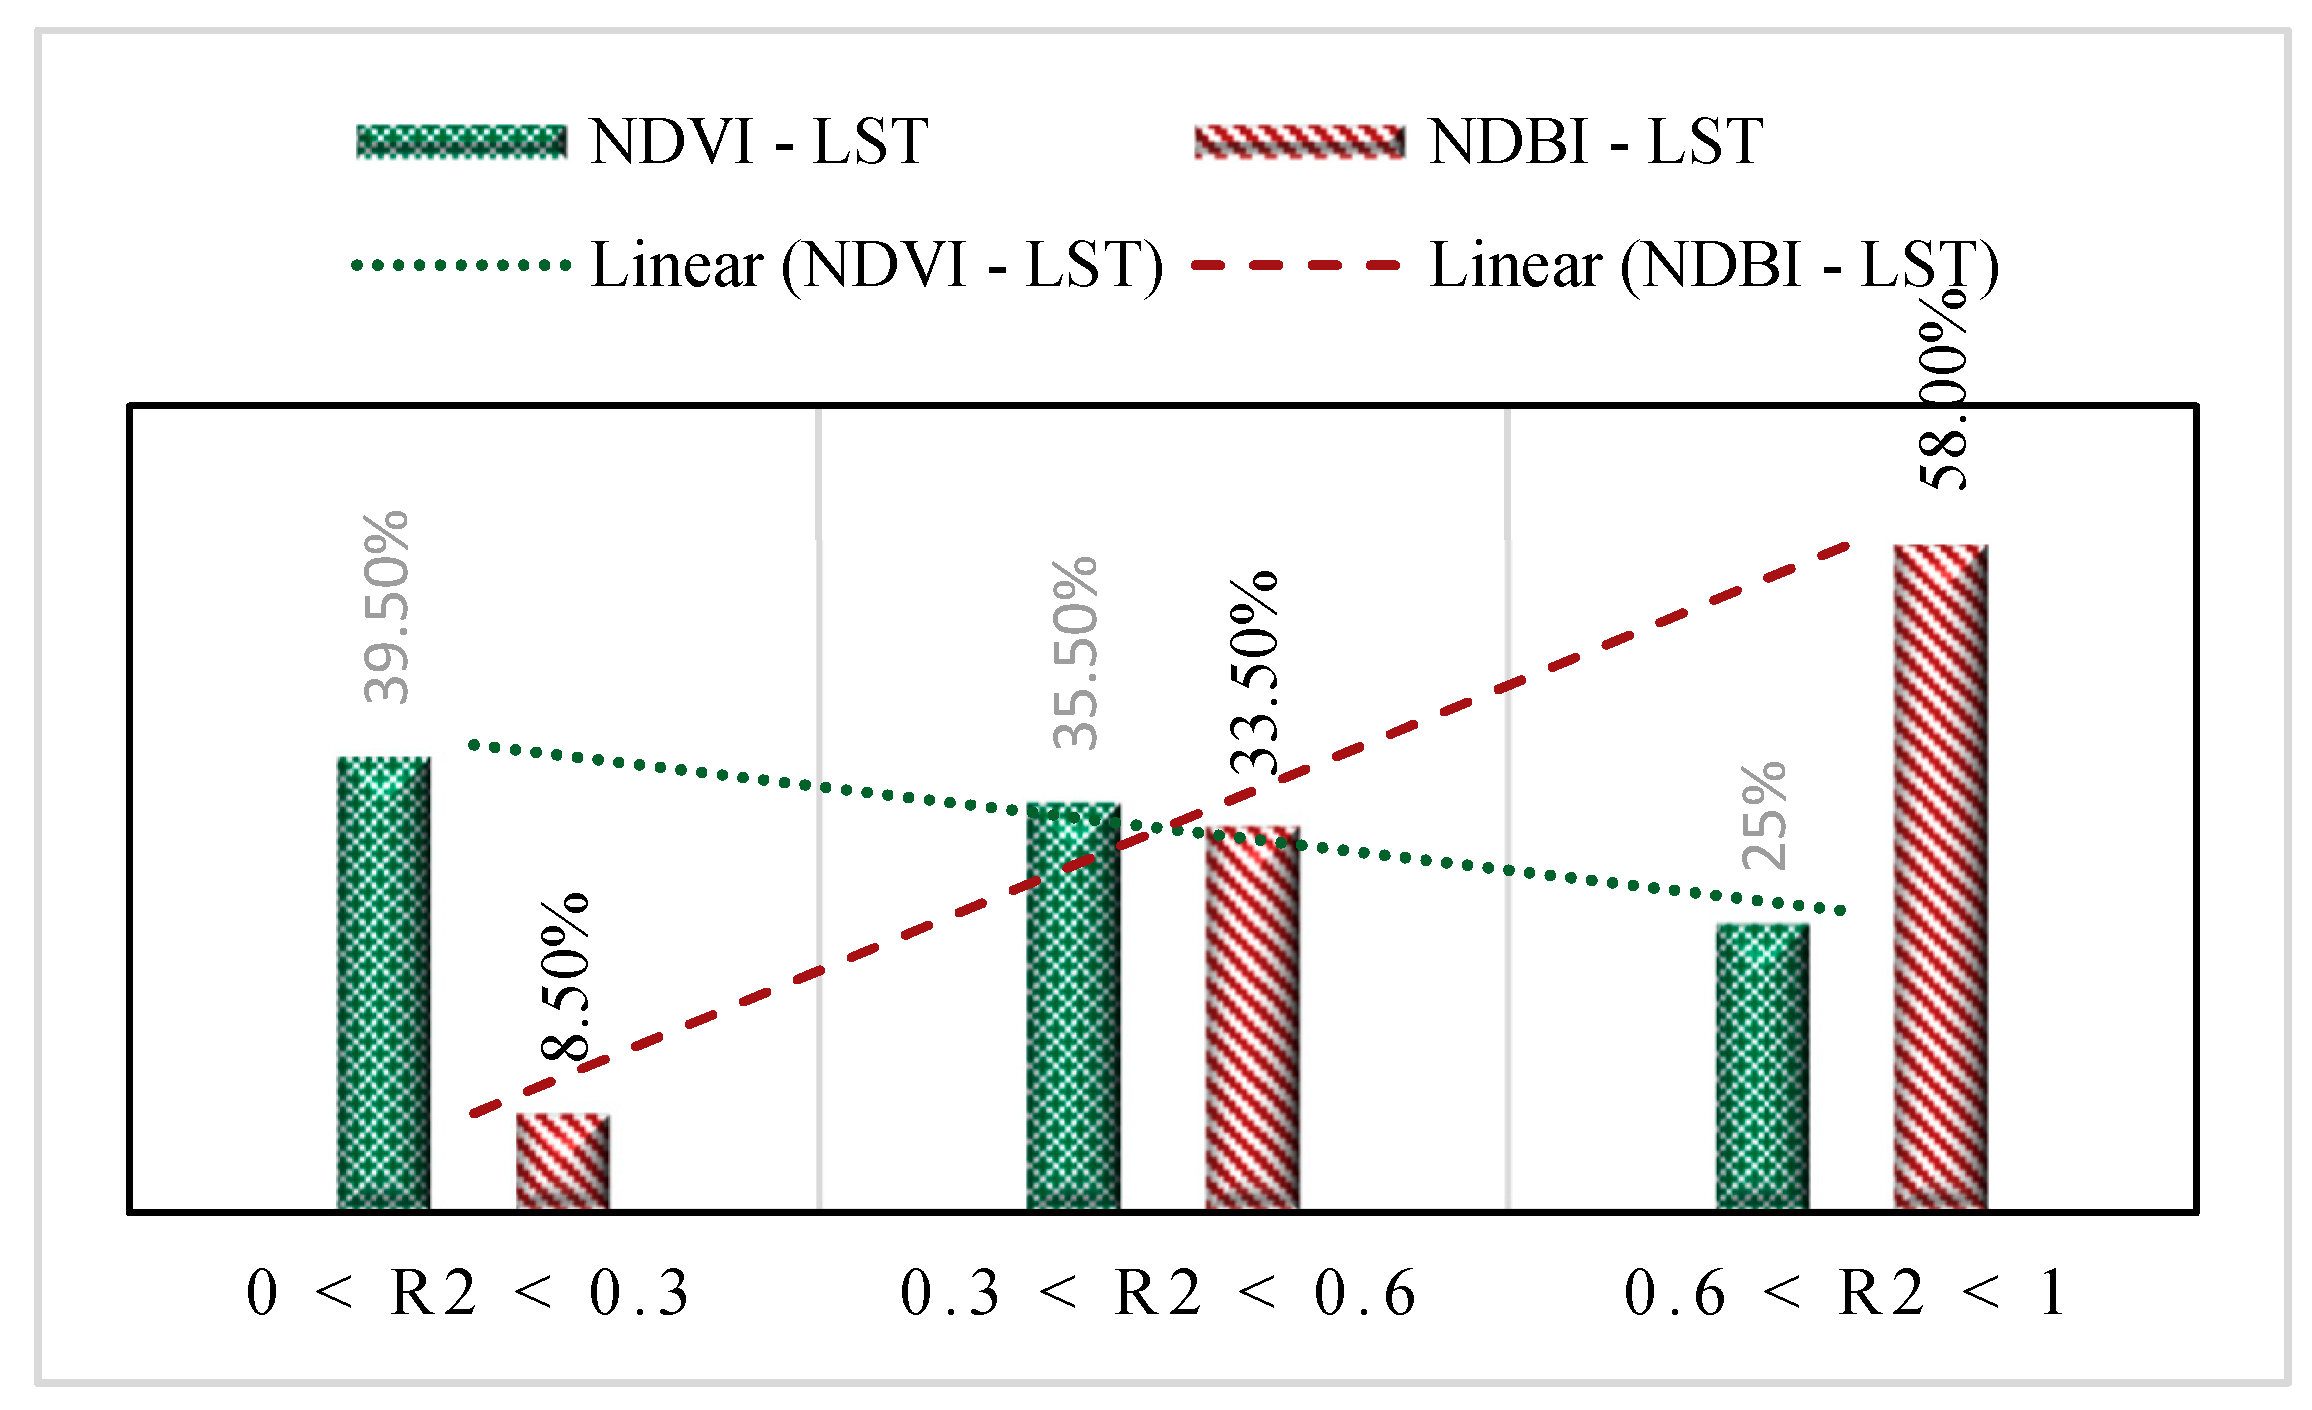
4.3.2. Correlation between LST, NDVI, and NDBI
4.4. Implication for Findings
5. Conclusions
Author Contributions
Funding
Conflicts of Interest
Abbreviations
| UHI | Urban Heat Island |
| UHII | Urban Heat Island Intensity |
| SUHII | Surface Urban Heat Island Intensity |
| LULC | Land Use/Land Cover |
| LST | Land Surface Temperature |
| UCL | Urban Canopy Layer |
| DN | Digital Number |
| LC | Land Cover |
| NDVI | Normalized Difference Vegetation Index |
| NDBI | Normalized Difference Built-Up Index |
References
- Wong, N.H.; Yu, C. Study of green areas and urban heat island in a tropical city. Habitat Int. 2005, 29, 547–558. [Google Scholar] [CrossRef]
- Oke, T.R. City size and the urban heat island. Atmos. Environ. (1967) 1973, 7, 769–779. [Google Scholar] [CrossRef]
- Wamsler, C.; Brink, E.; Rivera, C. Planning for climate change in urban areas: From theory to practice. J. Clean. Prod. 2013, 50, 68–81. [Google Scholar] [CrossRef]
- Streutker, D.R. Satellite-measured growth of the urban heat island of Houston, Texas. Remote Sens. Environ. 2003, 85, 282–289. [Google Scholar] [CrossRef]
- Chen, X.-L.; Zhao, H.-M.; Li, P.-X.; Yin, Z.-Y. Remote sensing image-based analysis of the relationship between urban heat island and land use/cover changes. Remote Sens. Environ. 2006, 104, 133–146. [Google Scholar] [CrossRef]
- Silva, J.S.; da Silva, R.M.; Santos, C.A.G. Spatiotemporal impact of land use/land cover changes on urban heat islands: A case study of Paço do Lumiar, Brazil. Build. Environ. 2018, 136, 279–292. [Google Scholar] [CrossRef]
- Shojaei, P.; Gheysari, M.; Myers, B.; Eslamian, S.; Shafieiyoun, E.; Esmaeili, H. Effect of different land cover/use types on canopy layer air temperature in an urban area with a dry climate. Build. Environ. 2017, 125, 451–463. [Google Scholar] [CrossRef]
- Li, H.; Meier, F.; Lee, X.; Chakraborty, T.; Liu, J.; Schaap, M.; Sodoudi, S. Interaction between urban heat island and urban pollution island during summer in Berlin. Sci. Total Environ. 2018, 636, 818–828. [Google Scholar] [CrossRef]
- Rajagopalan, P.; Lim, K.C.; Jamei, E. Urban heat island and wind flow characteristics of a tropical city. Sol. Energy 2014, 107, 159–170. [Google Scholar] [CrossRef]
- Morais, M.; Freitas, E.; Marciotto, E.; Urbina Guerrero, V.; Martins, L.; Martins, J. Implementation of Observed Sky-View Factor in a Mesoscale Model for Sensitivity Studies of the Urban Meteorology. Sustainability 2018, 10, 2183. [Google Scholar] [CrossRef]
- Zhou, W.; Qian, Y.; Li, X.; Li, W.; Han, L. Relationships between land cover and the surface urban heat island: Seasonal variability and effects of spatial and thematic resolution of land cover data on predicting land surface temperatures. Landsc. Ecol. 2014, 29, 153–167. [Google Scholar] [CrossRef]
- Tran, H.; Uchihama, D.; Ochi, S.; Yasuoka, Y. Assessment with satellite data of the urban heat island effects in Asian mega cities. Int. J. Appl. Earth Observ. Geoinf. 2006, 8, 34–48. [Google Scholar] [CrossRef]
- Balling, R.C.; Brazel, S.W. High-resolution surface temperature patterns in a complex urban terrain. Photogramm. Eng. Remote Sens. 1988, 54, 1289–1293. [Google Scholar]
- Gallo, K.; McNab, A.; Karl, T.R.; Brown, J.; Hood, J.; Tarpley, J. The use of NOAA AVHRR data for assessment of the urban heat island effect. J. Appl. Meteorol. 1993, 32, 899–908. [Google Scholar] [CrossRef]
- Kidder, S.Q.; Wu, H.-T. A multispectral study of the St. Louis area under snow-covered conditions using NOAA-7 AVHRR data. Remote Sens. Environ. 1987, 22, 159–172. [Google Scholar] [CrossRef]
- Carnahan, W.H.; Larson, R.C. An analysis of an urban heat sink. Remote Sens. Environ. 1990, 33, 65–71. [Google Scholar] [CrossRef]
- Nichol, J.E. A GIS-based approach to microclimate monitoring in Singapore’s high-rise housing estates. Photogramm. Eng. Remote Sens. 1994, 60, 1225–1232. [Google Scholar]
- Weng, Q. A remote sensing-GIS evaluation of urban expansion and its impact on surface temperature in the Zhujiang Delta, China. Int. J. Remote Sens. 2001, 22, 1999–2014. [Google Scholar] [CrossRef]
- Li, Y.-Y.; Zhang, H.; Kainz, W. Monitoring patterns of urban heat islands of the fast-growing Shanghai metropolis, China: Using time-series of Landsat TM/ETM+ data. Int. J. Appl. Earth Observ. Geoinf. 2012, 19, 127–138. [Google Scholar] [CrossRef]
- Stathopoulou, M.; Cartalis, C. Daytime urban heat islands from Landsat ETM+ and Corine land cover data: An application to major cities in Greece. Sol. Energy 2007, 81, 358–368. [Google Scholar] [CrossRef]
- Weng, Q.; Lu, D.; Schubring, J. Estimation of land surface temperature–vegetation abundance relationship for urban heat island studies. Remote Sens. Environ. 2004, 89, 467–483. [Google Scholar] [CrossRef]
- Kim, Y.-H.; Baik, J.-J. Spatial and temporal structure of the urban heat island in Seoul. J. Appl. Meteorol. 2005, 44, 591–605. [Google Scholar] [CrossRef]
- Jusuf, S.K.; Wong, N.H.; Hagen, E.; Anggoro, R.; Hong, Y. The influence of land use on the urban heat island in Singapore. Habitat Int. 2007, 31, 232–242. [Google Scholar] [CrossRef]
- Li, J.-J.; Wang, X.-R.; Wang, X.-J.; Ma, W.-C.; Zhang, H. Remote sensing evaluation of urban heat island and its spatial pattern of the Shanghai metropolitan area, China. Ecol. Complex. 2009, 6, 413–420. [Google Scholar] [CrossRef]
- Tan, K.C.; San Lim, H.; MatJafri, M.Z.; Abdullah, K. Landsat data to evaluate urban expansion and determine land use/land cover changes in Penang Island, Malaysia. Environ. Earth Sci. 2010, 60, 1509–1521. [Google Scholar] [CrossRef]
- Peng, S.; Piao, S.; Ciais, P.; Friedlingstein, P.; Ottle, C.; Bréon, F.-M.; Nan, H.; Zhou, L.; Myneni, R.B. Surface urban heat island across 419 global big cities. Environ. Sci. Technol. 2011, 46, 696–703. [Google Scholar] [CrossRef]
- Connors, J.P.; Galletti, C.S.; Chow, W.T. Landscape configuration and urban heat island effects: Assessing the relationship between landscape characteristics and land surface temperature in Phoenix, Arizona. Landsc. Ecol. 2013, 28, 271–283. [Google Scholar] [CrossRef]
- Fathian, F.; Prasad, A.; Dehghan, Z.; Eslamian, S. Influence of land use/land cover change on land surface temperature using RS and GIS techniques. Int. J. Hydrol. Sci. Technol. 2015, 5, 195–207. [Google Scholar] [CrossRef]
- Amanollahi, J.; Tzanis, C.; Ramli, M.F.; Abdullah, A.M. Urban heat evolution in a tropical area utilizing Landsat imagery. Atmos. Res. 2016, 167, 175–182. [Google Scholar] [CrossRef]
- Singh, P.; Kikon, N.; Verma, P. Impact of land use change and urbanization on urban heat island in Lucknow city, Central India. A remote sensing based estimate. Sustain. Cities Soc. 2017, 32, 100–114. [Google Scholar] [CrossRef]
- Tran, D.X.; Pla, F.; Latorre-Carmona, P.; Myint, S.W.; Caetano, M.; Kieu, H.V. Characterizing the relationship between land use land cover change and land surface temperature. ISPRS J. Photogramm. Remote Sens. 2017, 124, 119–132. [Google Scholar] [CrossRef] [Green Version]
- Sultana, S.; Satyanarayana, A. Urban heat island intensity during winter over metropolitan cities of India using remote-sensing techniques: Impact of urbanization. Int. J. Remote Sens. 2018, 1–39. [Google Scholar] [CrossRef]
- Aboelnour, M.; Engel, B.A. Application of Remote Sensing Techniques and Geographic Information Systems to Analyze Land Surface Temperature in Response to Land Use/Land Cover Change in Greater Cairo Region, Egypt. J. Geogr. Inf. Syst. 2018, 10, 57. [Google Scholar] [CrossRef]
- Bazargan, M. A Case Study on Accessibility of Medical and Healthcare Facilities in Mashhad using GIS. Stud. Arch. Urban. Environ. Sci. J. 2018, 1, 39–48. [Google Scholar] [CrossRef]
- Statistical Center of Iran. Available online: http://www.amar.org.ir (accessed on 11 December 2018).
- Azari, K.A.; Arintono, S.; Hamid, H.; Davoodi, S.R. Evaluation of demand for different trip purposes under various congestion pricing scenarios. J. Transp. Geogr. 2013, 29, 43–51. [Google Scholar] [CrossRef] [Green Version]
- Mansouri, B.; Salehi, J.; Rezaei, M. Leachate and pollution levels of heavy metals in the groundwater near municipal solid waste landfill site of Mashhad, Iran. Iran. J. Toxicol. 2014, 8, 1068–1072. [Google Scholar]
- Abbaspour-Fard, M.H.; Gholami, A.; Khojastehpour, M. Evaluation of an earth-to-air heat exchanger for the north-east of Iran with semi-arid climate. Int. J. Green Energy 2011, 8, 499–510. [Google Scholar] [CrossRef]
- Qu, L.; Cong, P.; Liang, S.; Suo, A. Remotely sensed retrieval of chlorophyll a concentration near Xiangshan sea area in Zhejiang Province with satellite HJ-1. In Proceedings of the 2015 IEEE International Geoscience and Remote Sensing Symposium (IGARSS), Milan, Italy, 26–31 July 2015; pp. 2198–2201. [Google Scholar] [CrossRef]
- Artis, D.A.; Carnahan, W.H. Survey of emissivity variability in thermography of urban areas. Remote Sens. Environ. 1982, 12, 313–329. [Google Scholar] [CrossRef]
- Chander, G.; Markham, B. Revised Landsat-5 TM radiometric calibration procedures and postcalibration dynamic ranges. IEEE Trans. Geosci. Remote Sens. 2003, 41, 2674–2677. [Google Scholar] [CrossRef]
- Sobrino, J.A.; Jiménez-Muñoz, J.C.; Paolini, L. Land surface temperature retrieval from LANDSAT TM 5. Remote Sens. Environ. 2004, 90, 434–440. [Google Scholar] [CrossRef]
- Guha, S.; Govil, H.; Dey, A.; Gill, N. Analytical study of land surface temperature with NDVI and NDBI using Landsat 8 OLI and TIRS data in Florence and Naples city, Italy. Eur. J. Remote Sens. 2018, 51, 667–678. [Google Scholar] [CrossRef]
- Zhang, Y.; Odeh, I.O.; Han, C. Bi-temporal characterization of land surface temperature in relation to impervious surface area, NDVI and NDBI, using a sub-pixel image analysis. Int. J. Appl. Earth Observ. Geoinf. 2009, 11, 256–264. [Google Scholar] [CrossRef]
- Mwangi, P.W.; Karanja, F.N.; Kamau, P.K. Analysis of the Relationship between Land Surface Temperature and Vegetation and Built-Up Indices in Upper-Hill, Nairobi. J. Geosci. Environ. Prot. 2018, 6, 1. [Google Scholar] [CrossRef]
- Sun, Q.; Wu, Z.; Tan, J. The relationship between land surface temperature and land use/land cover in Guangzhou, China. Environ. Earth Sci. 2012, 65, 1687–1694. [Google Scholar] [CrossRef]
- Santamouris, M. Using cool pavements as a mitigation strategy to fight urban heat island—A review of the actual developments. Renew. Sustain. Energy Rev. 2013, 26, 224–240. [Google Scholar] [CrossRef]
- Yuan, F.; Bauer, M.E. Comparison of impervious surface area and normalized difference vegetation index as indicators of surface urban heat island effects in Landsat imagery. Remote Sens. Environ. 2007, 106, 375–386. [Google Scholar] [CrossRef]
- Wu, H.; Ye, L.-P.; Shi, W.-Z.; Clarke, K.C. Assessing the effects of land use spatial structure on urban heat islands using HJ-1B remote sensing imagery in Wuhan, China. Int. J. Appl. Earth Observ. Geoinf. 2014, 32, 67–78. [Google Scholar] [CrossRef]
- Peng, J.; Jia, J.; Liu, Y.; Li, H.; Wu, J. Seasonal contrast of the dominant factors for spatial distribution of land surface temperature in urban areas. Remote Sens. Environ. 2018, 215, 255–267. [Google Scholar] [CrossRef]
- Sharma, R.; Ghosh, A.; Joshi, P.K. Spatio-temporal footprints of urbanisation in Surat, the Diamond City of India (1990–2009). Environ. Monit. Assess. 2013, 185, 3313–3325. [Google Scholar] [CrossRef]
- Peel, M.C.; Finlayson, B.L.; McMahon, T.A. Updated world map of the Köppen-Geiger climate classification. Hydrol. Earth Syst. Sci. Discuss. 2007, 4, 439–473. [Google Scholar] [CrossRef]
- Grover, A.; Singh, R.B. Analysis of urban heat island (UHI) in relation to normalized difference vegetation index (NDVI): A comparative study of Delhi and Mumbai. Environments 2015, 2, 125–138. [Google Scholar] [CrossRef]
- Mathew, A.; Khandelwal, S.; Kaul, N. Spatio-temporal variations of surface temperatures of Ahmedabad city and its relationship with vegetation and urbanization parameters as indicators of surface temperatures. Remote Sens. Appl. Soc. Environ. 2018. [Google Scholar] [CrossRef]
- Grover, A.; Singh, R. Monitoring Spatial patterns of Land Surface Temperature and urban heat island for sustainable megacity: A case study of Mumbai, India, using Landsat TM data. Environ. Urban. ASIA 2016, 7, 38–54. [Google Scholar] [CrossRef]
- Bakar, S.B.A.; Pradhan, B.; Lay, U.S.; Abdullahi, S. Spatial assessment of land surface temperature and land use/land cover in Langkawi Island. In Proceedings of the IOP Conference Series: Earth and Environmental Science, Kuala lumpur, Malaysia, 13–14 April 2016; p. 012064. [Google Scholar] [CrossRef]
- Chayapong, P.; Dasananda, S. Urban heat island phenomenon in relation to land use/land cover in bangkok metropolitan administration area. Appl. Environ. Res. 2013, 35, 27–41. [Google Scholar]
- Narangarav, D.; Lin, C. Investigation of vegetation dynamics of Mongolia using time series of NDVI in response to temperature and precipitation. Mong. J. Biol. Sci. 2011, 9, 9–17. [Google Scholar]
- Zhang, F.; Tiyip, T.; Kung, H.; Johnson, V.C.; Maimaitiyiming, M.; Zhou, M.; Wang, J. Dynamics of land surface temperature (LST) in response to land use and land cover (LULC) changes in the Weigan and Kuqa river oasis, Xinjiang, China. Arabian J. Geosci. 2016, 9, 499. [Google Scholar] [CrossRef]
- Rasul, A.; Balzter, H.; Smith, C. Diurnal and seasonal variation of surface urban cool and heat islands in the semi-arid city of Erbil, Iraq. Climate 2016, 4, 42. [Google Scholar] [CrossRef]
- Liu, L.; Zhang, Y. Urban heat island analysis using the Landsat TM data and ASTER data: A case study in Hong Kong. Remote Sens. 2011, 3, 1535–1552. [Google Scholar] [CrossRef]
- Sun, C.; Wu, Z.; Lv, Z.; Wei, J. Spatial-Temporal Analysis of Land Surface Temperature and Its Interplay with Land Use Change. In Proceedings of the 2010 2nd International Conference on Information Engineering and Computer Science (ICIECS), Wuhan, China, 25–26 December 2010; pp. 1–4. [Google Scholar] [CrossRef]
- Xiong, Y.; Huang, S.; Chen, F.; Ye, H.; Wang, C.; Zhu, C. The impacts of rapid urbanization on the thermal environment: A remote sensing study of Guangzhou, South China. Remote Sens. 2012, 4, 2033–2056. [Google Scholar] [CrossRef]
- Kaplan, G.; Avdan, U.; Avdan, Z.Y. Urban Heat Island Analysis Using the Landsat 8 Satellite Data: A Case Study in Skopje, Macedonia. Proceedings 2018, 2, 358. [Google Scholar] [CrossRef]
- Wang, H.-B.; Li, L.-G.; Zhao, Z.-Q.; Zhao, X.-L.; Cai, F.; Li, D.-Q.; Xu, S.-L.; Jiang, P.; Lin, Y. Surface urban heat island variation on prevailing wind direction belt base on TM/ETM+ data in Shenyang, China. In Proceedings of the 2014 3rd International Workshop on Earth Observation and Remote Sensing Applications (EORSA), Changsha, China, 11–14 June 2014; pp. 71–75. [Google Scholar] [CrossRef]
- Alfraihat, R.; Mulugeta, G.; Gala, T. Ecological evaluation of urban heat island in Chicago City, USA. J. Atmos. Pollut. 2016, 4, 23–29. [Google Scholar]
- Leal Filho, W.; Icaza, L.E.; Neht, A.; Klavins, M.; Morgan, E.A. Coping with the impacts of urban heat islands. A literature based study on understanding urban heat vulnerability and the need for resilience in cities in a global climate change context. J. Clean. Prod. 2018, 171, 1140–1149. [Google Scholar] [CrossRef]
- Guhathakurta, S.; Gober, P. The impact of the Phoenix urban heat island on residential water use. J. Am. Plan. Assoc. 2007, 73, 317–329. [Google Scholar] [CrossRef]


| No. | Year | Author(s) | Data | Case Study | Study |
|---|---|---|---|---|---|
| 1 | 2003 | Streutker [4] | NOAA AVHRR | Houston, TX | The increase in the magnitude and mean area of UHI |
| Results |
| ||||
| 2 | 2004 | Weng et al. [21] | Landsat ETM+ | Indianapolis City, IN, USA | The LST-vegetation abundance relationship |
| Results |
| ||||
| 3 | 2005 | Tran et al. [12] | TERRA/MODISLandsat ETM+ | Eight Asian mega cities | The UHI effects and spatial patterns |
| Results |
| ||||
| 4 | 2005 | Chen et al. [5] | Landsat TM/ETM+ | Pearl River Delta, China | The relationship between LULC changes and UHI |
| Results |
| ||||
| 5 | 2005 | Kim and Baik [22] | Automatic Weather Stations | Seoul, Korea | Tempo-spatial UHI |
| Results |
| ||||
| 6 | 2006 | Stathopoulou and Cartalis [20] | Landsat ETM+Corine database | Major cities in Greece | Thermal environment during daytime and warm period |
| Results |
| ||||
| 7 | 2007 | Jusuf et al. [23] | Landsat ETM+ | Singapore | The relationship between different LULC and UHI |
| Results |
| ||||
| 8 | 2009 | Li et al. [24] | Landsat TM | Shanghai, China | Quantitative evaluation of UHI |
| Results |
| ||||
| 9 | 2010 | Tan et al. [25] | Landsat TM/ETM+ | Penang Island, Malaysia | The changes in LULC |
| Results |
| ||||
| 10 | 2011 | Peng et al. [26] | MODIS Data | Global big cities | The differences in surface UHI intensity and potentially affecting biophysical and socio-economic driving factors |
| Results |
| ||||
| 11 | 2012 | Li et al. [19] | Landsat TM/ETM+ | Shanghai, China | Time series of LULC maps and patterns of UHIs |
| Results |
| ||||
| 12 | 2012 | Connors et al. [27] | ASTER | Phoenix, Arizona, USA | The effects of the spatial patterns of land covers on UHI |
| Results |
| ||||
| 13 | 2014 | Zhou et al. [11] | Landsat ETM+ | Gwynns Falls watershed, Maryland, USA | The relationships between LST and LULC variables in different seasons |
| Results |
| ||||
| 14 | 2015 | Fathian et al. [28] | Landsat TM/ETM+ | Urmia Lake basin, Iran | The relationship between LST and LULC |
| Results |
| ||||
| 15 | 2016 | Amanollahi et al. [29] | Landsat TM/ETM+ | Malaysia | The effects of LULC changes on the UHI |
| Results |
| ||||
| 16 | 2017 | Singh et al. [30] | Landsat TM/OLI | Lucknow City, Central India | The changes in land use and the impact on UHI |
| Results |
| ||||
| 17 | 2017 | Tran et al. [31] | Landsat TM/ETM+/OLI | Inner city area of Hanoi, Viet Nam | The relationship between LST and vegetation, man-made features, and cropland |
| Results |
| ||||
| 18 | 2018 | Sultana and Satyanarayana [32] | Landsat ETM+ | 10 major metropolitan cities of India | The relationship between LULC changes and LST |
| Results |
| ||||
| 19 | 2018 | Aboelnour and Engel [33] | Landsat TM/OLI/TIRS | Greater Cairo Region, Egypt | The urban sprawl with respect to LST |
| Results |
| ||||
| 20 | 2018 | Silva et al. [6] | Landsat TM/OLI | Paço do Lumiar, Brazil | The influence of vegetation cover and fragmentation on the urban environment |
| Results |
| ||||
| Date of Image | DSA * | Sensor | Flight Time (GMT) | Tma (°C) | Cloud Cover (%) |
|---|---|---|---|---|---|
| 6 July 1988 | 188 | TM | 06:07:52 | 27.4 | 0.00 |
| 10 July 2001 | 191 | TM | 06:17:36 | 27.7 | 0.00 |
| 6 July 2017 | 187 | OLI | 06:36:59 | 29 | 0.00 |
| Year | Overall Accuracy | Kappa Coefficient |
|---|---|---|
| 1988 | 94% | 0.88 |
| 2001 | 97% | 0.96 |
| 2017 | 98% | 0.87 |
| Year | Urban (km2) | Vegetation (km2) | Soil (km2) | |||
|---|---|---|---|---|---|---|
| 1988 | 71.55 | 5.11% | 174.36 | 12.45% | 1153.90 | 82.43% |
| 2001 | 138.01 | 9.85% | 122.02 | 8.71% | 1139.77 | 81.42% |
| 2017 | 242.14 | 17.29% | 95.18 | 6.80% | 1062.48 | 75.90% |
| Year | LST | NDVI | NDBI | ||||||
|---|---|---|---|---|---|---|---|---|---|
| min | max | mean | min | max | mean | min | max | mean | |
| 1988 | 23.68274 | 46.66728 | 35.85415 | −0.02351 | 0.86358 | 0.32202 | −0.37117 | 0.40875 | 0.04971 |
| 2001 | 24.97311 | 48.84806 | 38.38122 | −0.14442 | 0.84903 | 0.24409 | −0.41739 | 0.51931 | 0.09307 |
| 2017 | 29.40610 | 51.41578 | 41.96666 | −0.88413 | 0.96426 | 0.21902 | −0.46967 | 0.32005 | −0.05193 |
| Year | R | R Square | Std. Error of the Estimate | Unstandardized Coefficient | Standardized Coefficient (Beta) |
|---|---|---|---|---|---|
| 1988 | 0.680 | 0.46 | 1.77 | Constant: 36.68 NDVI: −4.25 NDBI: 14.59 | NDVI: −0.25 NDBI: 0.55 |
| 2001 | 0.703 | 0.49 | 1.54 | Constant: 39.21 NDVI: −3.38 NDBI: 10.35 | NDVI: −0.26 NDBI: 0.47 |
| 2017 | 0.450 | 0.20 | 2.31 | Constant: 43.86 NDVI: −4.00 NDBI: 6.04 | NDVI: −0.29 NDBI: 0.18 |
| No. | Study Area | Climate | Date of Study | NDVI-LST | NDBI-LST | Reference | |
|---|---|---|---|---|---|---|---|
| 1 | Mumbai, India | Am | 2010 | profile (North) | R2 = 0.59 | R2 = 0.63 | [55] |
| Profile (Central) | R2 = 0.32 | R2 = 0.68 | |||||
| profile (south) | R2 = 0.46 | R2 = 0.61 | |||||
| N–S Profile | R2 = 0.35 | R2 = 0.30 | |||||
| 2 | Langkawi Island, Kedah, Malaysia | Am | 2002 | R2 = 0.15 | R2 = 0.81 | [56] | |
| 2015 | R2 = 0.5 | R2 = 0.84 | |||||
| 3 | Mumbai, India | Am | 2010 | R2 = 0.36 | - | [53] | |
| Delhi, India | BSh | 2010 | R2 = 0.06 | - | |||
| 4 | Bangkok Metropolitan Administration | Aw-As | 2008 | R2 = 0.41 | R2 = 0.73 | [57] | |
| 5 | Surat city | As-Aw | 1990 | R = −0.69 | R = 0.68 | [51] | |
| 2009 | R = −0.86 | R = 0.87 | |||||
| 6 (air temperature) | Sukhbaatar | BSk-Dwb | 2000–2009 | R2 = 0.79 | - | [58] | |
| Inget Tolgoi | BSk-Dwc | R2 = 0.97 | - | ||||
| Khutag-Undur | BSk-Dwb-Dwc | R2 = 0.84 | - | ||||
| Baruun-Urt | BSk | R2 = 0.78 | - | ||||
| Undurkhaan | BSk | R2 = 0.71 | - | ||||
| Khujirt | BSk | R2 = 0.91 | - | ||||
| Sainshand | BWk | R2 = 0.03 | - | ||||
| Mandalgobi | BWk | R2 = 0.5 | - | ||||
| Ehiingol | BWh | R2 = 0 | - | ||||
| Dalanzadgad | BWk | R2 = 0.02 | - | ||||
| 7 | Weigan and Kuqa river oasis, Xinjiang, China | BWk | 1989 | R2 = 0.51 | - | [59] | |
| 2011 | R2 = 0.76 | - | |||||
| 8 | Erbil, Iraq | Csa-BSh | 2003–2014 | R2 = 0.18 | - | [60] | |
| 9 | Florence | Csb | 2016 | R = −0.71 | R = 0.71 | [43] | |
| Naples | Csb | 2016 | R = −0.57 | R = 0.61 | |||
| 10 | Pearl River Delta | Cwa | 2000 | R2 > 0.98 | R2 > 0.98 | [5] | |
| 11 | shenzhen | Cwa | 2009–2010 | R2 > 0.72 | R2 > 0.51 | [50] | |
| 12 | Hong Kong | Cwa | 2005 | R = −0.41 | R = 0.71 | [61] | |
| 13 | Guangzhou, South China | Cwa-Cfa | 2000 | R2 = 0.05 | R2 = 0.78 | [62] | |
| 2008 | R2 = 0.01 | R2 = 0.71 | |||||
| 14 | Guangzhou, South China | Cwa, Cfa | 1990 | R2 = 0.37 | R2 = 0.53 | [63] | |
| 15 | Skopje, Macedonia | Cfa | 2013 | R = −0.63 | R = 0.67 | [64] | |
| 2017 | R = −0.59 | R = 0.64 | |||||
| 16 | Upper-hill, Nairobi | Cfa | 1987 | R2 = 0.26 | - | [45] | |
| 2002 | R2 = 0.49 | - | |||||
| 2015 | R2 = 0.48 | - | |||||
| 2017 | R2 = 0.16 | - | |||||
| 17 | Fuzhou City | Cfa or Csc | 1989 | R2 = 0.29 | R2 = 0.87 | [44] | |
| 2001 | R2 = 0.07 | R2 = 0.74 | |||||
| 18 | Wuhan City | Cfa or Csc | R2 = 0.79 | - | [49] | ||
| 19 | Shenyang, China | Dwa | 2001 | R = −0.07 | R = 0.91 | [65] | |
| 2010 | R = −0.85 | R = 0.91 | |||||
| 20 | Chicago City, USA | Dfa | 2010 | R = −0.34 | R = 0.26 | [66] | |
| 21 | Seven-county Twin Cities Metropolitan Area (TCMA) of Minnesota. | Dfb | 2002 | R2 = 0.09 | - | [48] | |
| 2002 | R2 = 0.05 | - | |||||
| 2000 | R2 = 0.02 | - | |||||
| 2001 | R2 = 0.11 | - | |||||
| 1st | 2nd | 3rd |
|---|---|---|
| A (Tropical) | f (Rainforest) | |
| m (Monsoon) | ||
| w (Savanna, Wet) | ||
| s (Savanna, Dry) | ||
| B (Arid) | W (Desert) | |
| S (Steppe) | ||
| h (Hot) | ||
| k (Cold) | ||
| C (Temperate) | s (Dry summer) | |
| w (Dry winter) | ||
| f (Without dry season) | ||
| a (Hot summer) | ||
| b (Warm summer) | ||
| c (Cold summer) | ||
| D (Cold (continental)) | s (Dry summer) | |
| w (Dry winter) | ||
| f (Without dry season) | ||
| a (Hot summer) | ||
| b (Warm summer) | ||
| c (Cold summer) | ||
| d (Very cold winter) |
© 2019 by the authors. Licensee MDPI, Basel, Switzerland. This article is an open access article distributed under the terms and conditions of the Creative Commons Attribution (CC BY) license (http://creativecommons.org/licenses/by/4.0/).
Share and Cite
Naserikia, M.; Asadi Shamsabadi, E.; Rafieian, M.; Leal Filho, W. The Urban Heat Island in an Urban Context: A Case Study of Mashhad, Iran. Int. J. Environ. Res. Public Health 2019, 16, 313. https://doi.org/10.3390/ijerph16030313
Naserikia M, Asadi Shamsabadi E, Rafieian M, Leal Filho W. The Urban Heat Island in an Urban Context: A Case Study of Mashhad, Iran. International Journal of Environmental Research and Public Health. 2019; 16(3):313. https://doi.org/10.3390/ijerph16030313
Chicago/Turabian StyleNaserikia, Marzie, Elyas Asadi Shamsabadi, Mojtaba Rafieian, and Walter Leal Filho. 2019. "The Urban Heat Island in an Urban Context: A Case Study of Mashhad, Iran" International Journal of Environmental Research and Public Health 16, no. 3: 313. https://doi.org/10.3390/ijerph16030313