Feasibility Study on Variable-Speed Air Conditioner under Hot Climate based on Real-Scale Experiment and Energy Simulation

1
Department of Architectural Engineering, Pusan National University, 2 Busandaehak-ro 63, Geomjeong-gu, Busan 46241, Korea
2
Korea Testing Laboratory, 87, Digital-ro, Guro-gu, Seoul 08389, Korea
3
Saudi Standards Metrology and Quality Organization, Al Imam Saud Ibn Abdul Aziz Road, Al Mohammadiyah, Riyadh 11471, Saudi Arabia
*
Author to whom correspondence should be addressed.
Energies 2019, 12(8), 1489; https://doi.org/10.3390/en12081489
Submission received: 19 March 2019
/
Revised: 14 April 2019
/
Accepted: 18 April 2019
/
Published: 19 April 2019
(This article belongs to the Section G: Energy and Buildings)
Abstract
:It is well known that inverter-driven variable-speed compressor (or inverter) air conditioners are more efficient than constant-speed compressor air conditioners. Therefore, most countries have employed part-load assessment test standards such as ISO 16358, EN 14825 and ASHRAE 116 in addition to the conventional ISO 5151 full-load test standard to appropriately evaluate the part-load efficiencies of variable-speed air conditioners. However, many countries in the Middle East and South America still use the ISO 5151 standard owing to policy or high- temperature environmental considerations. In this study, we experimentally verify the energy saving effect of the inverter air conditioner with respect to the constant-speed air conditioner under the Korean climate with distinct temperature changes of four seasons and under the hot climate of Saudi Arabia throughout the year. ISO 5151 defines test conditions for a single temperature, whereas ISO 16358, EN 14825 and ASHRAE 116 simulate seasonal efficiencies using interpolation of several climate test results. Herein, we directly employ the environmental changes during a day or season in a qualified test room with specific dimension. Using extensive regional and seasonal climate data for Saudi Arabia and South Korea, the changes in temperature conditions are applied directly to the outdoor side and appropriate building cooling load conditions are applied to the indoor side of the air-enthalpy-type test room. The energy savings of the inverter air conditioner were analyzed experimentally according to the spatial and temporal temperature changes. The energy reduction effects of the inverter air conditioner largely depended on the temperature and cooling load changes for a day or season. Furthermore, a feasibility study based on an energy simulation showed that the variable-speed air conditioner could be economical even in hot climates.
1. Introduction
Air conditioners are essential not only in “hot” countries such as Saudi Arabia but also in Korea. In Korea, air conditioners were luxury items until the 1980s, but gradually became popular since the 1990s. Nowadays, they are used in most homes owing to the increased temperatures in summer by climate changes. The energy labelling program of air conditioners started in 1992 in Korea, as energy resources were scarce and the demand for cooling energy in summer was a large portion of the total electricity demand. In particular, the peak power demand management in summer was a big concern every year.
Saudi Arabia is the world’s largest oil producer having approximately 20% of the world’s oil reserves. Despite the supply of electricity by the abundant oil resources, the Saudi government has been interested in energy conservation owing to the rapid industrialization and population increase in the 2000s. Saudi Arabia’s crude oil production is not expected to rapidly increase. In addition, the crude oil exports are expected to decrease with the increases in domestic demand. In this regard, Saudi Arabia has mandated the minimum energy efficiency performance standard for room air conditioners since 2013, as the autonomous Saudi Standards, Metrology, and Quality Organization (SASO) 2663/2007 standard has been amended to an enhanced compulsory SASO 2663/2012 standard [1].
The energy efficiency regulation of air-conditioners is applied in most countries, not only in these two countries. The definition of energy efficiency of an air conditioner is largely managed by two approaches based on the simple energy efficiency ratio (EER) by International Organization for Standardization (ISO) 5151 and seasonal EER (SEER) by ISO 16358, European (EN) 14825 and ASHRAE 116 [2,3,4,5]. Manufacturers have carried out extensive technological studies to improve the performances of air conditioners. One of the most notable approaches is the compressor technology. A compressor control technology has been developed, which could vary the speed of the compressor in response to a cooling load. It provides a high efficiency of the compressor such as a high efficiency of the compressor motor section, reduction in the mechanical friction of the rotating section, and reduction in the pressure loss of the refrigerant entering and exiting sections. The variable-speed compressor (or inverter compressor) can reduce the operation cost, compared to the constant-speed compressor. In this regard, we need to assess the efficiency of the air conditioner during a part-load operation.
Some countries in the Middle East and South America still prefer to use full-load evaluation methods as the ISO 5151 full-load test is simple and the hot climate in most the seasons requires full operation of the air conditioner. However, the winter period in Saudi Arabia does not require air conditioning; in addition, some months before and after the summer peak require a part-load operation.
Several studies compared performance differences between constant-speed and variable-speed air conditioners. Chen et al. [6] carried out a test in a specific-size real room with an operation start at a pre-heated temperature and evaluated the effects of the product temperature setting and space heat load. Yurtseven et al. [7] studied real office usage circumstances in a relatively long-term power input measurement. Al-tamimi et al. [8] analyzed the thermal performance and energy consumptions of air conditioner devices for two identical houses located in the Dhahran area of Saudi Arabia for one year. Khatri et al. [9] carried out a long-term field test to compare the energy savings of two types of air conditioners in two specific rooms in India. However, these studies did not analyze the performance differences under controlled temperature variations and building cooling load variations in accurately controlled test rooms.
In addition, the performances and economic efficiencies of the air conditioners have been investigated. Wu et al. [10] contributed to the variable air conditioner efficiency standard by monitoring the outdoor temperature distribution and operation time in China. Oropeza-Perez [11] analyzed the economic efficiencies based on several variables such as the set temperature of the air-conditioner in Mexico. Shah et al. [12] carried out a simple payback period analysis according to the efficiency and type of the air conditioner in India.
In this study, we analyze the energy saving effects of inverter and constant-speed air conditioners during the cooling periods in Saudi Arabia and South Korea. People usually think that no difference in energy efficiency between constant-speed and inverter-type air conditioners exists in countries with hot climates such as Saudi Arabia. However, few experimental studies based on dynamic energy simulations of variable air conditioners were carried out. In this study, dynamic energy simulation results are applied to a real-scale environmental test chamber. Using the test results, the energy consumptions are compared and the suitability of the constant and variable-speed air conditioners are analyzed. The energy usage of each air-conditioner under the laboratory environmental conditions is evaluated by simulating the climate of South Korea where the four seasons are evenly distributed and hot climate of Saudi Arabia throughout the year.
2. Materials and Methods
2.1. Summary of the Experimental Approach
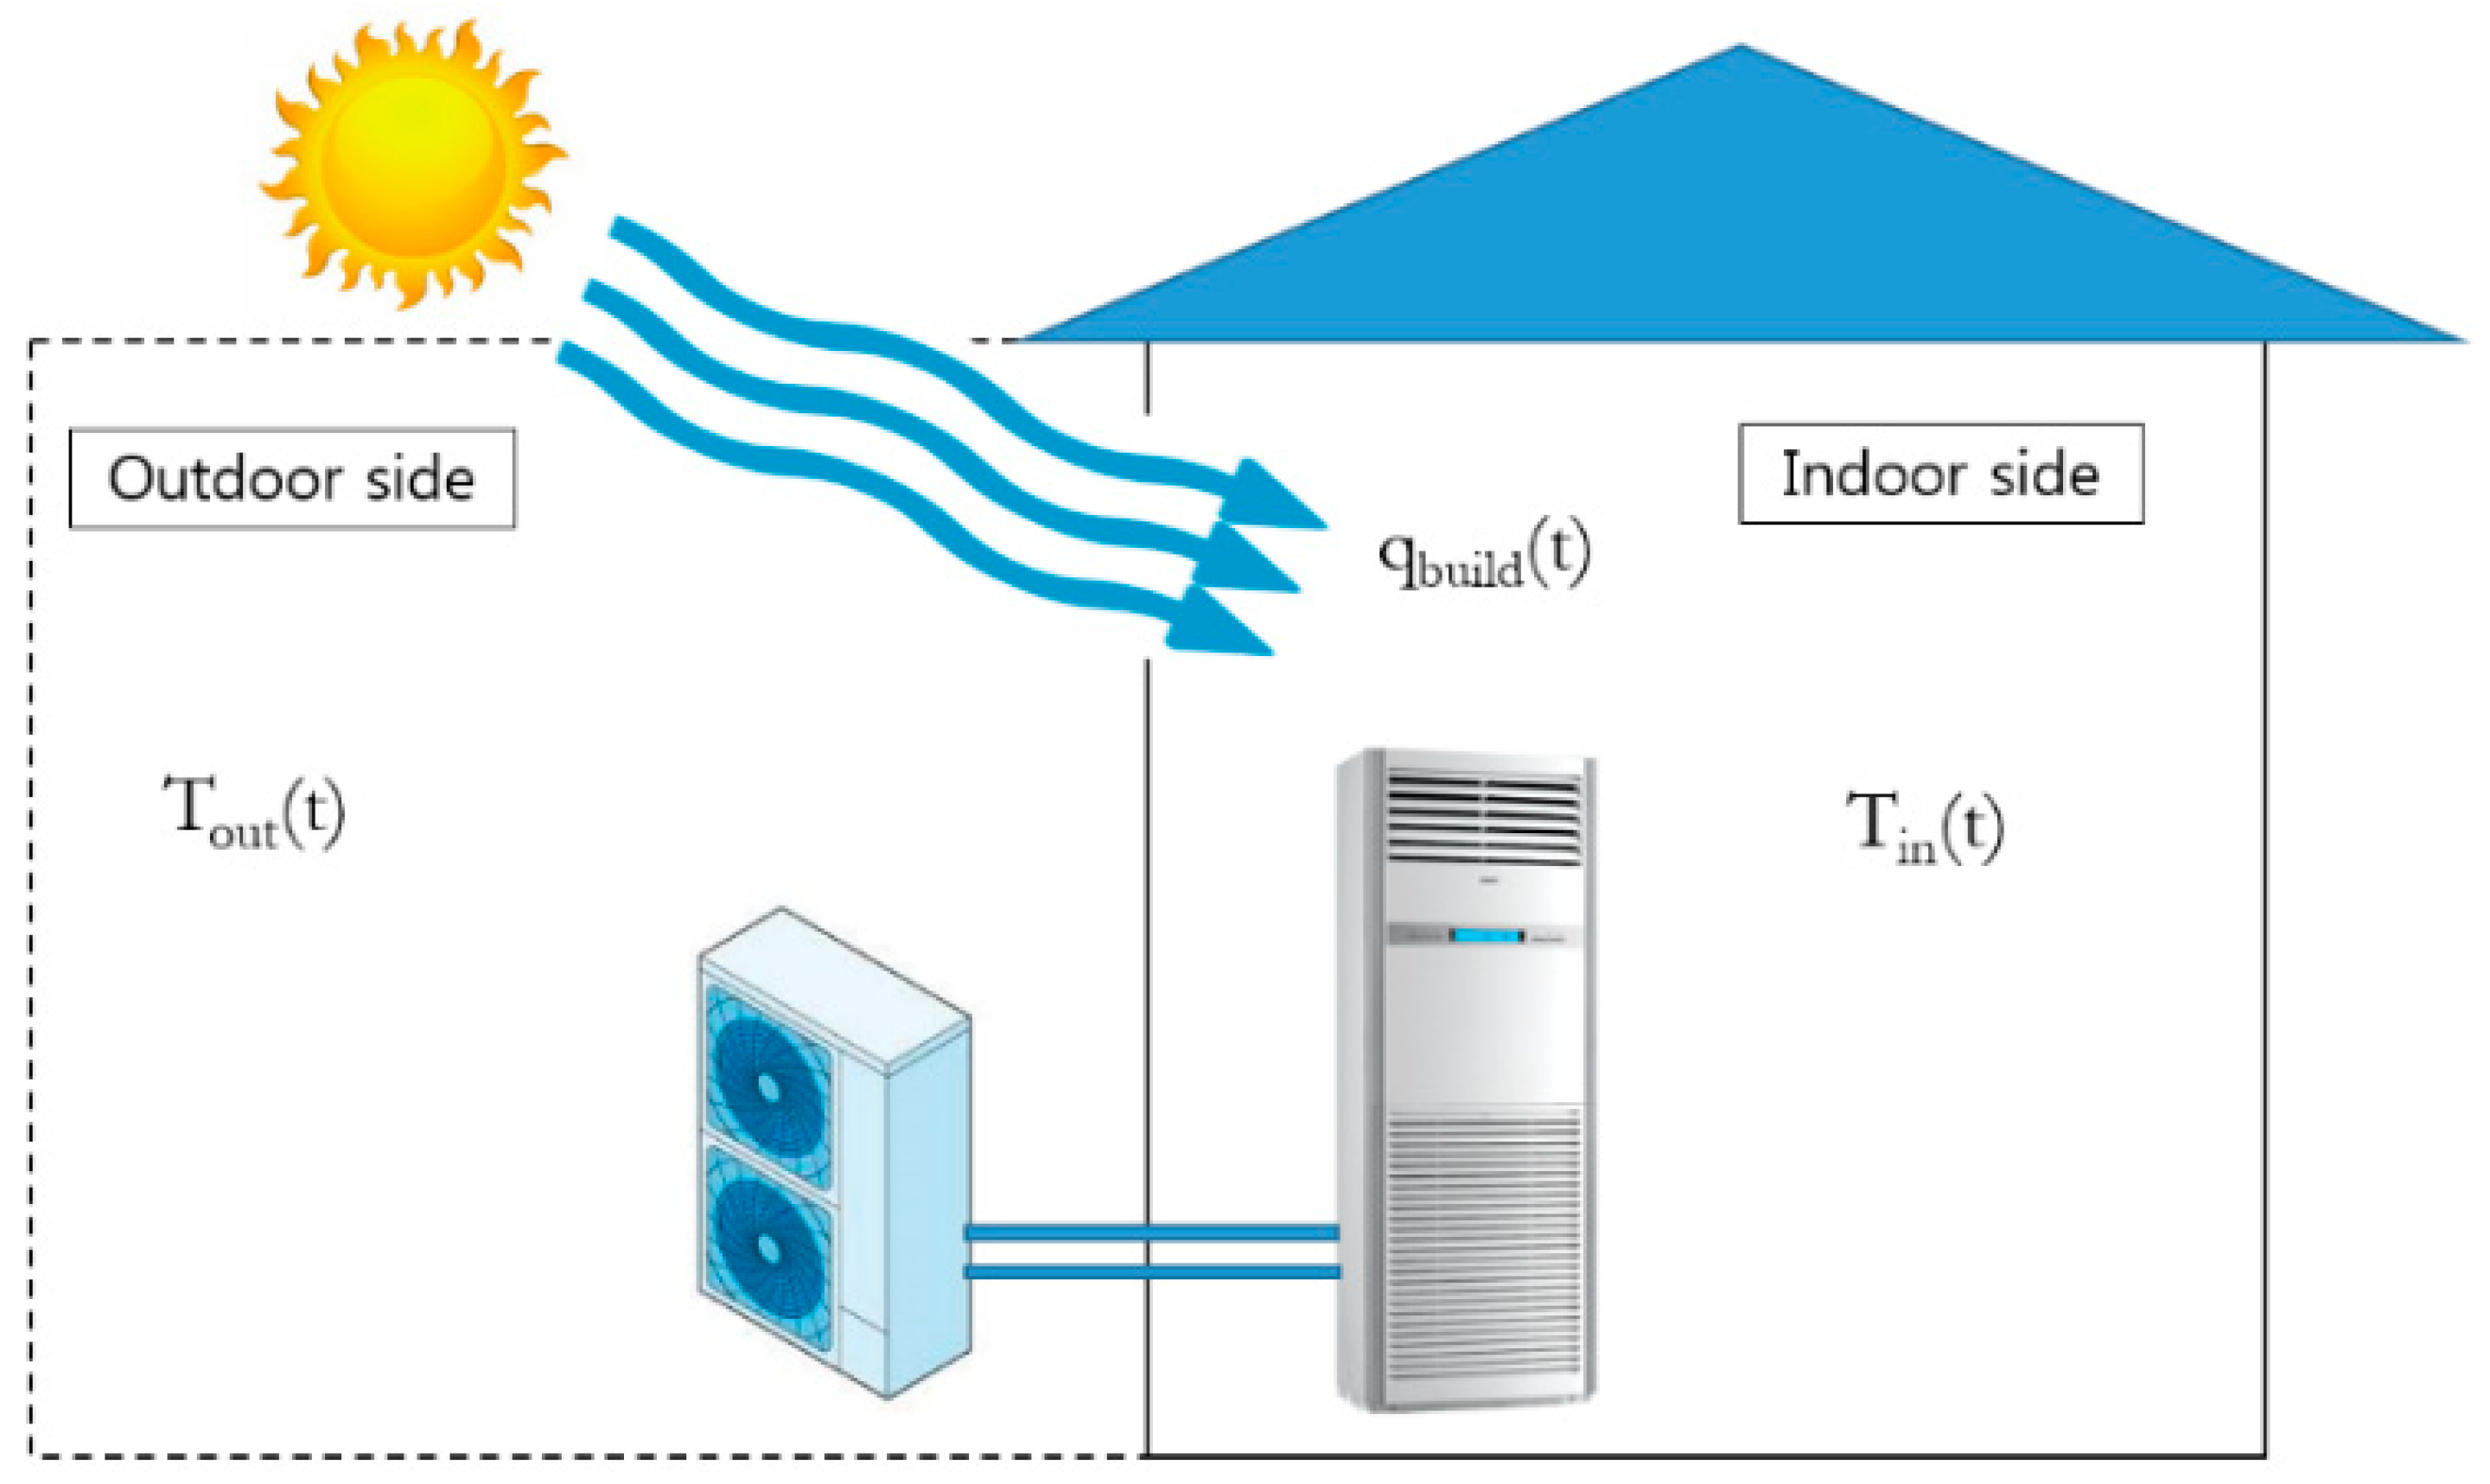
In general, the condenser of the air-conditioner is installed at the outdoor side, while the evaporator is installed at the indoor side of the building, as shown in Figure 1. As the outdoor and indoor temperatures are not fixed, i.e., they vary with time, the performance of the air conditioner, sensitive to the temperature, changes accordingly. In this regard, a performance test of the air conditioner is carried out in a calorimeter-type or air-enthalpy-type test room (Figure 2) where the temperature environment is exactly controlled according to the ISO 5151 standard.
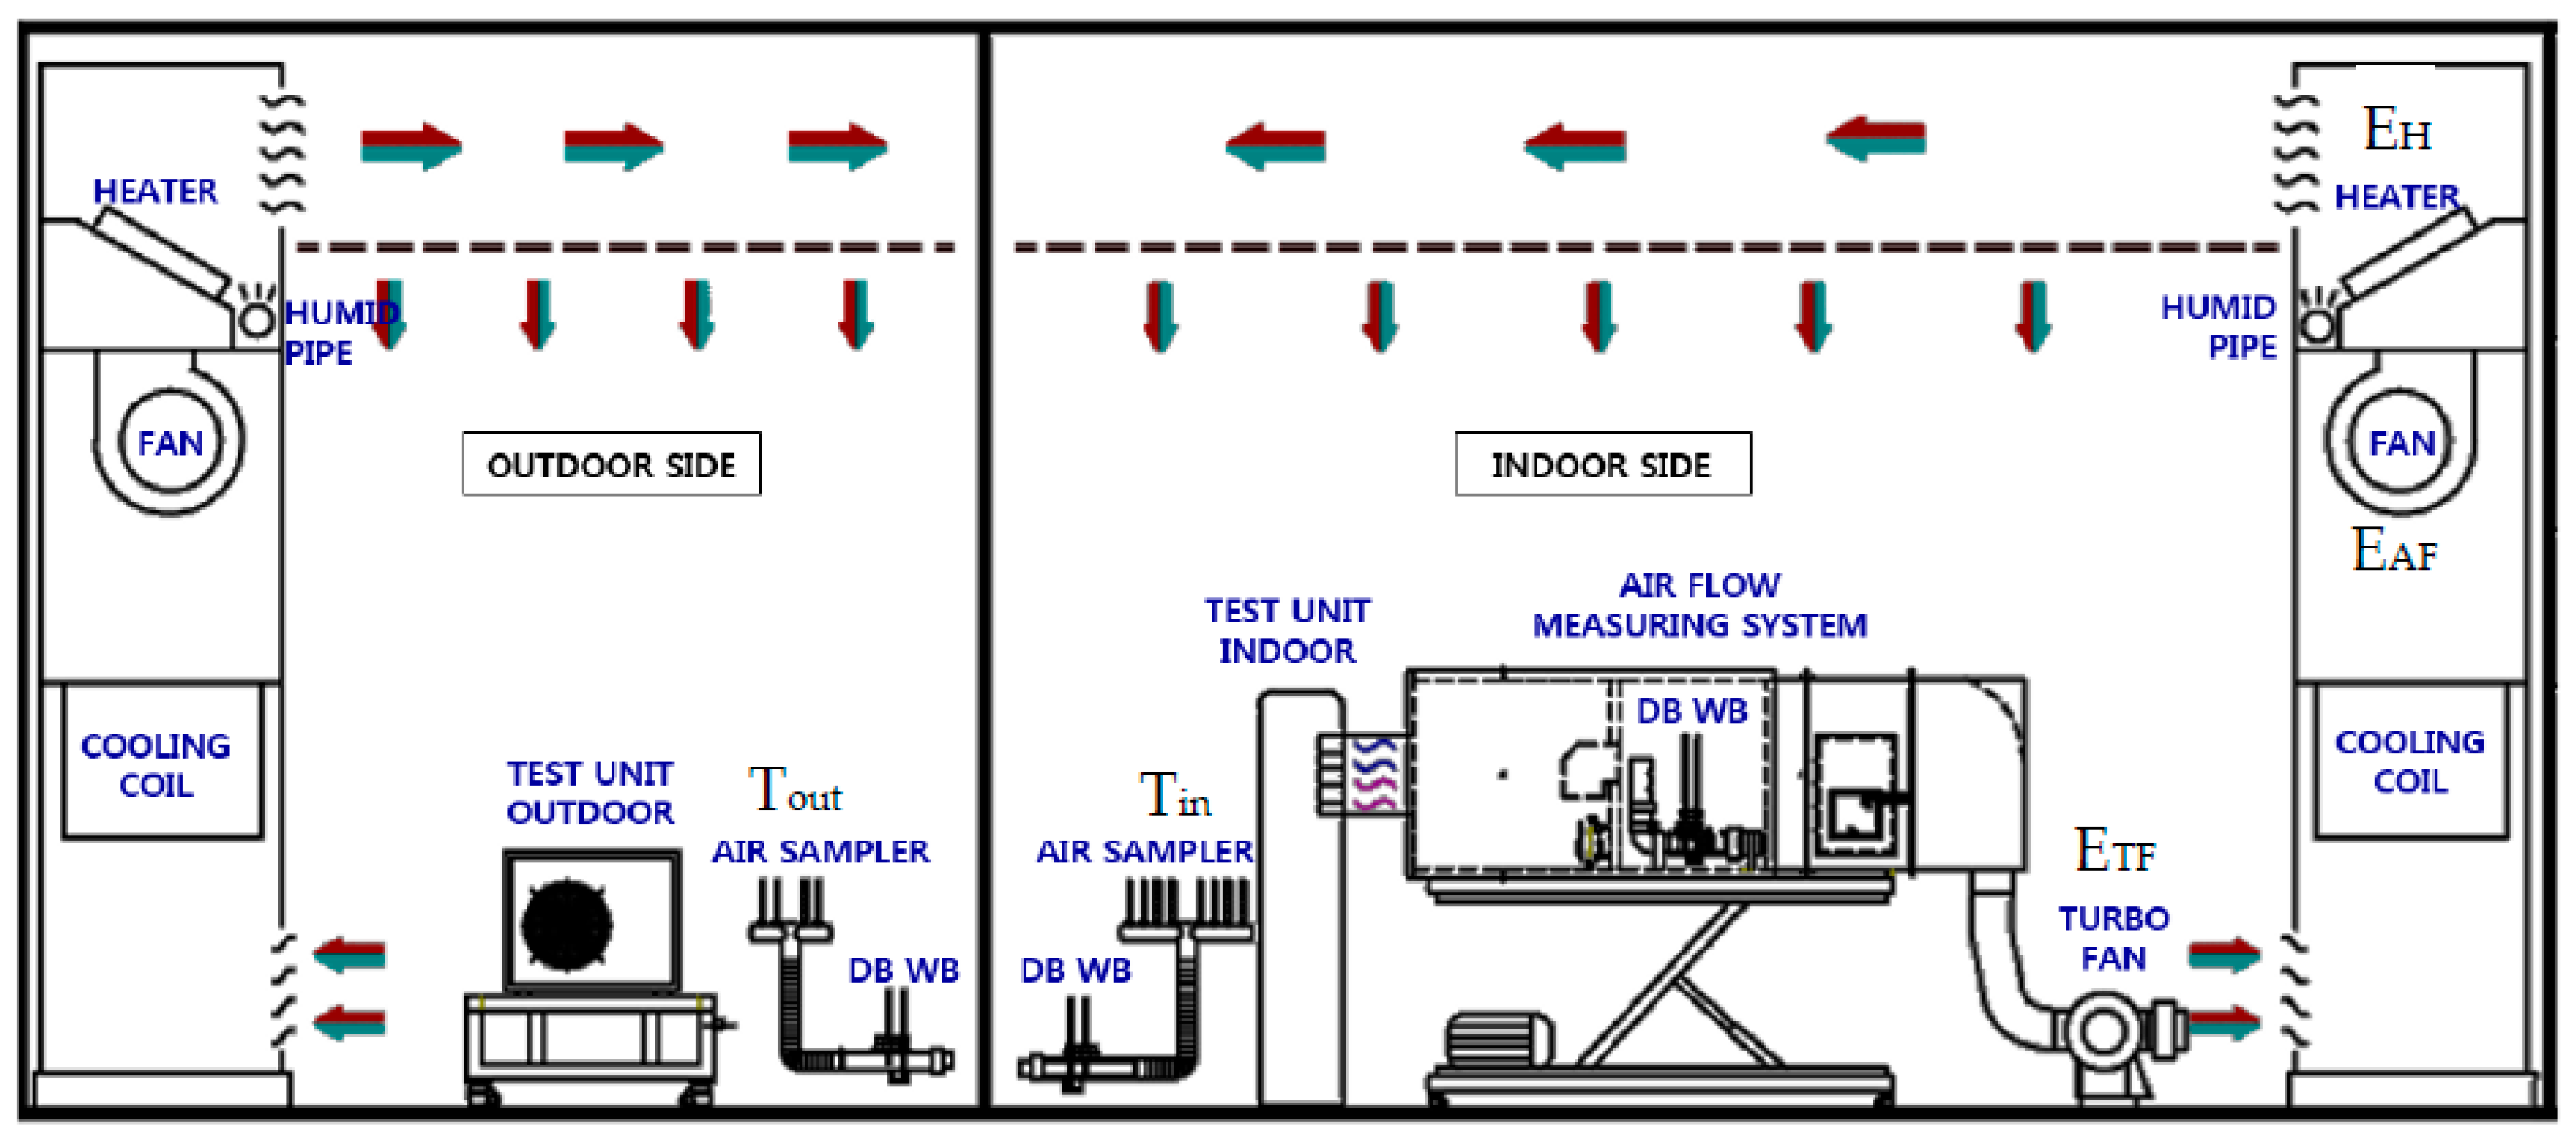
Unlike the (Tout/Tin) environmental setting of the ISO test methodology, we used the temperature in the outdoor side and the building cooling load in the indoor side (Tout/qbuild). In other words, we set the temperature of the outdoor side for a simulation of the heat reservoir outside and applied the cooling load condition in the indoor side for a simulation of the heat infiltration or generation. Tout and qbuild were provided time-dependently. In the test setup, Tout(t) was realized by a cooling coil and heater at the outdoor side, while qbuild(t) was implemented by a heater at the indoor side, as shown in Figure 2. The largest difference was that the cooling coil at the indoor side did not operate and the refrigeration function was operated only by the indoor test unit (air-conditioner indoor unit). Therefore, the temperature of the indoor room was decreased by the operation of the air conditioner while the target temperature was set. The wall of the test room minimized heat penetration and air leakage from the outside with the use of a sufficient thermal insulation material; the relevant test room specification is described in Section 2.2.
In order to measure the energy consumption in each case (constant and variable-speed air conditioners), the outdoor temperature changes (Tout(t)) and indoor cooling load changes (qbuild(t)) were applied in the air-enthalpy test room shown in Figure 2. The outdoor temperature data were applied for the capital cities of Saudi Arabia and South Korea during the cooling season, while the cooling load data were obtained by TRNSYS modeling.
As the latent heat in the cooling load cannot be easily experimentally controlled according to the time, the latent heat was included in the sensible heat. The cooling load was simulated by a heater, which could be easily controlled and had a quick response.
2.2. Air-Enthalpy-Type Test Room Specifications
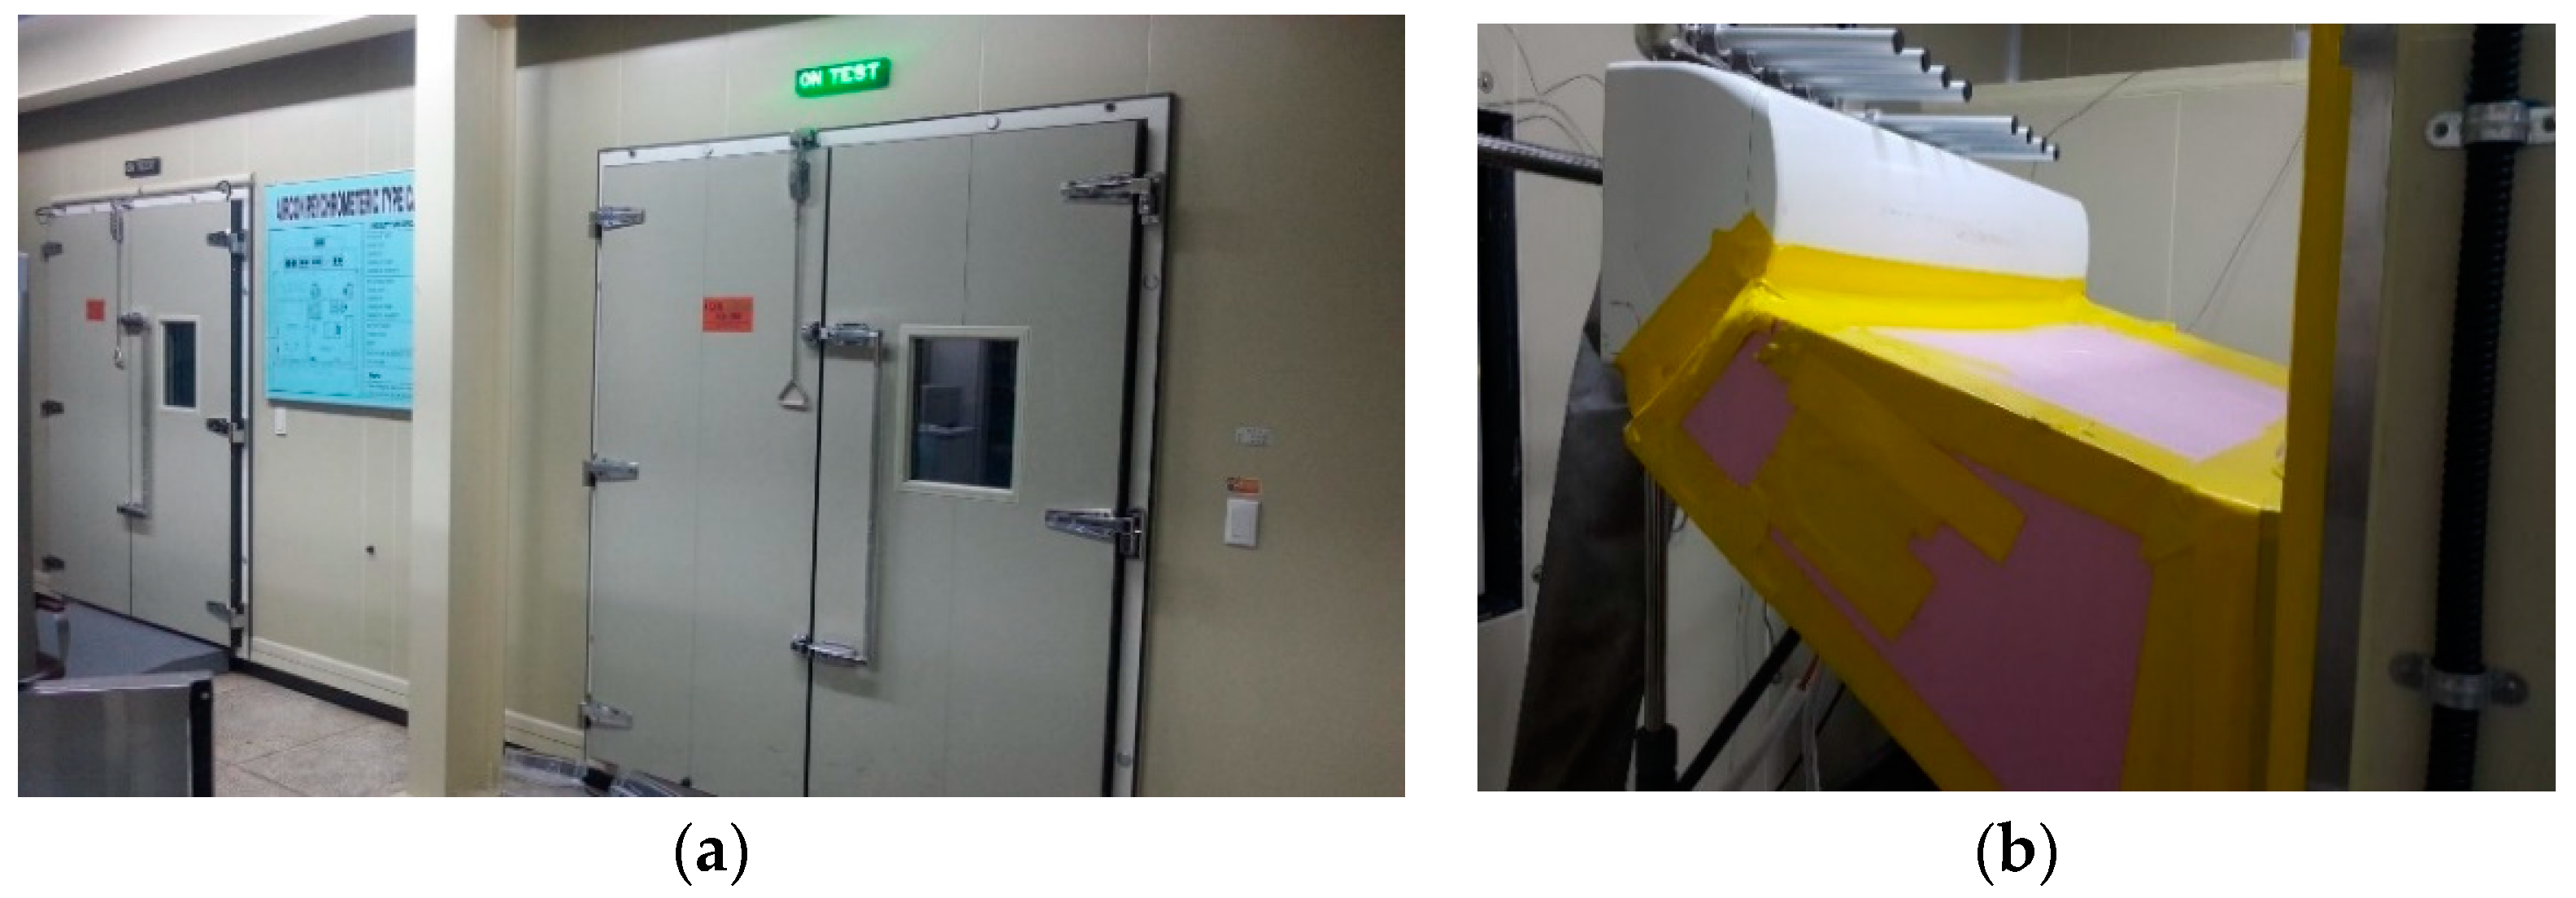
The Korea/International Laboratory Accreditation Cooperation (ILAC) accredited facility following the ISO 5151 standard was used as the air-enthalpy test room (Figure 3). The maximum cooling capacity that could be measured was 18,600 W. The inner dimensions (W × D × H) of the outdoor and indoor rooms were 4.1 m × 4.8 m × 3.6 m and 5.7 m × 4.8 m × 3.6 m, respectively. H included an upper airflow passage above the punched ceiling. The walls of the test room were 75 mm poly-urethane panels. The main instruments were shown in Table 1.
2.3. Heat Balance Evaluation of the Air-Enthalpy-Type Test Room under the Steady State
In order to experimentally implement qbuild(t), it was necessary to evaluate the heating components affecting the both inside and outside of the test room. As shown in Figure 2, the heat generation element in the test room was not only the heater, but also the turbo, air handling unit (AHU) and air sampler fans. In addition, heat penetration from the outside of the test room wall existed. The heat balance of the test room was compared between the heating components in each configuration and cooling capacity of the air conditioner.
Based on the measurement for each component, the total heat generation was compared with the tested cooling capacity of the air conditioner, as shown in Table 2, under the steady state before the time-dependent simulation tests.
During the simulation test described below, the variable components such as the heater, AHU fan and turbo fan were measured in real time with a power meter. By adjusting the power consumption of each component affecting the cooling load in real time, the time-variant building cooling load could be provided in the indoor side of the test room.
2.4. Climates in Korea and Saudi Arabia
Korea is located in the mid-latitude temperate climatic zone; the four seasons, spring, summer, fall, and winter are conspicuous. In winter (December–February), it is cold and dry under the influence of the continental air from northern China and Siberia. In summer (June–August), hot and humid weather is observed, attributed to the Pacific atmospheric pressure. In spring (March–May) and autumn (September–November), many sunny days are observed owing to the influence of the migratory anticyclone.
The climate of Saudi Arabia is characterized by high temperatures during the day and low temperatures during the night. Most of the country follows the pattern of the desert climate, except the southwest region having a semi-arid climate [13].
Table 3 shows the distributions of the monthly temperatures in Seoul and Riyadh, the capital cities of South Korea and Saudi Arabia, respectively [14,15]. In Seoul and Riyadh, the cooling seasons are June–September and March–November, respectively. In both cities, continuous air conditioning is not required for all the cooling periods. In Seoul, the air conditioners operate intermittently throughout the cooling period. In Riyadh, the air conditioners operate intermittently in March, April, September, October and November.
2.5. Summary of Energy Simulations for the Building Coolong Load
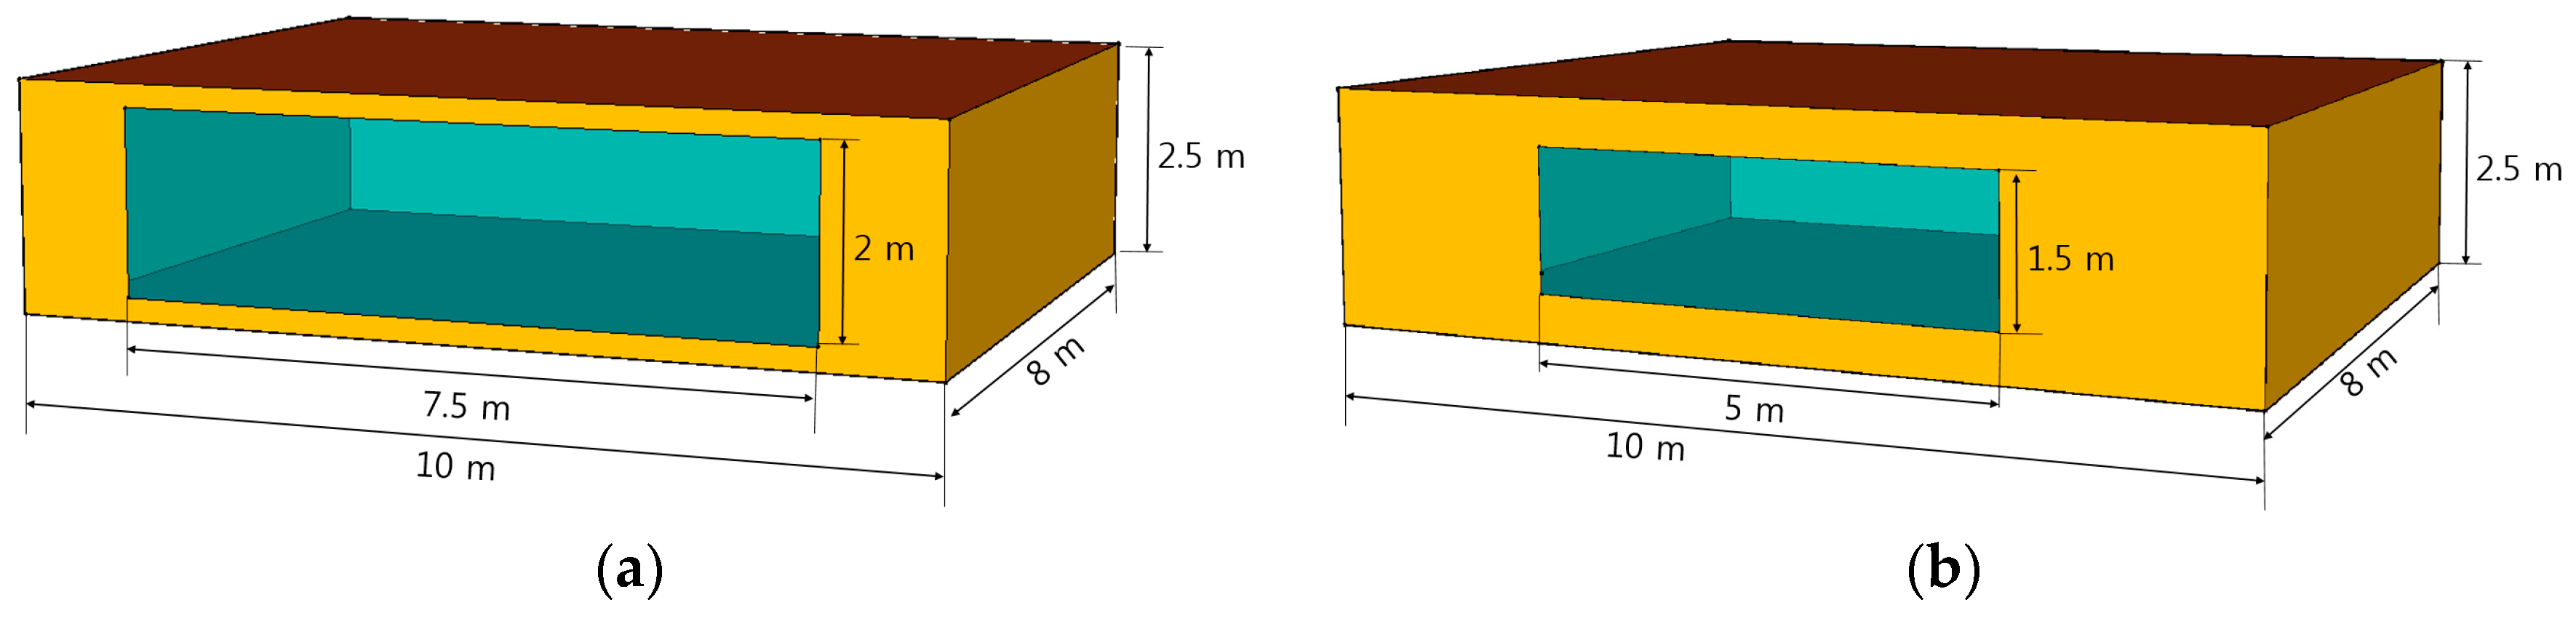
The TRNSYS program (version 17) was used to obtain the building cooling load for the cooling periods. We applied the meteorological data of Seoul and Riyadh for several years embedded in the TRNSYS program. TRNSYS (TRaNsient SYSTem Simulation), which is widely used as a building load calculation program, was developed by SEL (Solar Energy Lab) of University of Wisconsin, USA. The calculation algorithm of building load in TRNSYS is based on ISO 13790 and ISO 7730. Simulation for estimating the heating and cooling load on the building was performed through type 56. A multi-zone building analysis module of the TRNSYS program. Multi-zone module includes building properties such as geometric dimensions and wall configuration data and windows. In this module, the heat transfer by conduction, convection and radiation, heat gains were calculated considering the presence of occupants and equipment, and the storage of heat in the room air and building mass. Furthermore, it is possible for the temperature, solar radiation, bearing etc. to multi-zone module by applying a Meteonorm climate (for 20 years average temperature). Based on the transfer function method, a dynamic thermal energy analysis was performed in consideration of various types of complex heat gain occurring in space and associated radiation, convection, heat storage and heat dissipation of equipment [16,17]. The TRNSYS energy rate control method was used to analyze the seasonal building cooling load. Modules of type 15-2, type 56, TRNSYS three-dimensional (3D) plugin and Google SketchUp were utilized. We set a single zone of the same size in Seoul and Riyadh; however, the size of the window was set according to each country (Figure 4). The architectural style changes according to the life and environment aspect, and various studies are being conducted on this [18,19]. However, the comparison in the form of the same building is likely to be suitable for comparing the energy consumption by the type of air conditioner of this study. The Saudi households typically use small windows to block direct solar radiation. The properties of glass and wall materials were applied by referring to the Korea’s architectural regulation notice and Saudi’s paper [20,21]. The room temperature in the TRNSYS simulation was set to 26 °C, which was the same as the air-conditioner temperature setting during the experiment. The recommended room temperature is different for each country. In the case of Korea, 26 °C is recommended according to the "Ministry of Land, Infrastructure and Transport", and 23–25 °C are recommended according to the government guidelines in Saudi Arabia. For an equal comparison, we set the temperature as 26 °C in this study [20,22].
According to ISO 7730, heat from the human body under light work circumstance is 65 W for sensible heat and 55 W for a latent per person [23].
The building components for the TRNSYS simulation in Seoul and Riyadh are summarized in Table 4.
2.6. Specifications of the Compared Air Conditioners
For the comparison test of constant and variable-speed air conditioners in the test room, products with similar specifications were selected (Table 5). The two products had similar capacities, power inputs and EERs with relative differences within 5%. The purpose of this study was to evaluate the energy saving effects of the variable-speed air conditioner in real climate conditions even though the specifications were similar to those of the constant-speed air conditioner. To operate under the Korean and hot Saudi Arabian climates, hot-climate (T3) air conditioners were employed.
3. Results
3.1. Simulation Results
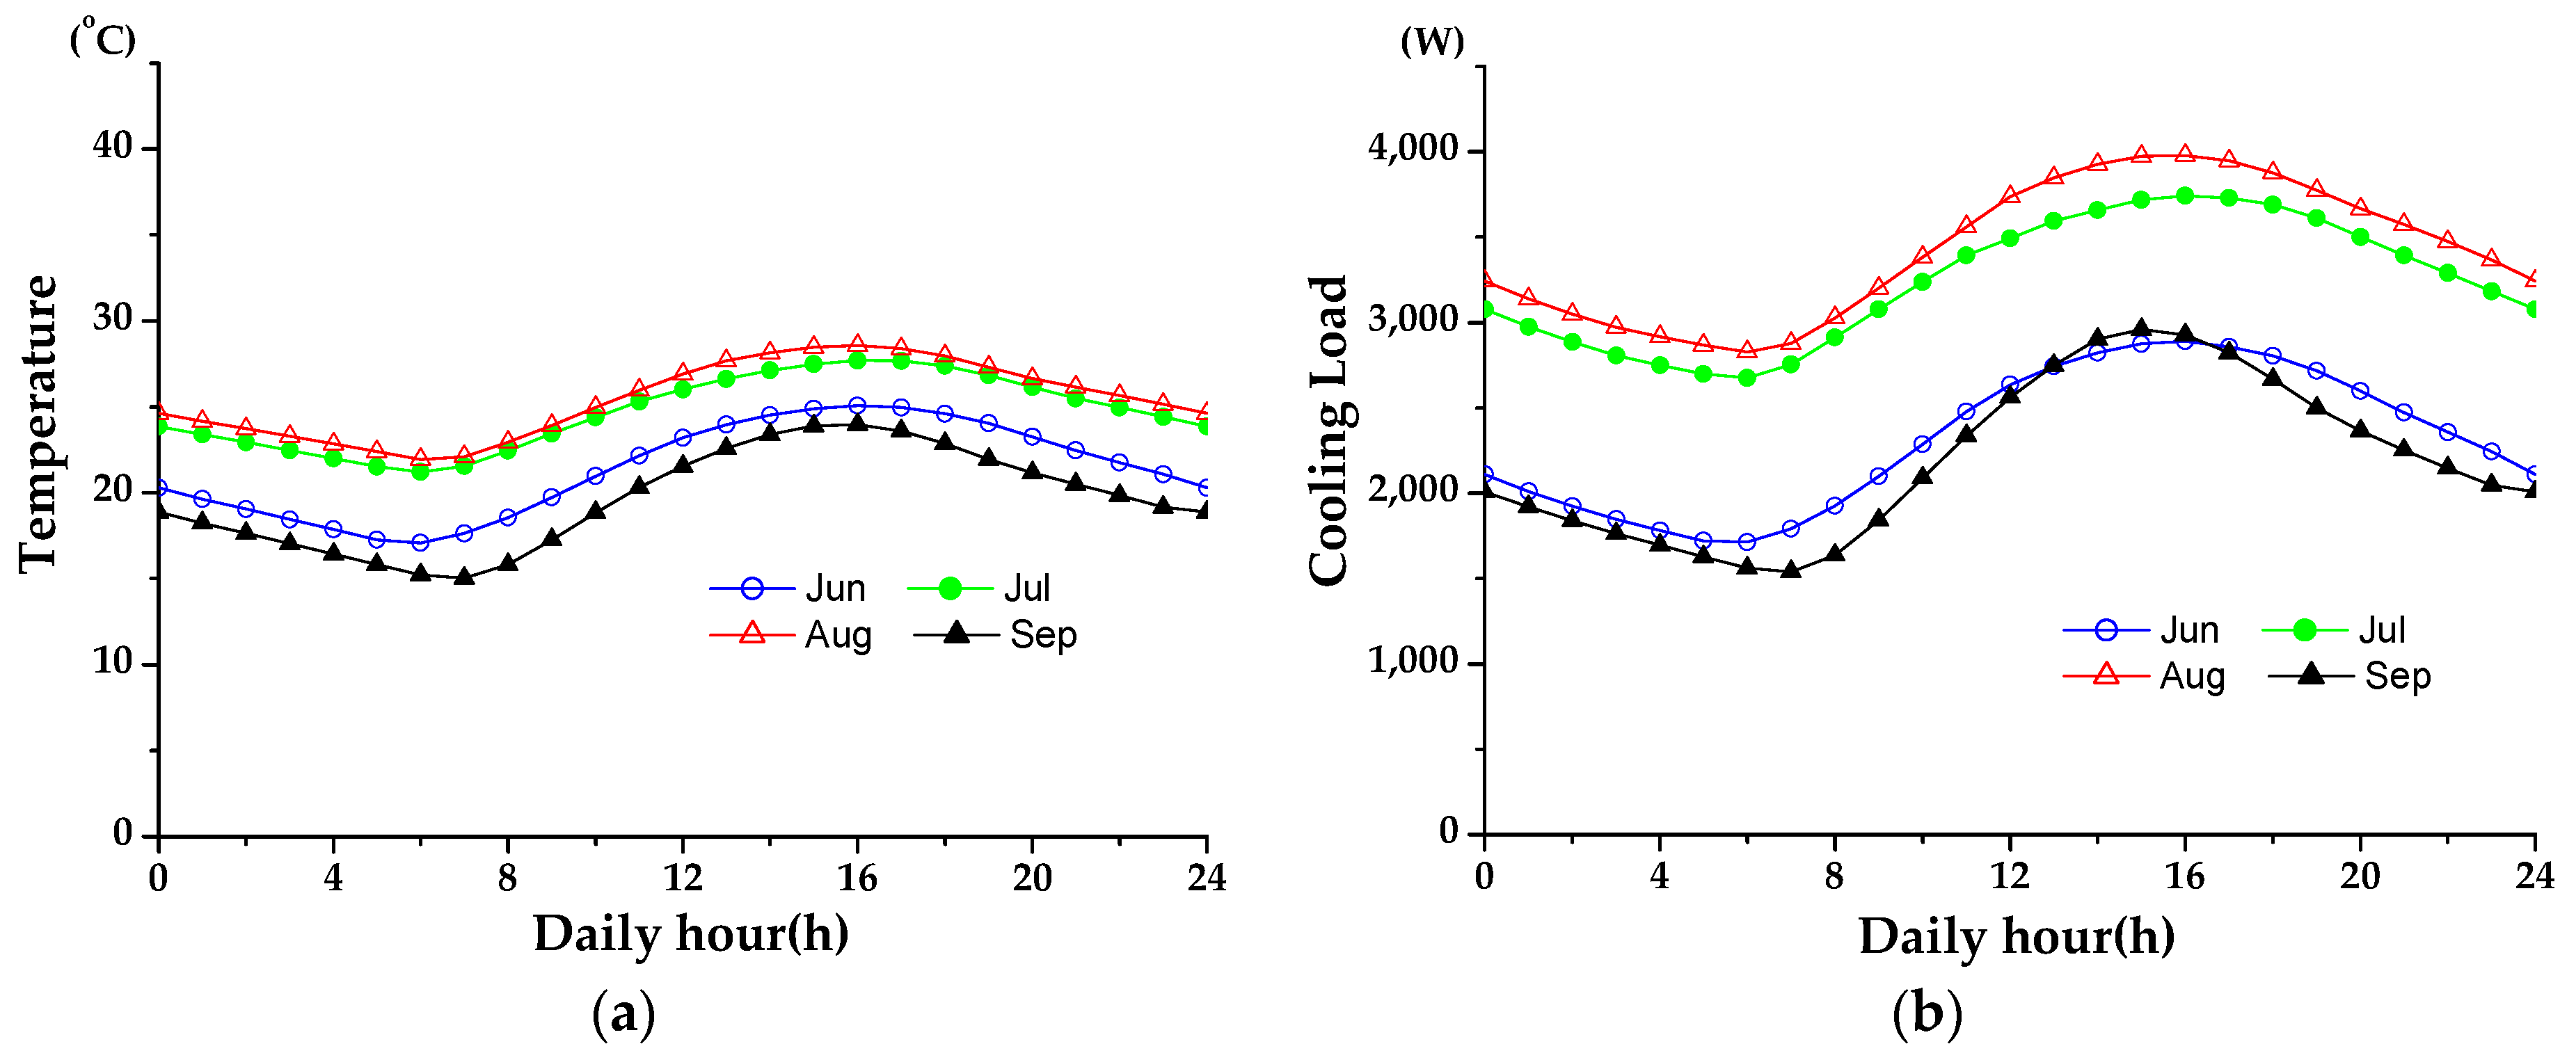
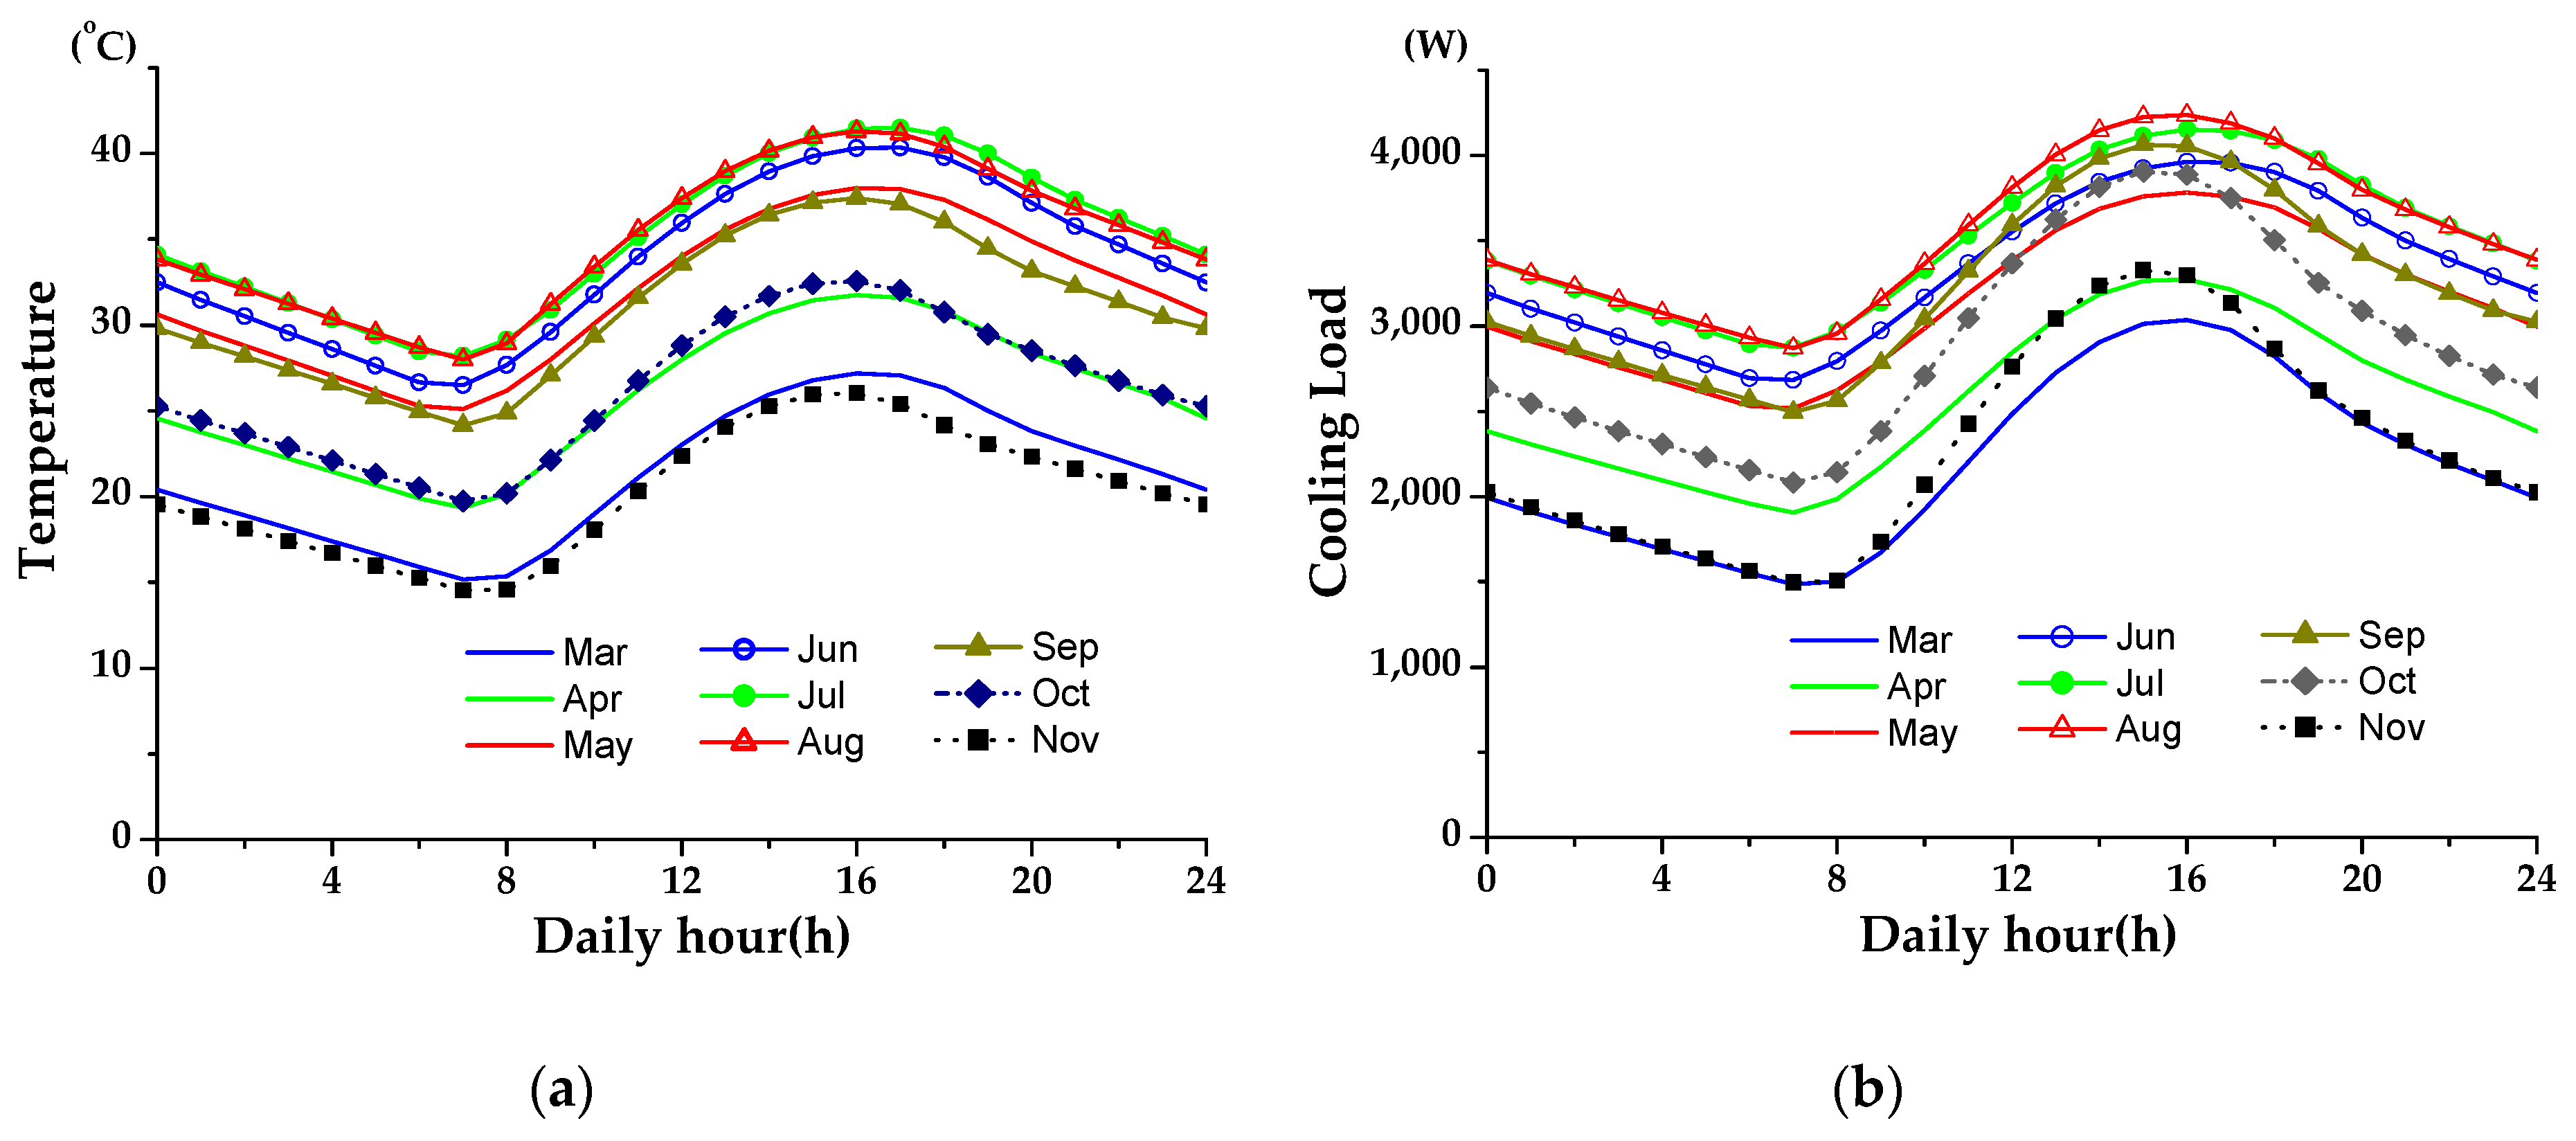
Before the experiments with the constant and variable-speed (inverter) air conditioners, TRNSYS simulations were carried out for building cooling loads under Seoul and Riyadh temperature conditions (Figure 5b and Figure 6b). As the TRNSYS program contained long-term data (more than 10 years), it seemed that the recent temperature increase owing to global warming is buried in Figure 5a and Figure 6a. Therefore, it seemed that 1–3 °C were underestimated compared with the climate felt nowadays. The building cooling loads of Seoul and Riyadh have maximum values of approximately 4000 W in August. The two cities have similar maximum building loads as the humidity in summer is very low in Riyadh and very high in Seoul.
3.2. Experimental Results
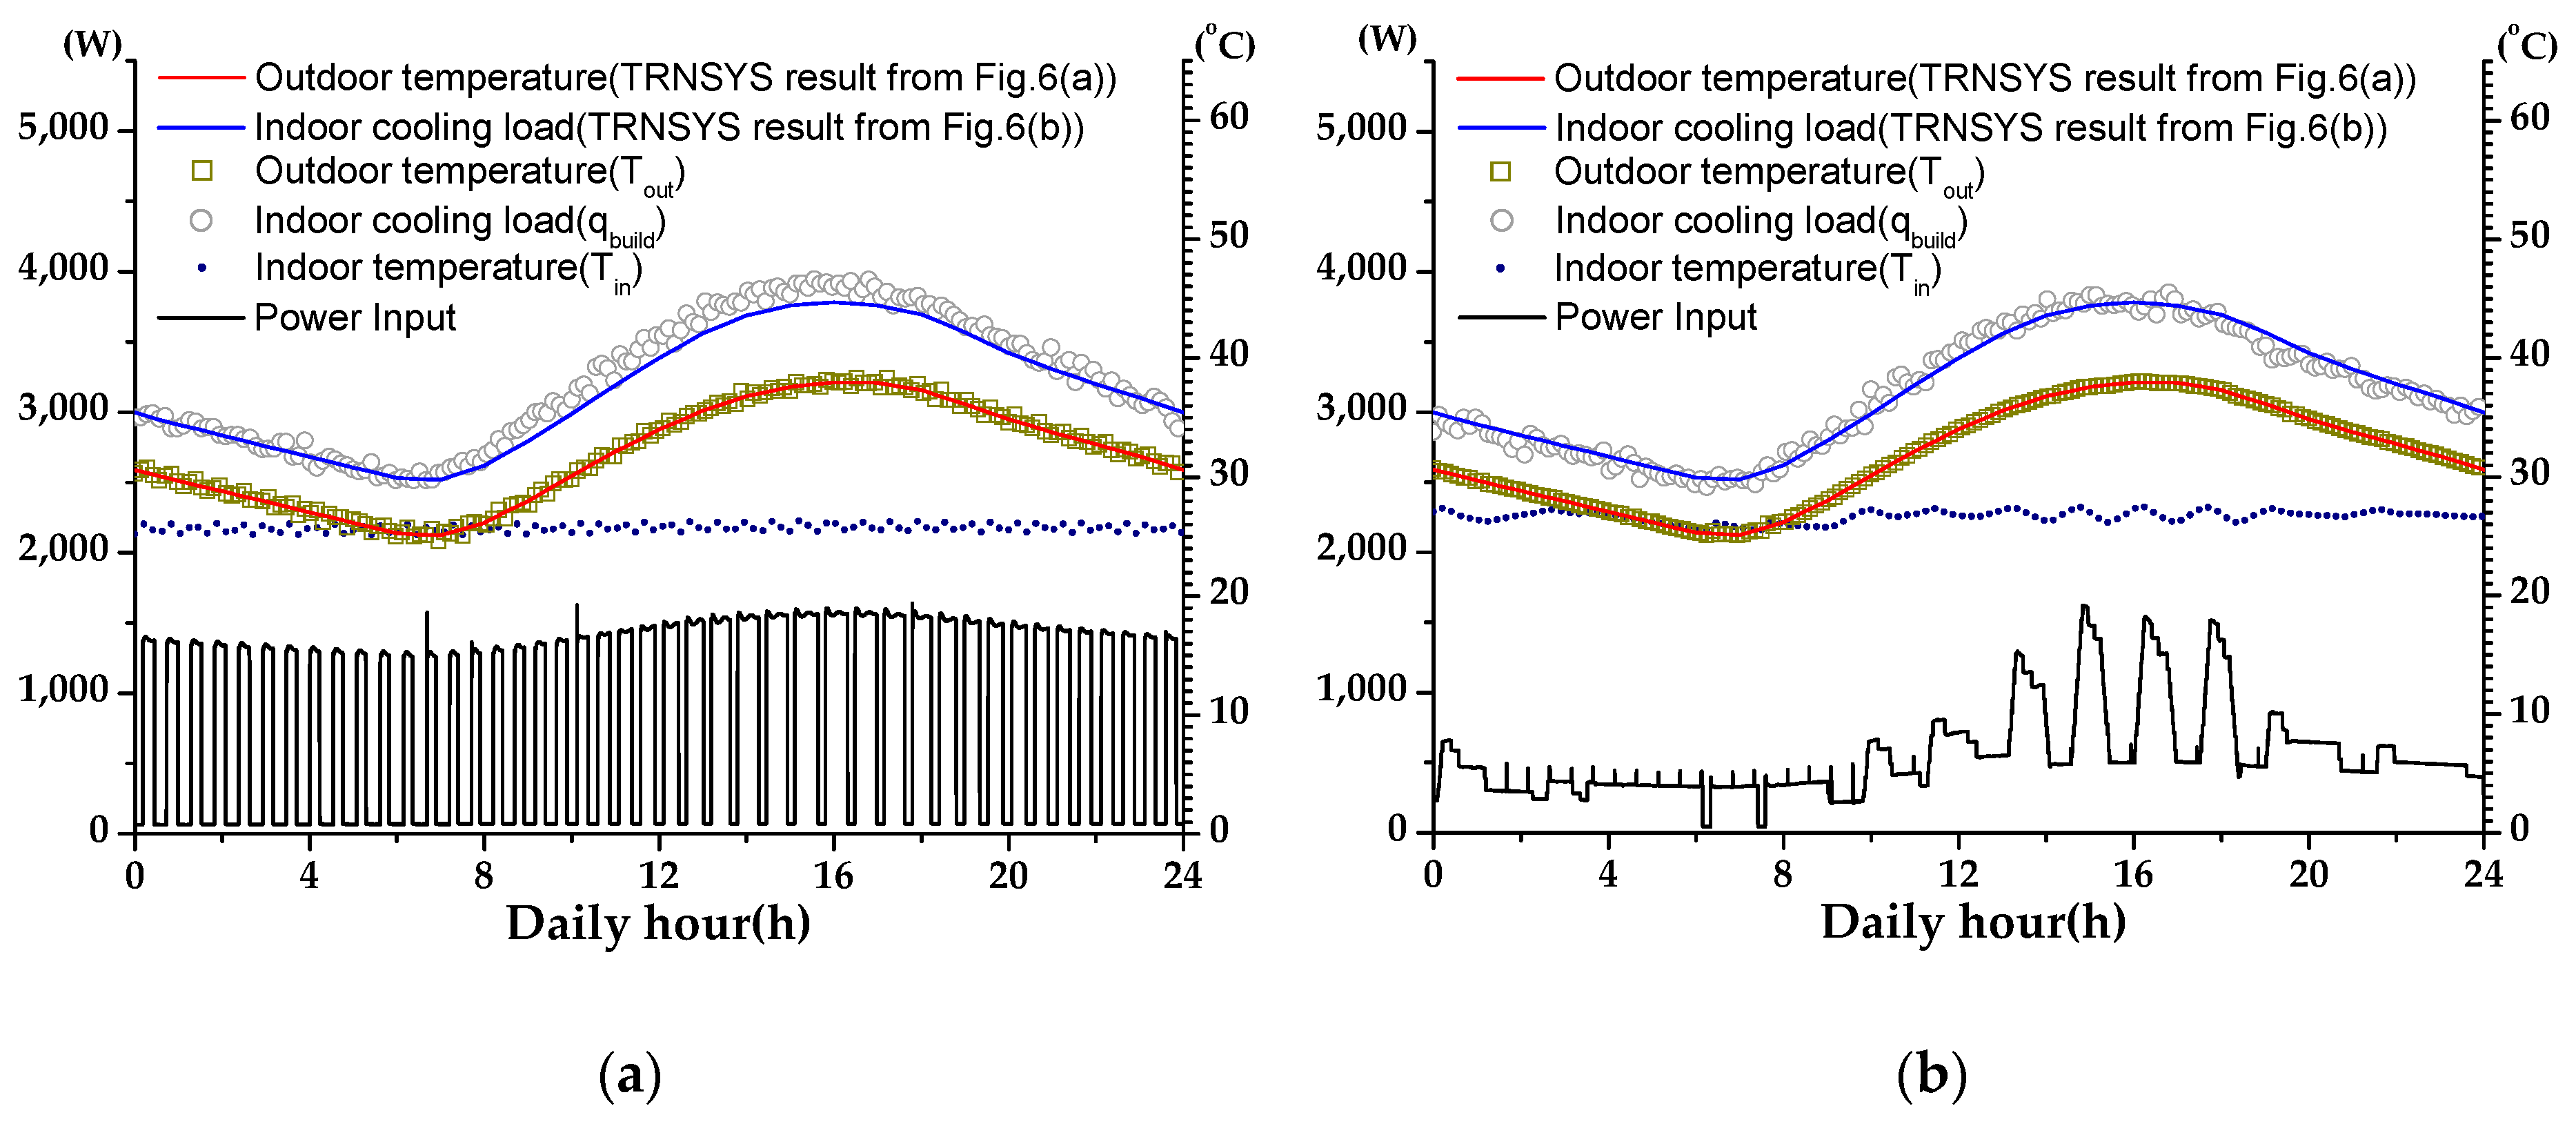
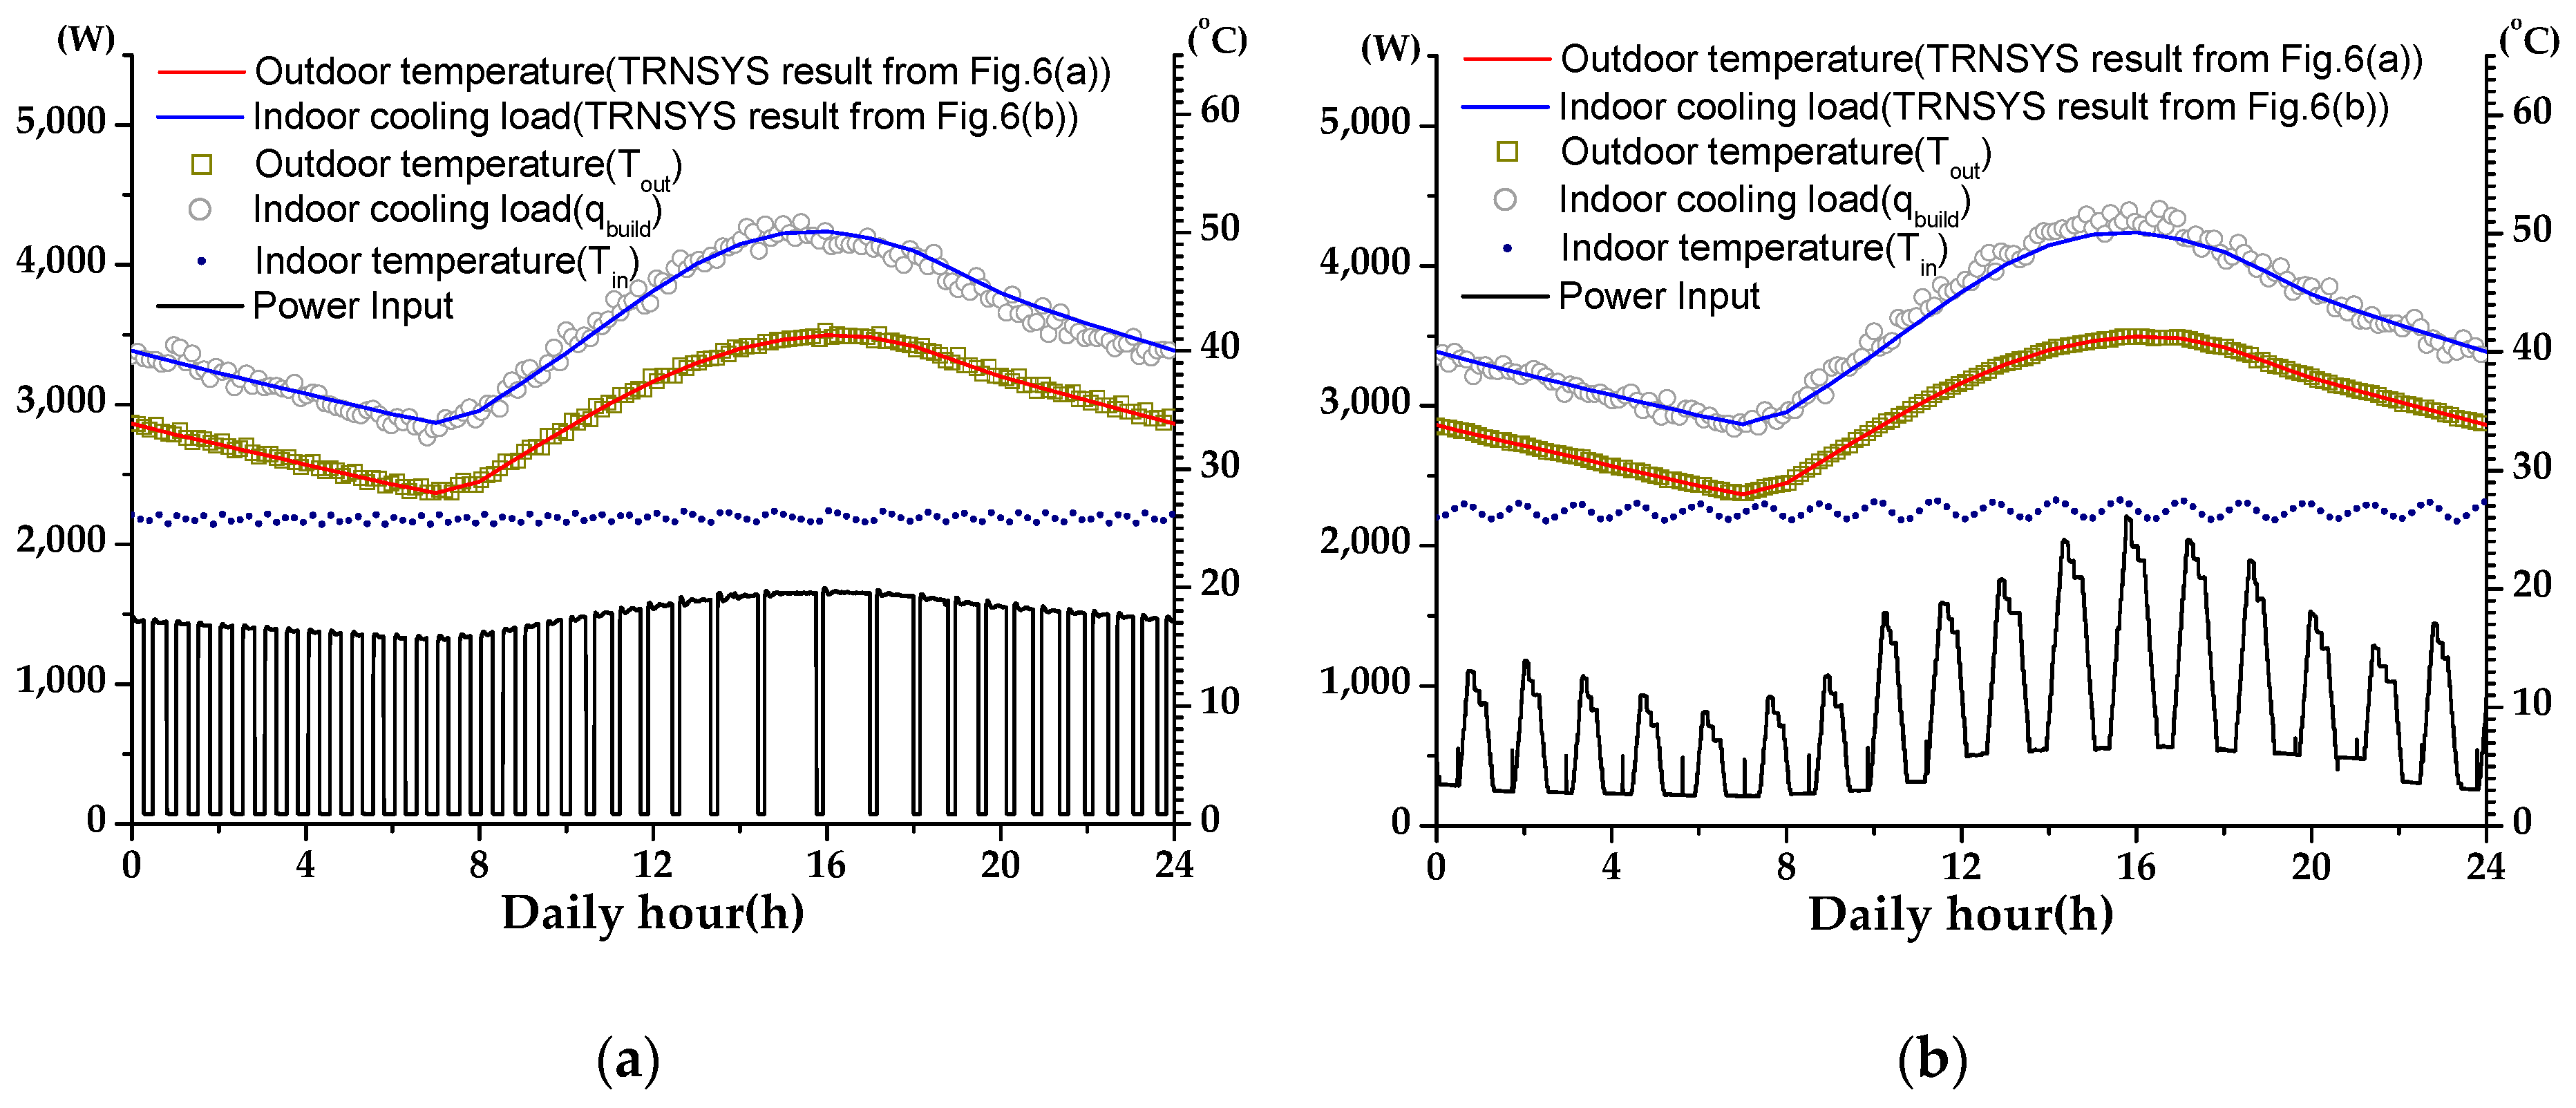
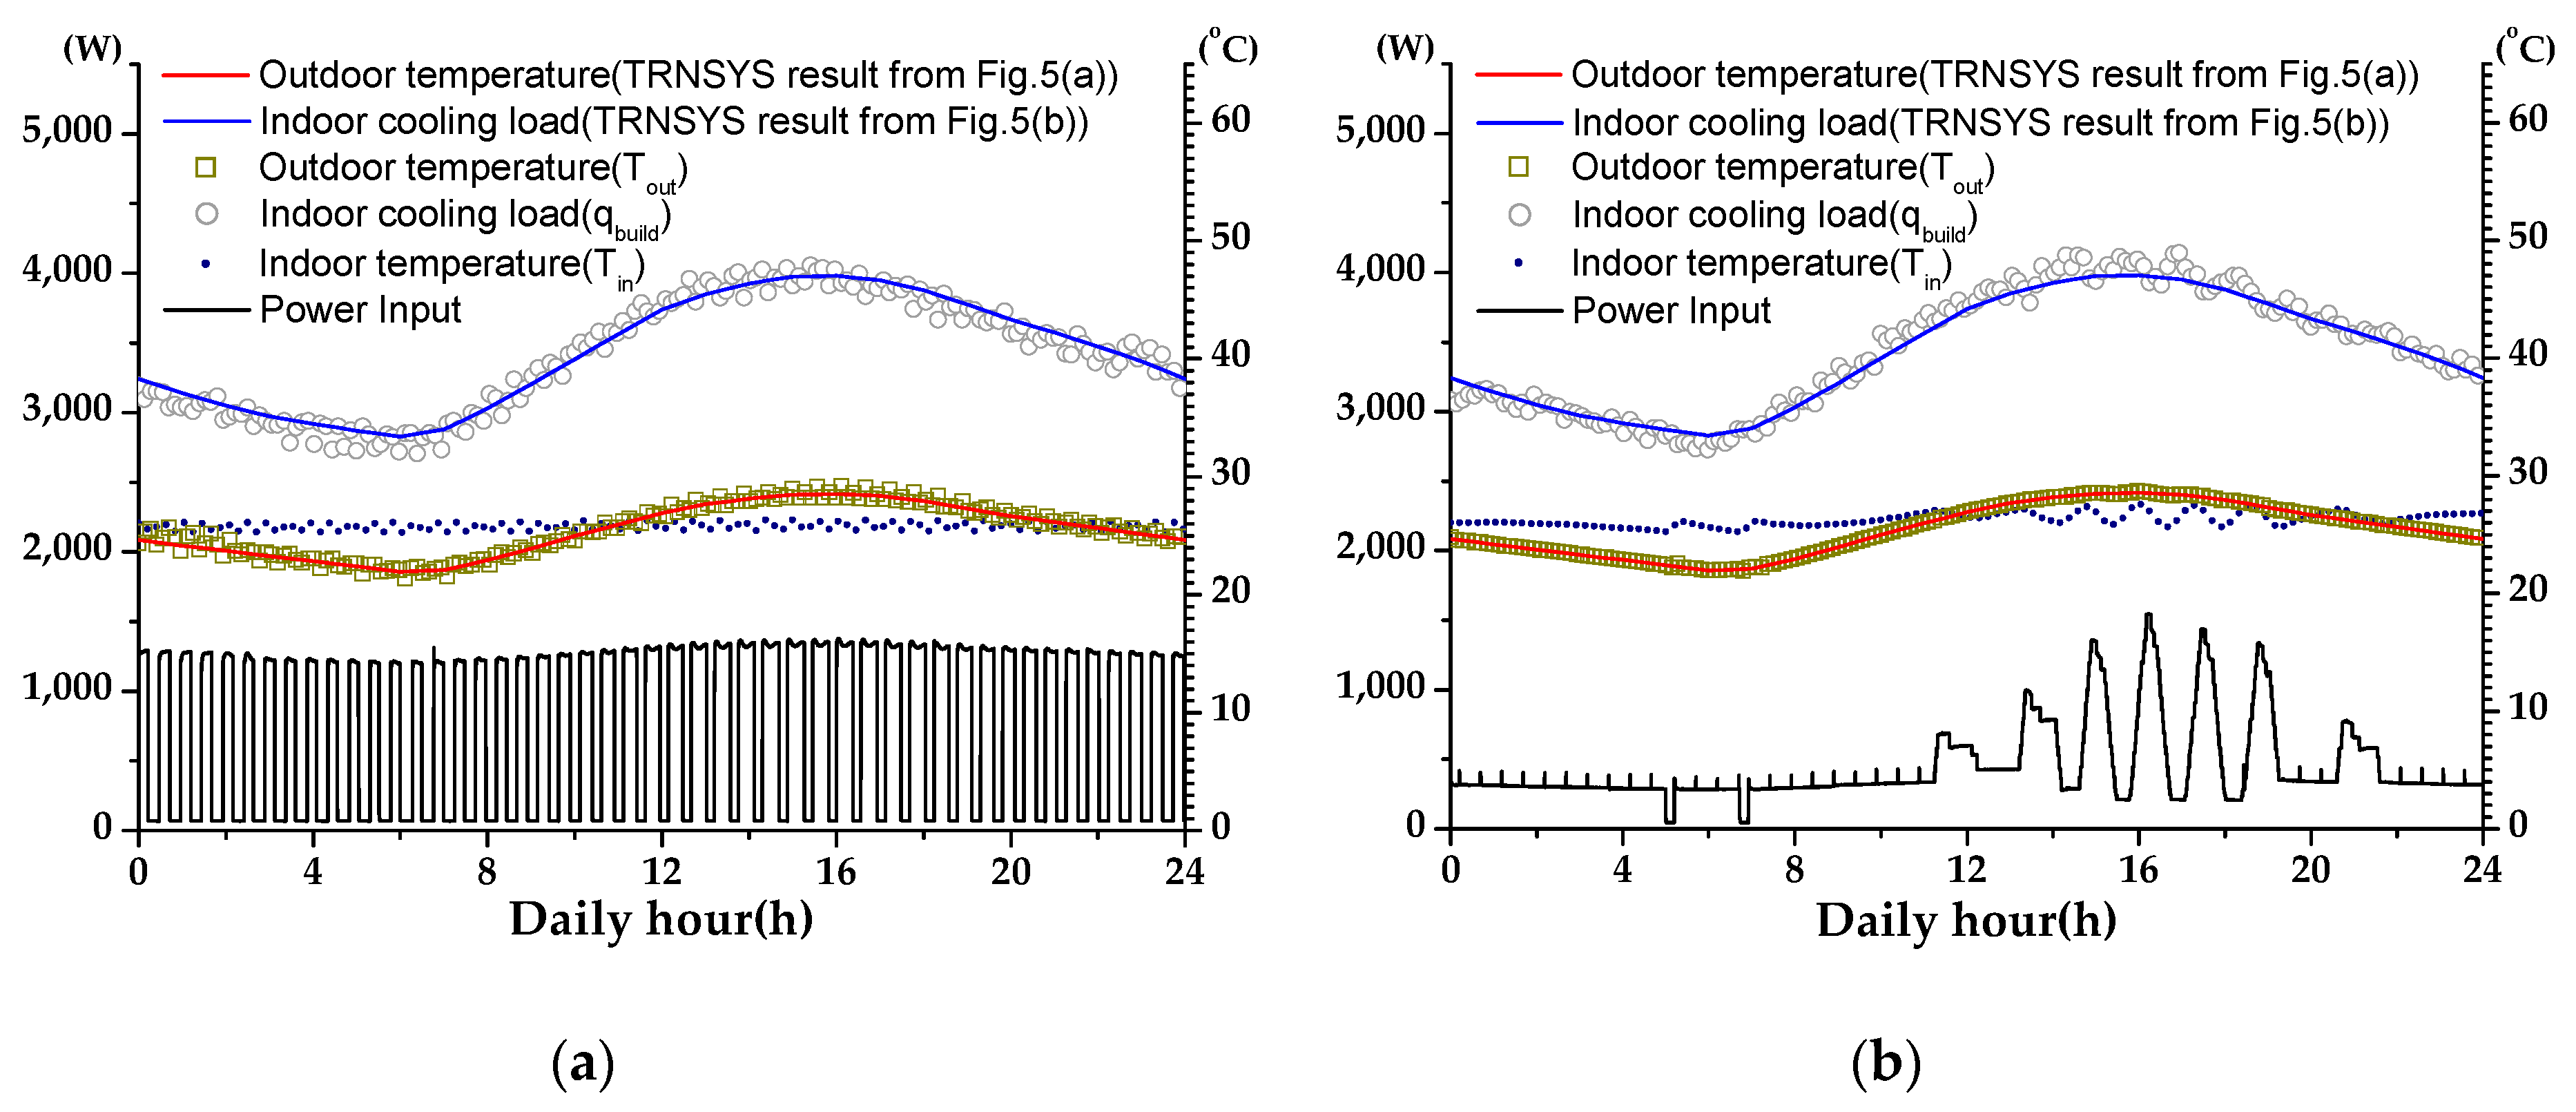
Figure 7, Figure 8 and Figure 9 show experimental results for comparison of the constant-speed and inverter air conditioners. The indoor building loads and outdoor temperatures were consistent with the TRNSYS simulation results (circle points and rectangular in the figures). The indoor building loads were experimentally implemented through the heater at the upper end of the AHU, as shown in Figure 2, where the powers of other heating elements (e.g., AHU and turbo fans) in the indoor side were simultaneously measured and the test was controlled by the AHU heater. The dotted lines with small oscillations represented the indoor room temperature which varied in the range of 26.0 ± 1.5 °C as the test product temperature was set at 26 °C. Both the constant-speed and inverter air conditioners were automatically operated during the experiments and only the indoor building load and outdoor temperature were applied according to the TRNSYS simulation results.
The largest difference in the graph is the variation in the power input. The constant-speed air conditioner exhibited simple on/off control whereas the inverter (variable speed) air conditioner exhibited changes corresponding to the building load or outdoor temperature. In the case of the inverter air conditioner in Riyadh, the power input in May was highly activated during the daytime (12–19 h), whereas it was activated at any time in August. In the hottest season (August) in Riyadh and Seoul, the building loads were similar under the considered simulation conditions (Section 3.1).
However the power variations were different owing to the outdoor temperature differences. Although the building cooling loads were similar in this study, the outdoor temperature in Saudi Arabia was significantly higher than that in Korea. Usually, the outdoor unit of the air conditioner was affected by the dry-bulb temperature rather than by the wet-bulb temperature in the outdoor test room during the cooling test in which no condensation on the outdoor unit heat exchanger was observed.
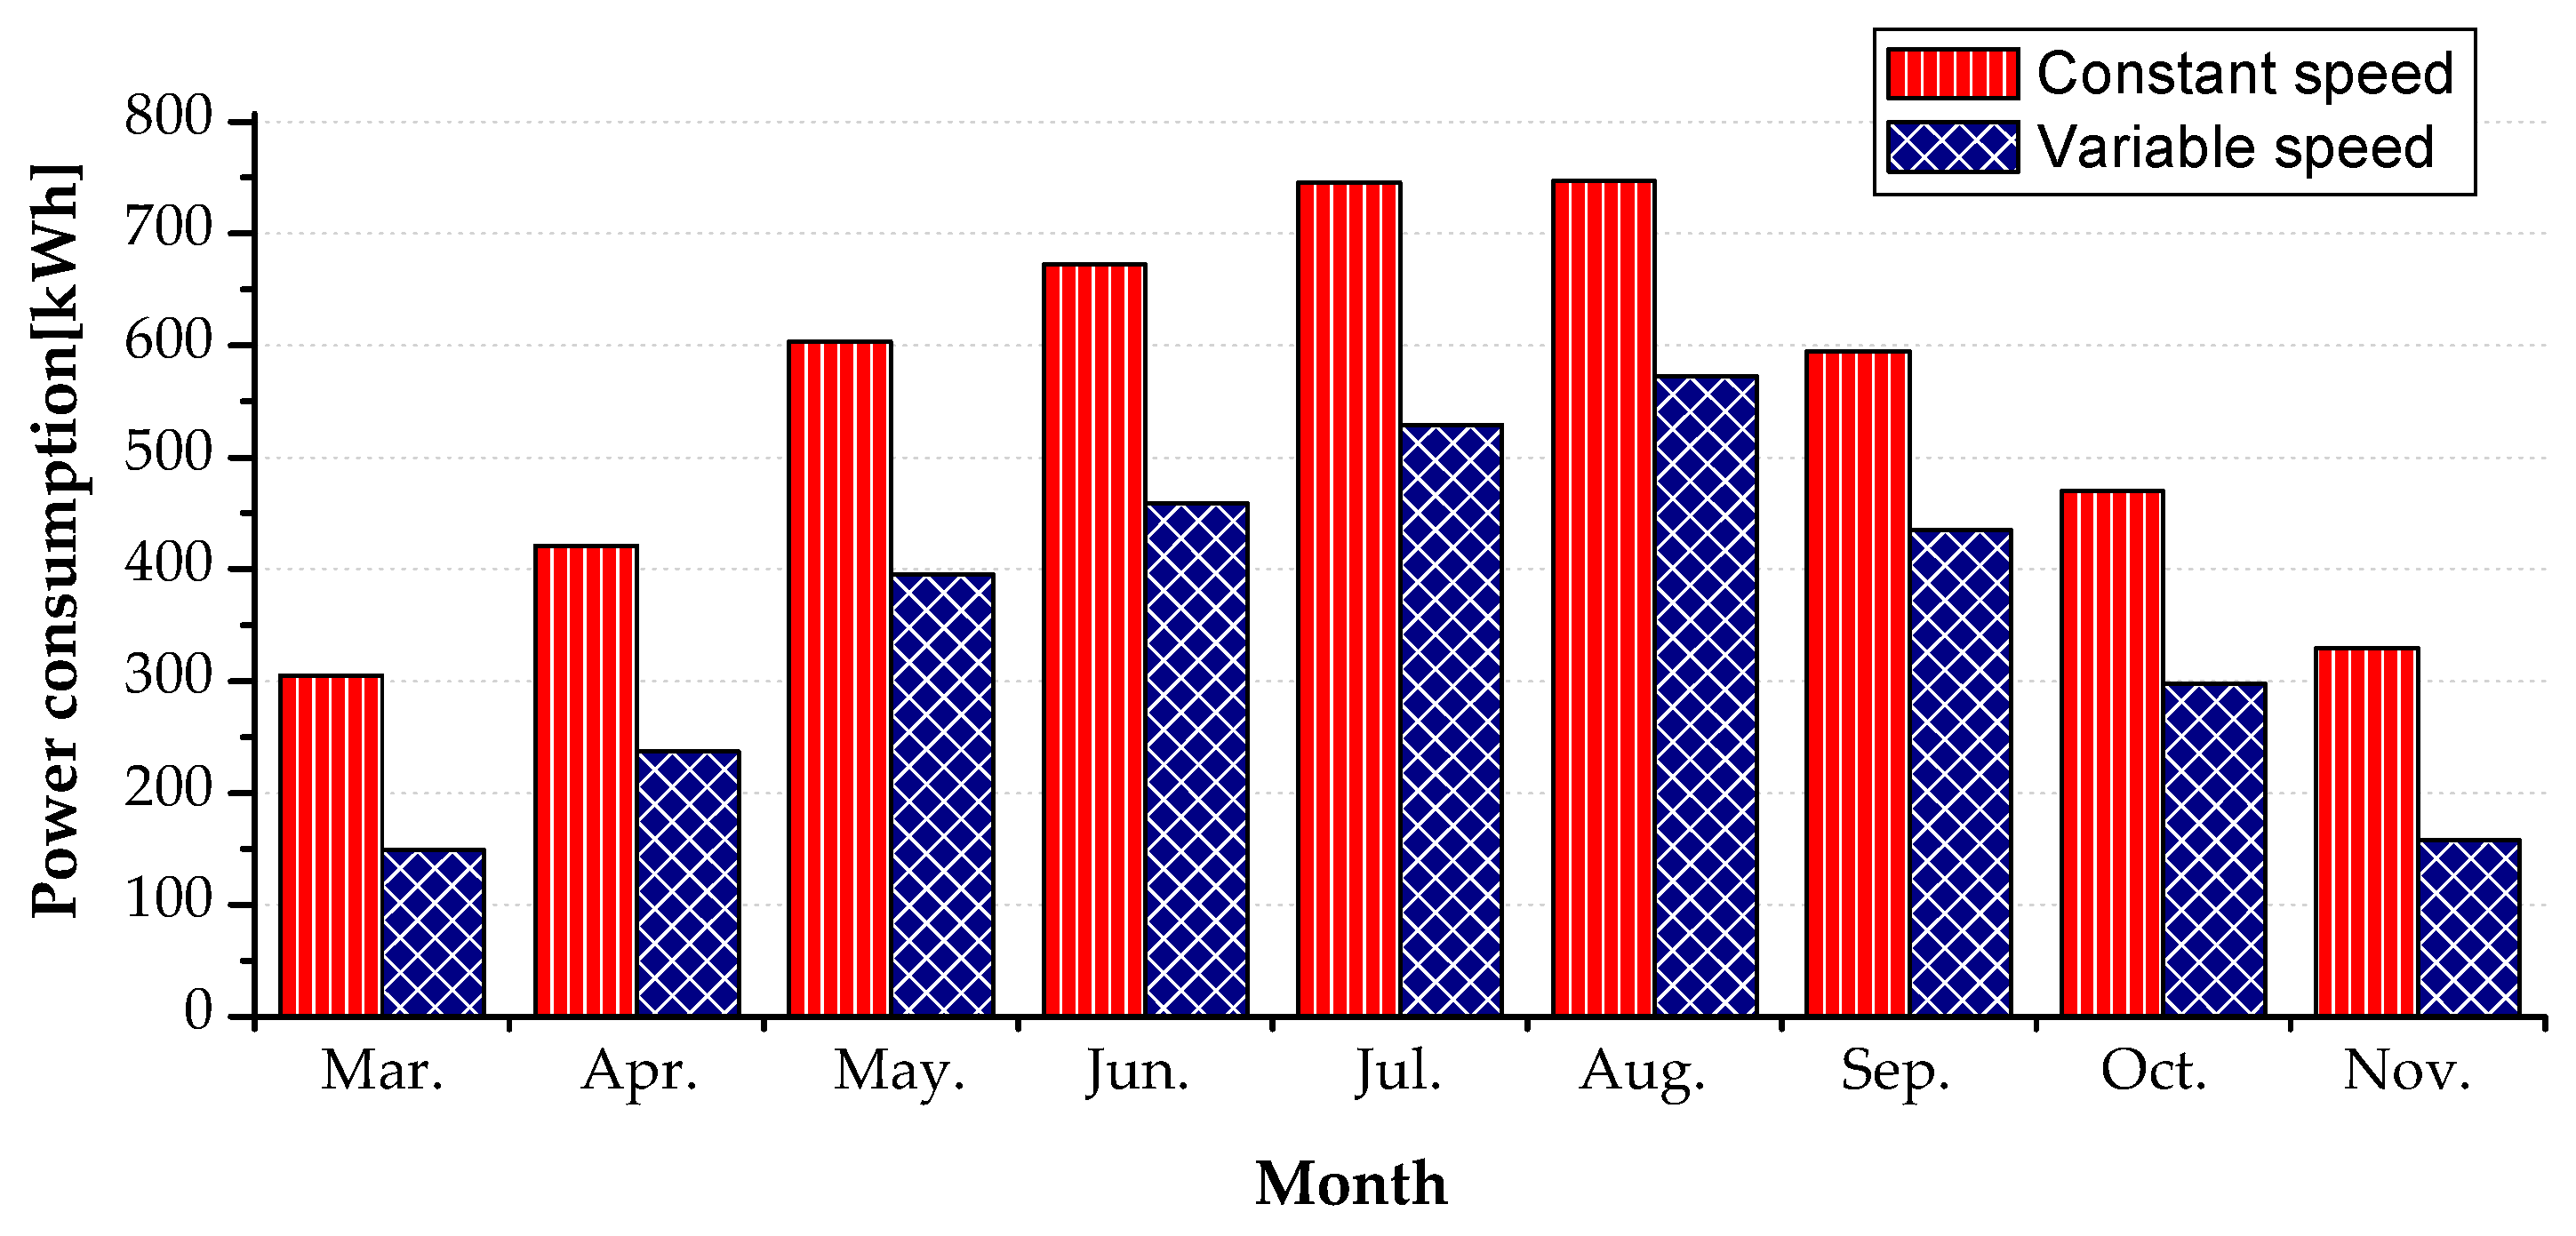
The power inputs in the above graph could be averaged to obtain the daily average power consumption. Table 6 shows the monthly power consumption, obtained by multiplying 30 (days) with the daily average power consumption. During the cooling seasons of Seoul (four months) and Riyadh (nine months), the monthly power consumptions of the constant- and variable-speed air conditioners were compared (Figure 10 and Figure 11). Considering the air conditioners’ specifications in Table 5, the variable-speed air conditioner had a higher EER than that of the constant-speed air conditioner by approximately 5%. Therefore, the relative difference was subtracted by –5% in Table 6. In Riyadh, the variable-speed air conditioner has a smaller energy consumption by 18.3% in August and 47.1% in November. This implies that the variable-speed air conditioner provides a higher energy saving than that of the constant-speed air conditioner in the part-load condition. Seoul in August is less hot than Riyadh (Figure 5a and Figure 6a), which leads to a larger energy saving (36.3%) of the variable-speed air conditioner. In Saudi Arabia and Korea, total inverter energy savings of 28.9% and 44.5% were achieved during the cooling season, respectively. These results were very similar to those in the study for Istanbul and Saudi Arabia, where energy savings of 11–38% and 22–50%, respectively, were obtained for an inverter air conditioner in a real office usage [6,8].
3.3. Economic Analysis
In Korea, most of the household air conditioners in the market are inverters and the actual operation time is supposed to be remarkably different from the test condition. As the electricity rates in Korea are high, the conditioners do not operate during the whole day, but only when it is very hot. However, we carried out an economic analysis in both countries. The results of the economic analysis were based on the experimental results.
Based on a simple payback period analysis, the initial investment and running costs were calculated to compare the economic benefits of the different types of air conditioners.
The initial investment cost was the average price of an 18,000 British-thermal-unit (BTU)/h air conditioner sold in Korea and in Saudi Arabia; the annual operation cost was calculated based on the monthly power consumption (Table 7 and Table 8). To calculate the annual operation cost, electricity rates proposed by the power authorities of both countries were employed [24,25].
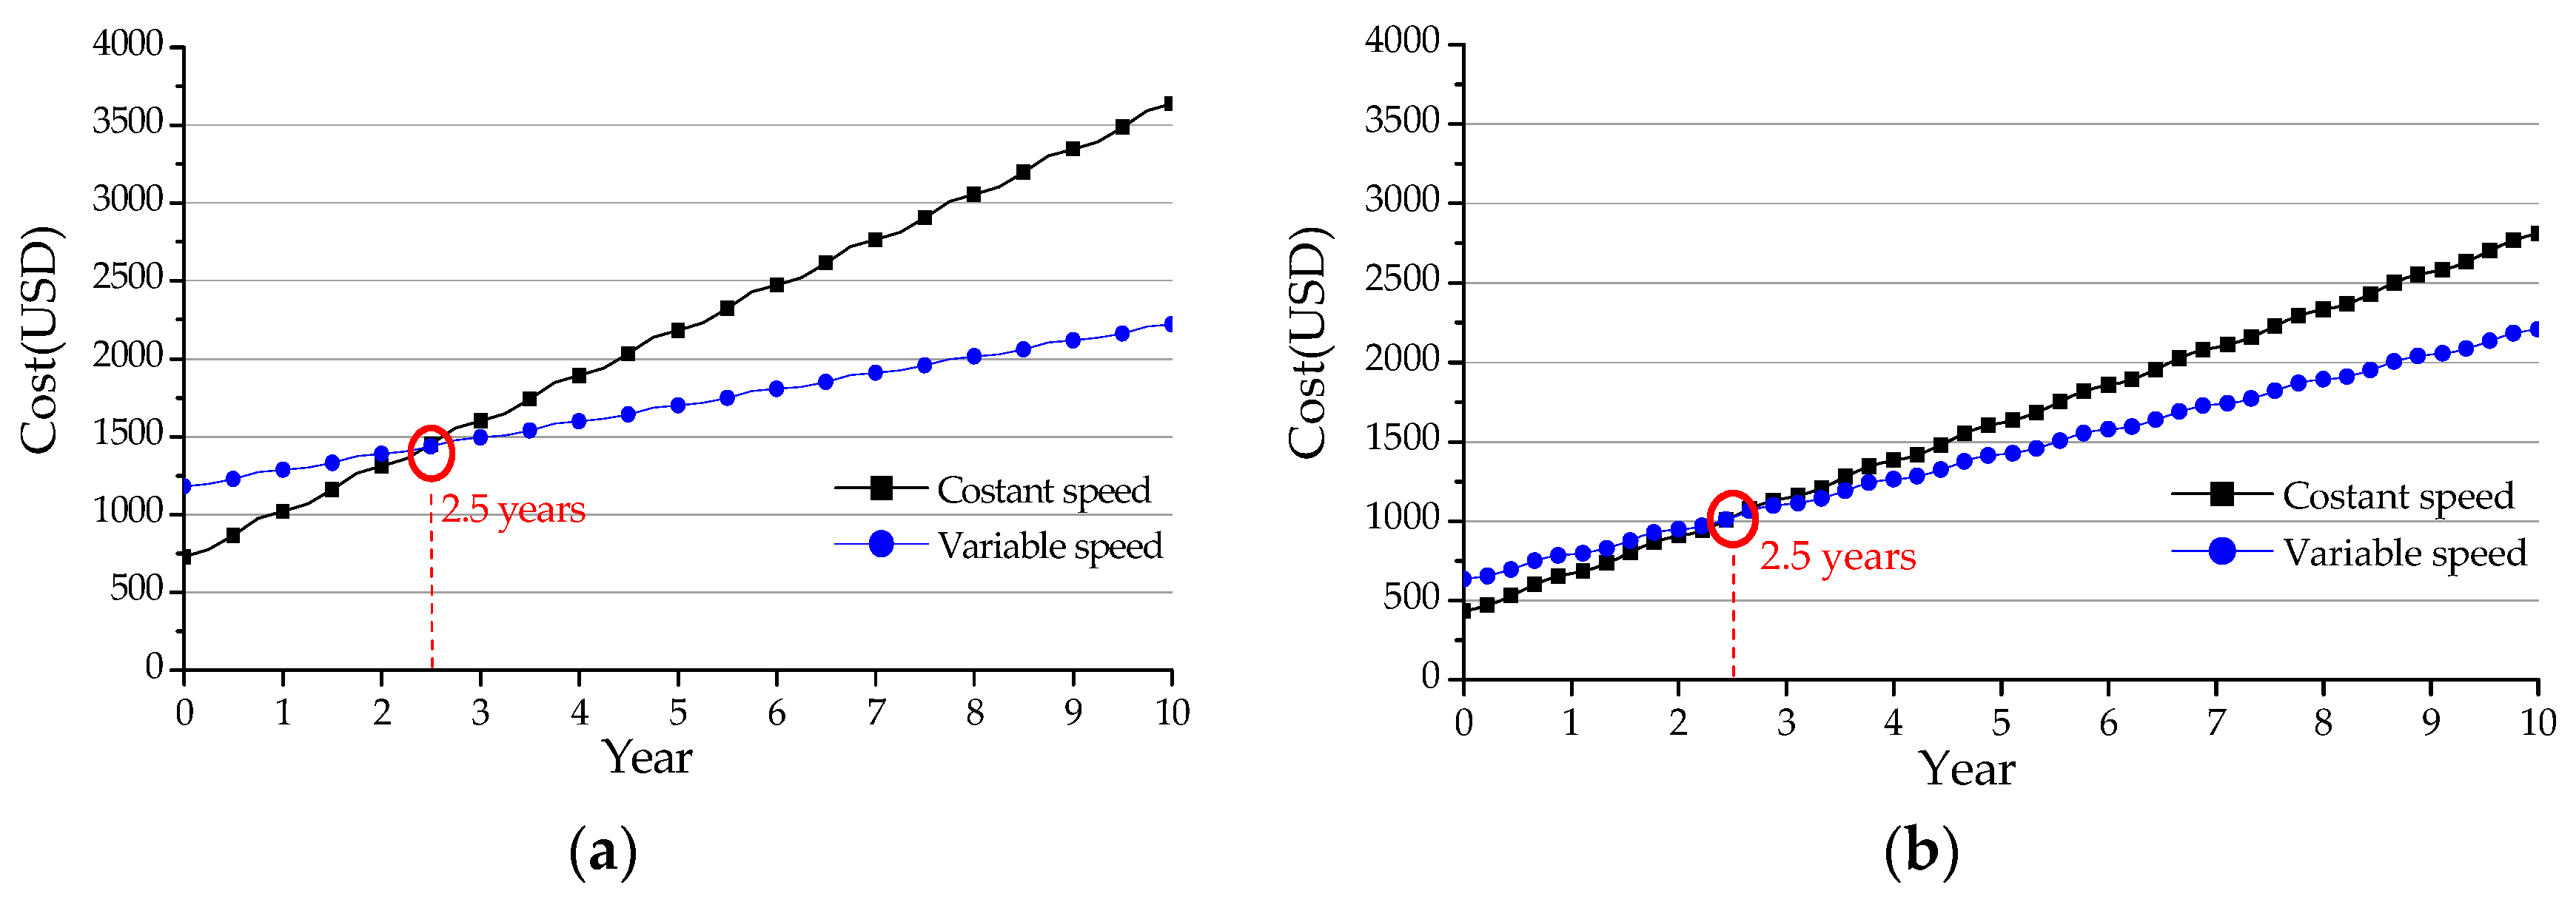
The results of the economic analysis for both types (constant, variable) of air conditioners are shown in Figure 12.
With respect to the constant-speed air conditioner, the payback period of the inverter type was 2.5 years in both countries. For the whole lifetime (10 years, assumed using the usual warranty period for the compressor), in Korea and Saudi Arabia, the inverter air conditioner is 1400 USD and 600 USD more economical than the constant-speed air conditioner, respectively.
A total of 21 million of split and window air conditioners are used in Saudi Arabia, while the inverter type is rarely used owing to its high initial cost. If all of the constant-type air conditioners were replaced by inverter-type air conditioners, the power consumption could be reduced by 34.8 TWh per year (the average electric consumption can be obtained by the employed models) [26].
4. Conclusions
In this study, the energy saving effect of the inverter (variable-speed) air conditioner with respect to the constant-speed air conditioner was analyzed. The ambient temperature and building cooling load were obtained using TRNSYS climate data and simulation. The results were obtained in the precisely controlled air-enthalpy-type test room (outdoor side: Temperature-controlled, indoor side: Cooling-load-controlled) with specific dimensions, which contained the air conditioner set at the temperature of 26 °C throughout the day. For the Korean and Saudi Arabian cooling periods of four and nine months, respectively, TRNSYS simulations and experiments in the air-enthalpy test room were carried out. In standards such as ISO, EN and ASHRAE, methods are introduced to determine the part-load efficiency of an air conditioner. However, in this study, we directly measured the actual air conditioner energy consumption using a real climate environment rather than calculation of the SEER based on some test points.
The conclusions of this study can be summarized as follows:
- The variable-speed (inverter) air conditioner was more effective than the constant-speed air conditioner in the months and location of part-load operation; in all of the preset test cases, it led to a smaller energy usage.
- Inverter energy savings of 18.3–47.1% and 36.3–51.7% were observed during the Riyadh’s (March–November) and Seoul’s (June–September) cooling months, respectively.
- The energy savings depended on the month; larger energy savings were observed before and after the summer peak. Larger energy savings were observed in the months and location of part-load operation.
- With respect to the constant-speed air conditioner, the payback period of the inverter type was 2.5 years in both countries. For whole lifetime (10 years, assumed using the usual warranty period for the compressor), in Korea and Saudi Arabia, the inverter-type air conditioner is 1400 USD and 600 USD more economical than the constant-speed air conditioner, respectively.
It is widely known that no differences in energy efficiency between constant-speed and inverter-type air conditioners exist in countries with hot climates such as Saudi Arabia. However, according to the results of this study, even in hot countries, the building load and outside temperature change with time. Consequently, energy saving was obtained by part-load operation of the inverter air conditioner in the morning and night periods. The actual energy consumption analysis through the proposed approach can provide good empirical evidence to establish air conditioner policies in different countries.
Author Contributions
J.L., M.S.Y. and Y.N. defined the performance analysis models, developed the methodology, and wrote the full manuscript. The author T.A.Q. checked the contents regarding Saudi Arabia.
Funding
This research was funded by Basic Research Project (No.CBS18126) of the Korea Testing Laboratory (KTL).
Conflicts of Interest
The authors declare no conflict of interest.
References
- SASO. SASO 2663 Energy Labelling and Minimum Energy Performance Requirements for Air-Conditioners; Metrology and Quality Organization: Riyadh, Saudi Arabia, 2012. [Google Scholar]
- ISO. ISO 5151 Non-Ducted Air Conditioners and Heat Pumps—Testing and Rating for Performance; International Organization for Standardization: Geneva, Switzerland, 2017. [Google Scholar]
- ISO. ISO 16358-1 Air-Cooled Air Conditioners and Air-to-Air Heat Pumps—Testing and Calculating Methods for Seasonal Performance Factors—Part 1: Cooling Seasonal Performance Factor; International Organization for Standardization: Geneva, Switzerland, 2013. [Google Scholar]
- BSI. BS EN 141825 Air Conditioners, Liquid Chilling Packages and Heat Pumps, with Electrically Driven Compressors, for Space Heating and Cooling—Testing and Rating at Part Load Conditions and Calculation of Seasonal Performance; British Standard Institution: London, UK, 2016. [Google Scholar]
- ASHRAE. SHRAE 116 Methods of Testing for Rating Seasonal Efficiency of Unitary Air-conditioners and Heat pumps; American Society of Heating, Refrigerating and Air-Conditioning Engineers: Atlanta, GA, USA, 2010. [Google Scholar]
- Chen, I.Y.; Chen, Y.M.; Chang, Y.J.; Wei, C.S.; Wang, C.C. A comparative study between a constant-speed air-conditioner and a variable-speed air-conditioner. ASHRAE Trans. 2009, 115, 326–332. [Google Scholar]
- Yurtseven, M.B.; Erkin, E.; Acuner, E.; Mete, S.; Onaygil, S. An experimental investigation of energy saving potentials for room type variable-speed air conditioners in public offices: A case study from Istanbul. Energy Build. 2014, 68, 165–171. [Google Scholar] [CrossRef]
- Al-Tamimi, O.; Kassas, M. Experimental investigation of energy consumption of VFD ON/OFF A/C systems in residential area in Saudi Arabia. In Proceedings of the 2018 IEEE International Conference on Industrial Technology (ICIT), Lyon, France, 20–22 February 2018. [Google Scholar]
- Khatri, R.; Joshi, A. Energy performance comparison of inverter based variable refrigerant flow unitary AC with Constant Volume Unitary AC. Energy Procedia 2017, 109, 18–26. [Google Scholar] [CrossRef]
- Wu, J.; Liu, C.; Li, H.; Ouyang, D.; Cheng, J.; Wang, Y.; You, S. Residential air-conditioner usage in China and efficiency standardization. Energy 2017, 119, 1036–1046. [Google Scholar] [CrossRef]
- Oropeza-Perez, I. Comparative economic assessment of the energy performance of air-conditioning within the Mexican residential sector. Energy Rep. 2016, 2, 147–154. [Google Scholar] [CrossRef] [Green Version]
- Shah, N.; Abhyankar, N.; Park, W.; Phadke, A.; Diddi, S.; Ahuja, D.; Mukherjee, P.; Walia. Cost-Benefit of Improving the Efficiency of Room Air Conditioners (Inverter and Fixed Speed) in India. Available online: https://escholarship.org/uc/item/2v6646cf (accessed on 18 March 2019).
- Alrashed, F.; Asif, M. Analysis of critical climate related factors for the application of zero-energy homes in Saudi Arabia. Renew. Sustain. Energy Rev. 2015, 41, 1395–1403. [Google Scholar] [CrossRef]
- Korea Meteorological Administration. Available online: http://www.weather.go.kr/weather/climate/average_30years.jsp?yy_st=2011&stn=108&norm=M&obs=0&mm=5&dd=25&x=25&y=5 (accessed on 26 December 2018).
- Weatherbase. Available online: http://www.weatherbase.com/weather/weather.php3?s=83404&refer=&units=us (accessed on 26 December 2018).
- TRNSYS. TRNSYS 17. Volume 5. Multizone Building Modeling with type56 and TRNBuild; Solar Energy Laboratory, University of Wisconsin-Madoson: Madison WI, USA, 2012. [Google Scholar]
- TRNSYS. TRNSYS 17. Volume 8. Weather data; Solar Energy Laboratory, University of Wisconsin-Madoson: Madison WI, USA, 2012. [Google Scholar]
- Alaa, M.S. Domestic Window Design and Interior Daylight in Jeddah: Designing for Saudi Women. Available online: https://www.google.com.tw/url?sa=t&rct=j&q=&esrc=s&source=web&cd=1&cad=rja&uact=8&ved=2ahUKEwiMpIido9nhAhWEH3AKHdA-BhoQFjAAegQIAxAC&url=https%3A%2F%2Fuhra.herts.ac.uk%2Fbitstream%2Fhandle%2F2299%2F20278%2F14071284%2520Shatwan%2520Alaa%2520final%2520version%2520of%2520submission.pdf%3Fsequence%3D1%26isAllowed%3Dy&usg=AOvVaw39C0vhujoZmsVNzWbUXWEN (accessed on 26 December 2018).
- Huh, J.; Mun, S. Energy demand analysis according to window size and performance for Korean multi-family buildings. Archit. Res. 2013, 15, 201–206. [Google Scholar] [CrossRef] [Green Version]
- MOLIT. MOLIT Notice 2017-71 Notification for the Energy Saving Design Standard of Korean Buildings; Korea Ministry of Land, Infrastructure and Transportation: Sejong-si, South Korea, 2017. Available online: http://www.law.go.kr/admRulLsInfoP.do?admRulSeq=2100000074054#AJAX (accessed on 26 December 2018).
- Aldossary, N.A.; Rezgui, Y.; Kwan, A. Establishing domestic low energy consumption reference levels for Saudi Arabia and the Wider Middle Eastern Region. Sustain. Cities Soc. 2017, 28, 265–276. [Google Scholar] [CrossRef] [Green Version]
- Saudi Energy Efficiency Center (SEEC). Energy Consumption Rationalization Methods in the Public Buildings (Residential, Governmental, and Commercial); Saudi Energy Efficiency Center: Riyadh, Saudi Arabia, 2018. Available online: https://www.seec.gov.sa/en/blog/buildings (accessed on 18 March 2019).
- ISO. ISO 7730 Ergonomics of the Thermal Environment—Analytical Determination and Interpretation of Thermal Comfort Using Calculation of the PMV and PPD Indices and Local Thermal Comfort Criteria; International Organization for Standardization: Geneva, Switzerland, 2005. [Google Scholar]
- Saudi Electricity Company. Billing Service, Consumption Tariffs Table; Saudi Electricity Company: Riyadh, Saudi Arabia, 2018; Available online: https://www.se.com.sa/en-us/customers/Pages/TariffRates.aspx (accessed on 18 March 2019).
- Korea Electric Power Corporation (KEPCO). General Service, Electric Rates Table; Korea Electric Power Corporation (KEPCO): Naju-si, South Korea, 2017; Available online: http://cyber.kepco.co.kr/ckepco/front/jsp/CY/E/E/CYEEHP00201.jsp (accessed on 26 December 2018).
- General Authority for Statistics. Household Energy Survey 2017; General Authority for Statistics: Riyadh, Saudi Arabia, 2017. Available online: https://www.stats.gov.sa/en/5654 (accessed on 26 December 2018).
Figure 1.
Basic model for the analysis.

Figure 2.
Air-enthalpy type test room used for the experiment.

Figure 3.
Air-enthalpy-type test room: (a) Korea/International Laboratory Accreditation Cooperation (ILAC) accredited chamber; (b) test sample.
Figure 3.
Air-enthalpy-type test room: (a) Korea/International Laboratory Accreditation Cooperation (ILAC) accredited chamber; (b) test sample.

Figure 4.
Models of households in (a) Seoul and (b) Riyadh.

Figure 5.
(a) Seoul outdoor temperatures; (b) Seoul building cooling loads obtained by the TRNSYS simulation.
Figure 5.
(a) Seoul outdoor temperatures; (b) Seoul building cooling loads obtained by the TRNSYS simulation.

Figure 6.
(a) Riyadh outdoor temperatures; (b) Riyadh building cooling loads obtained by the TRNSYS simulation.
Figure 6.
(a) Riyadh outdoor temperatures; (b) Riyadh building cooling loads obtained by the TRNSYS simulation.

Figure 7.
Experimental results for Riyadh in May: (a) Constant speed; (b) variable speed.

Figure 8.
Experimental results for Riyadh in August: (a) Constant speed; (b) variable speed.

Figure 9.
Experimental results for Seoul in August: (a) Constant speed; (b) variable speed.

Figure 10.
Monthly power consumption during the cooling season in Seoul.

Figure 11.
Monthly power consumption during the cooling season in Riyadh.

Figure 12.
Periods of recovery of the initial investment: (a) Korea; (b) Saudi Arabia.


Table 1.
Measurement error of measuring equipment.
| Item | Model | Manufacturer | Measurement Uncertainty |
|---|---|---|---|
| Temperature (RTD) | Pt100 | CHINO | ±0.1 °C |
| Power consumption | WT230 | Yokogawa | ±0.6 V ±0.04 A |
| KDY-AC | Light star | ±1.1 W | |
| Data logger | DA100 | Yokogawa | 0.05% of reading, 2 digits |
Table 2.
Measurement results of the test room components.
| Categories | Description | Measured (W) | Total (W) |
|---|---|---|---|
| Test unit | Cooling capacity (Sensible) | 5680 ± 5 | 5680 ± 5 |
| Cooling capacity (latent) | 231 ± 10 | 231 ± 10 | |
| Indoor room heating components | Heater (EH) | 4175 ± 100 | |
| AHU’s fan (EAF) | 1150 ± 20 | ||
| Turbo fan (ETF) | 250 ± 10 | 5760 ± 145 | |
| Heat penetration | 15 ± 5 | ||
| Air sampler fan | 170 ± 10 | ||
| Condensate | - | 213 ± 10 | 213 ± 10 |
Table 3.
Temperatures in Seoul and Riyadh (average high, daily mean, average low). *
| City | Temp. | Jan. | Feb. | Mar. | Apr. | May. | Jun. | Jul. | Aug. | Sep. | Oct. | Nov. | Dec. |
|---|---|---|---|---|---|---|---|---|---|---|---|---|---|
| Seoul | High (°C) | 2 | 5 | 10 | 18 | 23 | 27 | 29 | 30 | 26 | 20 | 12 | 4 |
| Mean (°C) | −2 | 0 | 6 | 13 | 18 | 22 | 25 | 26 | 21 | 15 | 7 | 0 | |
| Low (°C) | −6 | −3 | 2 | 8 | 13 | 18 | 22 | 22 | 17 | 10 | 3 | −3 | |
| Riyadh | High (°C) | 19 | 23 | 27 | 32 | 38 | 41 | 43 | 42 | 40 | 34 | 27 | 22 |
| Mean (°C) | 14 | 17 | 21 | 27 | 32 | 34 | 36 | 36 | 33 | 28 | 22 | 17 | |
| Low (°C) | 11 | 15 | 21 | 26 | 28 | 29 | 27 | 26 | 20 | 16 | 11 | 9 |
* Climate data from Wikipedia (“Climate of Seoul”, “Climate of Saudi Arabia”); originally from the Weather base.
Table 4.
TRNSYS simulation conditions in Seoul and Riyadh.
| Input variables | Seoul | Riyadh |
|---|---|---|
| Space (single zone) | 10 m × 8 m × 2.5 m | 10 m × 8 m × 2.5 m |
| Window | 60% of the southern wall area—15 m2 | 30% of the southern wall area—7.5 m2 |
| Floor of space | Located between floors (Up and down insulations) | Located between floors (Up and down insulations) |
| Glass | 1.20 W/m2K | 1.720 W/m2K |
| Wall | 0.21 W/m2K | 0.345 W/m2K |
| Room temperature & humidity | 26 °C & 60%R.H. | 26 °C & 60%R.H. |
| Heating & Light element | 25 W/m2 | 25 W/m2 |
| Persons | 4 persons (Sensible: 65 W/person Latent: 55 W/person) | 4 persons (Sensible: 65 W/person Latent: 55 W/person) |
| Infiltration | 0.4 (1/h) | 0.4 (1/h) |
| Ventilation | 0.6 (1/h) | 0.6 (1/h) |
Table 5.
Specifications of the constant and variable-speed air conditioners.
| Contents | Constant Speed | Variable Speed |
|---|---|---|
| Electricity | Single phase, 230 V, 60 Hz | Single phase, 230 V, 60 Hz |
| Rated cooling capacity (T1 climate) | 5130 W | 5275 W |
| Rated power input (T1 climate) | 1520 W | 1,490 W |
| Rated current (T1 climate) | 6.8 A | 6.7 A |
| EER (T1 climate) | 3.375 W/W | 3.540 W/W |
| Cooling capacity (T3 climate) | 4420 W | 4484 W |
| Power input (T3 climate) | 1820 W | 1754 W |
| Current (T3 climate) | 8.14 A | 7.8 A |
| EER (T3 climate) | 2.429 W/W | 2.556 W/W |
| Maximum power input | 2610 W | 2900 W |
| Maximum current | 11.68 A | 14.0 A |
| Refrigerant | R410a, 0.85 kg | R410a, 0.95 kg |
| Product type | Wall mount split type | Wall mount split type |
| Annual energy consumption by SASO energy label | 4104 kWh/year | 4023 kWh/year |
Table 6.
Monthly power consumption (kWh) during the cooling season.
| City | Air Conditioner Type | Mar. | Apr. | May. | Jun. | Jul. | Aug. | Sep. | Oct. | Nov. | Tot. |
|---|---|---|---|---|---|---|---|---|---|---|---|
| Seoul | Constant speed | - | - | - | 341 | 490 | 542 | 319 | - | - | 1692 |
| Variable speed | - | - | - | 150 | 249 | 318 | 138 | - | - | 855 | |
| (Con.-Var.)/Con. × 100% | - | - | - | 56.0 | 49.2 | 41.3 | 56.7 | - | - | 49.5 | |
| −5% compensation | - | - | - | 51.0 | 44.2 | 36.3 | 51.7 | - | - | 44.5 | |
| Riyadh | Constant speed | 305 | 421 | 603 | 672 | 745 | 747 | 595 | 470 | 330 | 4888 |
| Variable speed | 149 | 237 | 395 | 459 | 529 | 573 | 435 | 298 | 158 | 3233 | |
| (Con.-Var.)/Con. × 100% | 51.1 | 43.7 | 34.5 | 31.7 | 28.9 | 23.3 | 26.9 | 36.6 | 52.1 | 33.9 | |
| −5% compensation | 46.1 | 38.7 | 29.5 | 26.7 | 23.9 | 18.3 | 21.9 | 31.6 | 47.1 | 28.9 |
Table 7.
Calculation results of the simple payback period (Seoul).
| Categories | Initial Cost (USD) | Running Cost (USD/year) | Payback Period (Years) |
|---|---|---|---|
| Constant speed | 727 | 291 | Basis |
| Variable speed | 1182 | 104 | 2.5 |
Table 8.
Calculation results of the simple payback period (Riyadh).
| Categories | Initial Cost (USD) | Running Cost (USD/year) | Payback Period (Years) |
|---|---|---|---|
| Constant speed | 432 | 238 | Basis |
| Variable speed | 635 | 157 | 2.5 |
© 2019 by the authors. Licensee MDPI, Basel, Switzerland. This article is an open access article distributed under the terms and conditions of the Creative Commons Attribution (CC BY) license (http://creativecommons.org/licenses/by/4.0/).
Share and Cite
MDPI and ACS Style
Lim, J.; Yoon, M.S.; Al-Qahtani, T.; Nam, Y. Feasibility Study on Variable-Speed Air Conditioner under Hot Climate based on Real-Scale Experiment and Energy Simulation. Energies 2019, 12, 1489. https://doi.org/10.3390/en12081489
AMA Style
Lim J, Yoon MS, Al-Qahtani T, Nam Y. Feasibility Study on Variable-Speed Air Conditioner under Hot Climate based on Real-Scale Experiment and Energy Simulation. Energies. 2019; 12(8):1489. https://doi.org/10.3390/en12081489
Chicago/Turabian StyleLim, Jaehun, Myung Sup Yoon, Turki Al-Qahtani, and Yujin Nam. 2019. "Feasibility Study on Variable-Speed Air Conditioner under Hot Climate based on Real-Scale Experiment and Energy Simulation" Energies 12, no. 8: 1489. https://doi.org/10.3390/en12081489
Note that from the first issue of 2016, this journal uses article numbers instead of page numbers. See further details here.