


Abstract
Background. Chronic kidney disease (CKD) is an important predictor of end-stage renal disease, as well as a marker of increased mortality. The New Opportunities for Early Renal Intervention by Computerised Assessment (NEOERICA) project aimed to assess whether people with undiagnosed CKD who might benefit from early intervention could be identified from GP computer records.
Methods. The simplified Modification of Diet in Renal Disease (MDRD) equation was used to estimate glomerular filtration rate (GFR) and determine stage of CKD in patients from 12 practices in Surrey, Kent and Greater Manchester with SCr recorded in their notes. Further data were extracted on associated co-morbidities and potentially modifiable risk factors.
Results. One quarter (25.7%; 28 862/112 215) had an SCr recorded and one in five (18.9%) of them had a GFR <60 ml/min/1.73 m2 (equivalent to Stage 3–5 CKD), representing 4.9% of the population. Only 3.6% of these were recorded as having renal disease. Three-quarters (74.6%; 4075/5449) of those with Stage 3–5 CKD had one or more circulatory diseases; 346 were prescribed potentially nephrotoxic drugs and over 4000 prescriptions were issued for drugs recommended to be used with caution in renal impairment.
Conclusions. Patients with CKD can be identified by searching GP computer databases; along with associated co-morbidities and treatment. Results revealed a similar rate of Stage 3–5 CKD to that found previously in the USA. The very low rate of recording of renal disease in patients found to have CKD indicates scope for improving detection and early intervention.
de Lusignan S, Chan T, Stevens P, O'Donoghue D, Hague N, Dzregah B, Van Vlymen J, Walker M and Hilton S. Identifying patients with chronic kidney disease from general practice computer records. Family Practice 2005; 22: 234–241.
Introduction
Chronic kidney disease (CKD) is associated with significantly increased mortality and morbidity.1–3 It is a major predictor for end-stage renal disease (ESRD) but death in pre-ESRD patients with CKD is predominantly due to cardiovascular disease.2,4 The prevalence and incidence of cardiovascular disease are both increased in patients with CKD.5,6 Evidence from community-based studies demonstrates an inverse relationship between renal function and adverse cardiovascular outcome.7 These studies show a marked increase in cardiovascular morbidity and anaemia at levels of estimated glomerular filtration rate of less than 60 ml/min/1.73 m2. Cigarette smoking is an important risk factor and is associated with an adverse outcome in CKD; a community-based, observational study indicted that 31% of attributable risk in CKD was due to smoking.8 However, despite its impact, little has been known until recently about the prevalence of CKD in the community.4 When CKD has been looked for in populations, it has been found to be greatly under diagnosed.4
The New Opportunities for Early Renal Intervention by Computerised Assessment (NEOERICA) project aims to improve the identification and management of people with CKD by capturing and interpreting relevant data held in general practice computer records. A cost-effective way of identifying those at risk and targeting them for intervention is needed because of the rising prevalence of ESRD1 and the mortality and morbidity associated with CKD.1–3 If it were possible to easily identify patients with CKD, they might benefit from medication review, improved management of cardiovascular risk factors and assessment as to whether they have proteinuria, or complications associated with chronic renal failure, such as renal bone disease.
Most general practices in the UK are now computerised, with many practices recording all consultations on computer, and increasing numbers receiving pathology results electronically.9 Glomerular filtration rate (GFR) can be used to estimate renal function10 and the data needed to calculate GFR and to identify relevant risk factors and co-morbidities should, in theory, be recorded in GP computer records but this has not previously been investigated. This study set out to assess whether it was possible to identify patients with CKD from GP computer records, to find the prevalence of CKD and to identify risk factors associated with CKD.
Methods
Kidney function was assessed using a simple formula to estimate GFR (Box 1). The simplified MDRD (Modification of Diet in Renal Disease) equation was used11 because it required less information than other methods of calculating GFR; needing only serum creatinine (SCr), sex, age, and ethnic group (Box 2).
Glomerular Filtration Rate (GFR)
(http://www.kidney.org/professionals/doqi/kdoqi/p5_lab_g4.htm)
Estimates of GFR are the best overall indices of the level of kidney function.
The level of GFR should be estimated from prediction equations that take into account the serum creatinine concentration and some or all of the following variables: age, gender, race, and body size.
Notes:
Units of GFR are: ml/min/1.73 m2 (GFR is calculated for a given body surface area).
Patients were grouped into the five stages of CKD as defined by the Kidney Disease Outcomes Quality Initiative (KDOQI).12 Stage 1 (GFR >90 ml/min/1.73 m2) and Stage 2 (GFR 60–89 ml/min/1.73 m2) require additional data about kidney damage as well as estimation of GFR to make the diagnosis. Stages 3–5 are based on level of GFR alone (GFR 30–59, 15–29, and <15 ml/min/1.73 m2, respectively). Pilot data suggested that additional data about kidney damage were not recorded consistently, so the study focussed on comparing patients with GFR above and below the threshold of 60 ml/min/1.73 m2 GFR threshold. This threshold was chosen because a diagnosis of Stage 3–5 CKD, unlike Stage 1 and 2, can be made on the basis of GFR alone. For simplicity, those with normal or mildly impaired GFR are referred to as ‘GFR ≥60’ and those with GFR <60 ml/min/1.73 m2 as ‘Stage 3–5 CKD’.
Risk factors associated with CKD were defined from a literature search and consensus views of an expert group of clinicians (PS and DO'D). In order to build a picture of CKD, associated co-morbidity, and treatment, a list of 168 variables to be collected was defined.
Extracted data were grouped into themes: The study was approved by local research ethics committees in Kent, West Surrey and Manchester.
Cardiovascular disease (ischaemic heart disease, cerebrovascular disease, peripheral vascular disease, and heart failure), hypertension, and diabetes. This included established disease as well as predisposing risk factors: blood pressure over the 130/85 mmHg13 and 140/90 mmHg14 treatment thresholds, raised total cholesterol, smoking, and, for diabetes, obesity.
Anaemic patients: based on the World Heath Organization (WHO) definition (haemoglobin levels <12 g/dl for non-pregnant females and <13 g/dl for males and post-menopausal women) and the KDOQI13 and European Best Practice Guidelines15 threshold for consideration of treatment of anaemia (haemoglobin <11 g/dL).
Drugs that are known to be nephrotoxic and those that should be prescribed with caution in renal disease, as defined in the British National Formulary.16
Kidney disease already known to the practice, either by having a disease code, a relevant operation (e.g. kidney transplant), or therapy that indicated that patients had renal disease.
Post-renal disease (e.g. ureteric obstruction,) and prostatic hypertrophy and prostate cancer in men.
MIQUEST (Morbidity Information Query and Export Syntax17), a Department of Health sponsored computer programme, was used to extract the data from GP practice databases. MIQUEST allows the same searches to be run on different makes of general practice computer systems. Customised searches—or, more properly, queries—were written for the study (NJH) using MIQUEST in its ‘remote’ setting, which allows only anonymised data to be extracted. Only structured, or ‘Read-Coded’, data can be extracted using MIQUEST. Free-text, or narrative data cannot be searched, and therefore information still in paper records, or in text, was not included in the searches.
The data were exported from the practice systems, and imported into a bespoke Microsoft Access database (BD and JvV) within which a flat-file was created. This was then exported into SPSS (Statistical Package for Social Sciences, Version 12). The data were cleaned—by removing duplicates, and by manual translation of out-of-range data (e.g. one computer system exported patients' heights in centimetres while others used metres)—and analysed (TC and SdeL.) The process of extracting, aggregating and analysing the data was developed and validated in other disease areas in the context of audit-based education.18,19
The dataset for every patient with an SCr measurement recorded was extracted and analysed. Additionally, a search was run to identify any patients with treated renal disease without a SCr measure recorded.
Results
The study population was taken from twelve general practices in three localities. Their combined age-sex profile was close to the national average (see Fig. 1).20 The study's three localities have different characteristics. Kent is an area of south-east England with more elderly than the national average (13.8% of the East Kent population is >70 years compared with 11.5% of the general population); Surrey is an affluent commuter area south-west of London; Greater Manchester represents a northern city population.
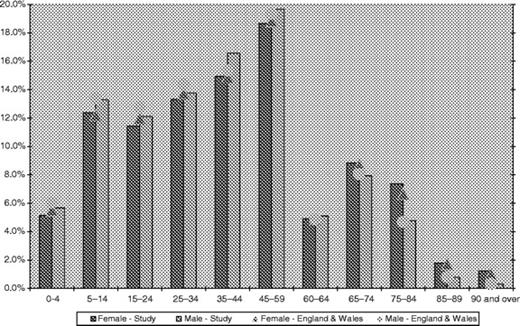
The age-sex distribution of the study population
SCr was recorded in 27.4% (30 757/112 215) of the overall population, but more frequently in the elderly (Table 1); 74.4% of recordings were in the last two years. A total of 1629 recordings had to be excluded because they had a zero value and another 266 had missing values, leaving 25.7% (28 862/112 215) of the population with a ‘valid’ SCr. 14 499 patients (12.9%) had valid SCr recordings at two different time points, and 8785 (7.8%) had three. Age and gender were recorded in all study subjects, weight in 80.1% (24 638/30 757) and height in 75.0% (23 076/30 757).
Age-sex distribution of the prevalence of creatinine recording and stage of CKD
| <45 years | 45–55 | 55–65 | 65–75 | 75–85 | >85 | Total | ||||||||
|---|---|---|---|---|---|---|---|---|---|---|---|---|---|---|
| Female | ||||||||||||||
| Population | 32 277 | 6798 | 6488 | 4988 | 4155 | 1700 | 56 406 | |||||||
| % valid creatinine | 15.1% | 33.9% | 43.2% | 56.7% | 62.8% | 50.9% | 28.9% | |||||||
| Normal GFR | 1945 | 365 | 193 | 118 | 68 | 15 | 2704 | |||||||
| Mildly reduced GFR | 2867 | 1773 | 2115 | 1737 | 1085 | 251 | 9828 | |||||||
| Stage 3 | 67 | 162 | 479 | 952 | 1387 | 555 | 3602 | |||||||
| Stage 4 | 5 | 1 | 13 | 18 | 61 | 44 | 142 | |||||||
| Stage 5 | 4 | 5 | 4 | 4 | 7 | 1 | 25 | |||||||
| All | 4888 | 2306 | 2804 | 2829 | 2608 | 866 | 16 301 | |||||||
| Male | ||||||||||||||
| Population | 34 276 | 7269 | 6554 | 4431 | 2660 | 619 | 55 809 | |||||||
| % valid creatinine | 9.4% | 29.4% | 42.1% | 56.1% | 61.2% | 51.9% | 22.5% | |||||||
| Normal GFR | 1770 | 541 | 480 | 206 | 85 | 5 | 3087 | |||||||
| Mildly reduced GFR | 1420 | 1509 | 2066 | 1765 | 891 | 140 | 7791 | |||||||
| Stage 3 | 27 | 83 | 208 | 486 | 621 | 164 | 1589 | |||||||
| Stage 4 | 4 | 5 | 4 | 17 | 28 | 11 | 69 | |||||||
| Stage 5 | 4 | 2 | 3 | 10 | 2 | 1 | 22 | |||||||
| All | 3225 | 2140 | 2761 | 2484 | 1627 | 321 | 12 558 | |||||||
All but three of the patients (28 859/28 862)—whose ages were invalid because they were obviously incorrect—had their GFR estimated using the simplified MDRD equation. Only 0.3% (88/28 862) of patients had ethnicity recorded, and all but four of these were of Asian, or mixed-Asian descent. Ethnicity data were not available for inclusion in the calculation of GFR and ethnic origin was therefore assumed to be nonafro-Caribbean. 18.9% (5449/28 859) of people with valid SCr levels had Stage 3–5 CKD, representing 4.9% of the general population.
The age-sex distribution of patients by Stage of CKD is shown in Table 1. The mean age of all patients with valid SCr levels was 57.0 > 18.9 (SD) years, with a male to female ratio of 0.77. The mean age of Stage 3–5 CKD patients was 74.4 > 11.62 (SD) years, with a male to female ratio of 0.45. To check for possible over-estimation of the number of people with Stage 3–5 CKD creatinine clearance was also estimated. In the 22 819 people with complete SCr, age, gender and weight data, creatinine clearance from the Cockcroft-Gault equation was <60 ml/min in 25.2% (5763/22 819), representing 5.1% of the general population. The similarity of this figure to that obtained using MDRD supports our decision to assign patients whose ethnicity is not recorded to non-Afrocarribean ethnicity.
Table 2 shows the availability of clinically relevant data in all 30 757 patients, and in those with Stage 3–5 CKD. Haemoglobin was recorded in 81.5% of patients with Stage 3–5 CKD, and 82.9% of those with a GFR ≥60. Anaemia was more common in Stage 3–5 CKD (P < 0.01 Pearson x2); 15.3% were anaemic using WHO criteria (Hb <12 g/dl females; <13 g/dl for males) and 3.8% would have required treatment according to the KDOQI13 and European Best Practice guidelines threshold16 (<11 g/dl). Only 3.3% of all patients had proteinuria and/or microalbuminuria recorded on the database as being tested, and only 5.2% had haematuria recorded as being tested. This meant it was not possible to reliably differentiate those with GFR ≥60 into Stage 1 and 2 CKD but they are shown, in Table 3, as being split into normal and mildly reduced GFR.
Availability of clinically relevant data from GP databases
| Subgroup | Patients with GFR ≥60 ml/min/1.73 m2 | Patients with GFR <60 ml/min/1.73 m2 | All | Linear by linear association | ||||||
|---|---|---|---|---|---|---|---|---|---|---|
| Qualitative description of GFR | Normal GFR (>90) | Mildly reduced GFR (60–89) | Moderately reduced GFR (30–59) | Severely reduced GFR (15–29) | Kidney failure GFR <15 | |||||
| Stage of CKD | Stage 3 | Stage 4 | Stage 5 | |||||||
| Number | 5791 | 17 619 | 5191 | 211 | 47 | 30 757 | ||||
| Prescription data | 5791 (100%) | 17 619 (100%) | 5191 (100%) | 211 (100%) | 47 (100%) | 30 757 (100%) | – | |||
| Blood pressure | 4944 (85.4%) | 16 938 (96.1%) | 5107 (98.4%) | 205 (97.2%) | 45 (95.7%) | 29 043 (94.4%) | P = 0.000 | |||
| Haemoglobin | 14866 (84.0%) | 14 529 (82.5%) | 4235 (81.6%) | 169 (80.1%) | 39 (83.0%) | 23 283 (75.7%) | P = 0.001 | |||
| Serum albumin | 4042 (69.8%) | 12 019 (68.2%) | 3527 (67.9%) | 139 (65.9%) | 32 (68.1%) | 20 540 (66.8%) | P = 0.024 | |||
| Potassium | 5198 (89.8%) | 15 899 (90.2%) | 4731 (91.1%) | 186 (88.2%) | 40 (85.1%) | 27 895 (90.7%) | P = 0.075 | |||
| Total cholesterol | 2945 (50.9%) | 9789 (55.6%) | 2971 (57.2%) | 128 (60.7%) | 24 (51.1%) | 16 838 (54.7%) | P = 0.000 | |||
| HDL cholesterol | 2096 (36.2%) | 7353 (41.7%) | 2241 (43.2%) | 88 (41.7%) | 15 (31.9%) | 12 567 (40.9%) | P = 0.000 | |||
| Blood glucose | 2545 (43.9%) | 8467 (48.1%) | 2783 (53.6%) | 111 (52.6%) | 24 (51.1%) | 15 055 (48.9%) | P = 0.000 | |||
| HbA1c | 623 (10.8%) | 2010 (11.4%) | 687 (13.2%) | 34 (16.1%) | 3 (6.4%) | 3569 (11.6%) | P = 0.000 | |||
| Microalbuminuria | 187 (3.2%) | 604 (3.4%) | 216 (4.2%) | 6 (2.8%) | 1 (2.1%) | 1017 (3.3%) | P = 0.026 | |||
| Haematuria | 231 (4.0%) | 936 (5.3%) | 383 (7.4%) | 25 (11.8%) | 10 (21.3%) | 1605 (5.2%) | P = 0.000 | |||
| Calcium | 1840 (31.8%) | 5598 (31.8%) | 1761 (33.9%) | 62 (29.4%) | 18 (38.3%) | 9976 (32.4%) | P = 0.032 | |||
| Phosphate | 1545 (26.7%) | 4731 (26.9%) | 1496 (28.8%) | 53 (25.1%) | 17 (36.2%) | 8510 (27.7%) | P = 0.016 | |||
| Bicarbonate | 672 (11.6%) | 1954 (11.1%) | 669 (12.9%) | 27 (12.8%) | 7 (14.9%) | 3673 (11.9%) | P = 0.031 | |||
Proportion of patients with cardiovascular disease, hypertension and diabetes with normal or mildly reduced GFR compared with those with Stage 3 to 5 Chronic Kidney Disease
| Subgroup | Patients with GFR ≥60 ml/min/1.73 m2 | Patients with GFR <60 ml/min/1.73 m2 | All | x2 | ||||||
|---|---|---|---|---|---|---|---|---|---|---|
| Qualitative description of GFR | Normal GFR (>90) | Mildly reduced GFR (60–89) | Moderately reduced GFR (30–59) | Severely reduced GFR (15–29) | Kidney failure GFR < 15 | |||||
| Stage of CKD | Stage 3 | Stage 4 | Stage 5 | |||||||
| Number | 5791 | 17619 | 5191 | 211 | 47 | 28 859 | ||||
| All cardiovascular disease | 21.9% | 43.0% | 74.3% | 83.9% | 89.4% | 44.8% | P < 0.001 | |||
| Diabetes | 7.7% | 9.6% | 14.9% | 25.6% | 19.1% | 10.3% | P < 0.001 | |||
| IHD | 4.9% | 13.2% | 26.5% | 31.8% | 23.4% | 14.1% | P < 0.001 | |||
| Heart failure | 0.4% | 1.3% | 8.5% | 17.5% | 8.5% | 2.6% | P < 0.001 | |||
| Peripheral vascular disease | 0.6% | 1.1% | 2.8% | 6.2% | 2.1% | 1.4% | P < 0.001 | |||
| Cerebrovascular disease | 1.9% | 4.5% | 11.9% | 14.7% | 14.9% | 5.4% | P < 0.001 | |||
| Hypertension | 13.2% | 31.0% | 55.4% | 64.5% | 80.9% | 32.1% | P < 0.001 | |||
| BMI recording % | 67.1 | 75.9 | 77.2 | 73.5 | 70.2 | 74.3 | ||||
| BMI mean | 26.2 | 27.3 | 27.6 | 27.0 | 28.3 | 27.1 | P < 0.001 | |||
Table 3 shows the proportion of patients recorded as having cardiovascular disease, diabetes and hypertension at different levels of GFR. There were only small numbers of patients in Stage 4 and 5 CKD, 0.7% (211/28 859) and 0.2% (47/28 859), respectively.
Three-quarters (74.6%; 4075/5449) of patients with Stage 3–5 CKD had one or more circulatory diseases. All of these conditions were significantly more common with worsening stage of CKD (P < 0.001, Pearson x2). Hypertension was the commonest diagnosis, recorded in 56% (3049/5449). Ischaemic heart disease was diagnosed in 26.7% (1455/5449), stroke or transient ischaemic attack in 12% (654/5449), heart failure in 8.9% (483/5449), and peripheral vascular disease in 2.9% (158/5449).
Diabetes was recorded in 15.4% (838) of patients with Stage 3–5 CKD, with 14.5% (122/838) being treated with insulin. Increased body mass index (BMI) was significantly associated with diabetes, but not with stage of CKD (P < 0.001, t-test.) The mean BMI of the diabetic population was 29.8 kg/m2 (SE 0.139), which was significantly higher than the non-diabetic population mean of 26.8 kg/m2 (SE 0.062). The BMI in the diabetic population did not vary significantly between different stages of CKD.
Details of alcohol consumption were recorded in 66.1% of patients with Stage 3–5 CKD and in 64.4% of all patients. Information with respect to family history of ischaemic heart disease was available in 19.2% of Stage 3–5 CKD and 22.5% of patients overall.
Smoking data were incomplete (Table 4), largely due to the use of ambiguous high order Read codes that included both smoking and non-smoking daughter codes. Smoking habit was recorded for 35.0% of patients. The commonest smoking Read code used was ‘never smoked’ (1371), which was recorded in just over 50%. Unfortunately, the higher order ambiguous ‘137’ or ‘smoking status’ code was used in nearly one-quarter (23.7%). Only 15.6% of those with a smoking record had been recorded unambiguously as ex-smokers (11.2%) or current smokers (4.4%). Despite this, the available data on smoking were analysed because it is such an important risk factor for CKD.
Smoking codes used in patients with normal or reduced GFR, and Stage 3–5 chronic kidney disease (CKD)
| Subgroup | Patients with GFR ≥60 ml/min/1.73 m2 | Patients with GFR <60 ml/min/1.73 m2 | All | ||||||
|---|---|---|---|---|---|---|---|---|---|
| Qualitative description of GFR | Normal GFR (>90) | Mildly reduced GFR (60–89) | Moderately reduced GFR (30–59) | Severely reduced GFR (15–29) | Kidney failure GFR <15 | ||||
| Stage of CKD | Stage 3 | Stage 4 | Stage 5 | ||||||
| Never smoked | 48.3% | 51.9% | 51.4% | 54.8% | 61.5% | 51.3% | |||
| Ex-smoker | 10.5% | 10.8% | 13.3% | 13.7% | 15.4% | 11.2% | |||
| Current smoker | 5.9% | 4.1% | 2.5% | 4.1% | 4.8% | 4.4% | |||
| Read code 137 'Smoking status' | 22.6% | 24.0% | 23.9% | 16.4% | 15.4% | 23.7% | |||
| Read code 'smoking advice' | 11.4% | 9.1% | 8.9% | 11.0% | 7.7% | 9.5% | |||
| Total | 1642 | 6495 | 2007 | 73 | 13 | 10 230 | |||
Only 3.6% (196/5449) of patients with Stage 3–5 CKD were recorded as having renal disease. Renal failure (n = 171) and renal impairment (n = 44) were the commonest diagnostic codes used. 0.01% of the entire registered population (13/112 215) were recorded as dialysis patients and 0.004% (4/112 215) were recorded as having undergone renal transplantation. The query to see if any transplant or dialysis diagnosis or medication was recorded for patients without a creatinine measure did not find any additional patients. For technical reasons, this query ran in only half (6/12) of the practices in the study.
A relatively small proportion (346 patients) had prescriptions issued for potentially nephrotoxic drugs. These included 3 for lithium in Stage 3–5 CKD and 16 for metformin in patients with GFR <30 ml/min/1.73 m2. Prescribed medicines were the only identified risk factor for CKD in 7.9% of the group (24/346). A number of drugs recommended to be used with caution in renal disease (corticosteroids, beta-blockers, alpha-blockers and potassium sparing diuretics) were all used more frequently in patients with Stage 3–5 CKD. 40.6% of all patients were prescribed non-steroidal anti-inflammatory drugs, which were prescribed at similar rates across all stages of CKD (range 34%–42%). 36.3% (1977/5449) of patients with Stage 3–5 CKD who were prescribed drugs to be used with caution had this as the only potential contributor to their impaired GFR.
More than one-quarter (26.1%, 438/1680) of men with Stage 3–5 CKD had prostatic disease. Most (15.7%, 263/1680) had prostatic hypertrophy, while 2.9% (49/1680) had prostate cancer. The recorded prevalence of prostatic cancer in Stage 3–5 CKD was nearly three times that recorded in men with GFR ≥60. A total of 573 patients with Stage 3–5 CKD of both sexes had post-renal disease of all causes, including those with prostate disease. The commonest other causes were kidney stones and bladder disease. The majority of these (460; 80.3%) had co-existing circulatory disease.
Discussion
This study demonstrated that it was feasible to re-use routinely collected general practice computer data to identify patients with CKD, together with relevant risk factors, co-morbidities and current treatment.
We could not reliably identify Stages 1 and 2 CKD because of the lack of reliable recording of microalbuminuria, proteinuria, haematuria and renal disease. However, the results (see Table 3) clearly demonstrated the association between level of renal function and prevalence of hypertension, diabetes and cardiovascular disease. NHANES and several other community based observational studies have demonstrated that anaemia and cardiovascular co-morbidity become increasingly prevalent at levels of GFR below 60 ml/min/1.73 m2.5,6 For these reasons, the National Kidney Disease Education Programme in the USA to use a GFR level of less than 60 ml/min/1.73 m2 in their definition of CKD;21 a definition we could have adopted in this study.
The quality of the data was variable. Nearly all study subjects had blood pressures recorded and there were good levels of recording of conventional cardiovascular risk factors including diabetes, cholesterol and family history of heart disease. Smoking data were recorded but were incomplete. There remains scope for improvement in data quality for blood pressure, cholesterol measurement and use of lipid lowering drugs; recording levels were similar to previous studies.19,24 The recording of the presence or absence of proteinuria and haematuria was poor, and indices of renal bone disease and acidosis were also poorly recorded. The dialysis rates reported were under half those previously reported at a national level: 116 patients per million (ppm) compared with 299 ppm, and that for renal transplantation 36 ppm compared with 267 ppm.23
Another limitation of this study was the lack of recording of ethnicity data. The MDRD formula contains a correction factor of 1.21 (Box 2). Therefore, if the study population had contained a high proportion of afrocaribbeans it might have exaggerated the numbers with GFR ≥60. However, National Statistics data suggest that less then 1% of people in the study population were black;24 therefore ethnic mix was unlikely to have had a large influence on the results. Validating our approach, the Cockroft-Gault equation (which does not take ethnicity into account) gave a similar figure for the number of patients with Stage 3 to 5 CKD.
Nearly 5% of the population studied had Stages 3 to 5 CKD, although only a small proportion of these (3.6%) were recorded as having renal disease. The age and sex distribution of the population sampled mirrored that of the general population. For a typical UK general practice of 10 000 patients, extrapolation of our data would identify approximately 463 patients with Stage 3 CKD, 19 patients with Stage 4 CKD and four patients with Stage 5 CKD. Stage 3 CKD could be flagged for opportunistic screening or for further risk assessment and Stages 4 and 5 for review.
Recent data from the USA4 suggested that 11% of the general population had CKD, and that 4.7% had Stage 3–5 CKD, consistent with this study (4.9% Stage 3–5). NHANES found similar associations of hypertension, diabetes and anaemia. Both studies showed a lack of association between obesity and CKD, except when associated with diabetes. However, unlike NHANES and the results of a more recent community based study,9 no association was found between CKD and cigarette smoking,4 although this may be due to the problems in the coding of smoking data in the GP records analysed.
Using the simplified MDRD formula to estimate GFR from SCr underestimates GFR in people with normal renal function but, nevertheless, provides close correlation with isotope measurements at levels of GFR of 60 ml/min/1.73 m2 or below.11 The Cockcroft-Gault equation is the next most usable method. It provides an estimate of creatinine clearance, but can overestimate renal function. Although absolute measures of renal function are important, this study showed that it was possible to extract time series data about creatinine recording. This would enable rate of change calculations to be made to target prevention at progressive disease.
Very few patients in this study (3.6% of Stage 3–5 CKD) were recorded as having renal disease despite the presence of data enabling identification of CKD. Patients with CKD may well benefit from medication review, improved management of cardiovascular risk factors and assessment as to whether they have proteinuria, or complications associated with chronic renal failure, such as renal bone disease. This is important as proteinuria has been shown to be an independent risk factor for cardiovascular disease and nephropathy in diabetes,25,26 as well as being useful in staging patients with CKD. Practices should consider long-term involvement with data quality programmes that can demonstrate improvement in data quality.20,27,28
A larger study is needed to better characterise the population of patients with Stages 4 and 5 CKD, as this study identified relatively few patients with severe CKD. Research is also needed to improve data recording and data quality: notably recording of ethnicity, urine testing, smoking, and renal disease. More information is needed about the relative risks of using drugs known to impair renal function; and on how to interpret the rate of change in estimated GFR in the general practice population. This technique should be tested on other clinical databases and across integrated clinical record systems, which share data between institutions.
In summary, systematic searching of general practice computer records identified substantial numbers of patients with undiagnosed CKD and offered an effective (and highly cost effective) screening strategy for identifying CKD.
Declaration
Funding: Roche pharmaceuticals funded the collection of this data.
Ethical approval: the study was approved by local research ethics committees in Kent, West Surrey and Manchester.
Conflicts of interest: the Primary Care Informatics group at St George's Hospital Medical School was funded to perform the data collection for this programme. It is expected that this group will carry out additional funded data collection and aggregation in 2005. The writing of this paper was not funded. The views expressed within it are those of the authors and not necessarily of Roche or the NEOERICA development team. MW is employed by Roche pharmaceuticals, who funded the study. As an author, he read the paper, and commented on its contents, at the same time that other authors were circulated copy. The paper has not been subject to any editorial scrutiny or screening by Roche, nor has the company requested any subject area (including anaemia, which is associated with renal failure) be made more prominent.
We are grateful to all GP practices and collaborating GPs who allowed us to extract data from their databases and to Susan Mayor who provided helpful comments on the manuscript.
References
Locatelli F, Vecchio LD, Pozzoni P. The importance of early detection of chronic kidney disease.
John RI, Webb MC, Young A, Stevens PE. Unreferred chronic kidney disease: A longitudinal study.
Drey N, Roderick P, Mullee M, Rogerson M. A population-based study of the incidence and outcomes of diagnosed chronic kidney disease.
Coresh J, Astor BC, Greene T, Eknoyan G, Levey AS. Prevalence of chronic kidney disease and decreased kidney function in the adult US population: Third National Health and Nutrition Examination Survey.
Collins AJ, Li S, Gilbertson DT, Liu J, Chen S-C, Herzog CA. Chronic kidney disease and cardiovascular disease in the Medicare population.
Ritz E, McClellan WM. Overview: Increased cardiovascular risk in patients with minor renal dysfunction: An emerging issue with far-reaching consequences.
Anavekhar NS, Pfeffer MA. Cardiovascular Risk in Chronic Kidney Disease.
Haroun MK, Jaar BG, Hoffman SC, Comstock GW, Klag MJ, Coresh J. Risk Factors for Chronic Kidney Disease: A Prospective Study of 23 534 Men and Women in Washington County, Maryland.
Thiru K, de Lusignan S, Shaw N. Paperless practices: a report from a research network.
Lin J, Knight EL, Hogan ML, Singh AK. A Comparison of Prediction Equations for Estimating Glomerular Filtration Rate in Adults without Kidney Disease.
Levey AS, Bosch JP, Lewis JB et al. A more accurate method to estimate glomerular filtration rate from serum creatinine: a new prediction equation. Modification of Diet in Renal Disease Study Group.
National Kidney Foundation (NKF) Kidney Disease Outcome Quality Initiative (K/DOQI) Advisory Board. K/DOQI clinical practice guidelines for chronic kidney disease: evaluation, classification, and stratification. Kidney Disease Outcome Quality Initiative.
The sixth report of the Joint National Committee on prevention, detection, evaluation, and treatment of high blood pressure.
Wright JT Jr, Douglas JG, Rahman M. Prevention of cardiovascular disease in hypertensive patients with normal renal function.
European best practice guidelines for the management of anaemia in patients with chronic renal failure.
BMA and Royal Pharmaceutical Society. British National Formulary 46 (September 2003). London: BMA;
St George's Hospital Medical School. Primary Care Data Quality Project. What is MIQUEST. http://www.pcdq.org/miquest.htm
de Lusignan S, Dzregah B, Hague N, Chan T. Cholesterol management in patients with ischaemic heart disease: an audit-based appraisal of progress towards clinical targets in primary care.
de Lusignan S, Hague NJ, Brown A, Majeed A. An educational intervention to improve data recording in the management of ischaemic heart disease in primary care.
National Statistics. Population Trends
US Department of Health & Human Services. National Kidney Disease Education Programme (NKDEP). Definition of Chronic Kidney Disease (CKD). http://www.nkdep.nih.gov/healthprofessionals/ckdoverview.htm#definition
de Lusignan S, Belsey J, Hague N, Dzregah B. End digit preference in blood pressure recordings of patients with ischaemic heart disease in primary care.
Locatelli F, Valderrabano F, Heonich N, Bommer J, Leunissen K, Cambi V. Progress in dialysis technology: membrane selection and patient outcome.
National Statistics. 2001 Census. Geographic distribution: by minority ethnic population: Social Focus in Brief: Ethnicity. http://www.statistics.gov.uk/statbase/ssdataset.asp?vlnk=6207
Culleton BF, Larson MG, Parfrey PS, Kannel WB, Levy D. Proteinuria as a risk factor for cardiovascular disease and mortality in older people: a prospective study.
Meigs JB, D'Agostino RB Sr, Nathan DM, Rifai N, Wilson PW; Framingham Offspring Study. Longitudinal association of glycemia and microalbuminuria: the Framingham Offspring Study.
de Lusignan S, Hague N, Yates C, Harvey M. A case study from a Sussex Primary Care Group: improving secondary prevention in coronary heart disease using an educational intervention.
Author notes
aPrimary Care Informatics, Department of Community Health Sciences, Hunter Wing, St George's Hospital Medical School, London SW17 0RE, bSurrey Hampshire Borders NHS Trust, Ridgewood Centre, Old Bisley Road, Camberley, Surrey GU16 9QG, cDepartment of Renal Medicine, Kent and Canterbury Hospital, Ethelbert Road, Canterbury, Kent CT1 3NG, dDepartment of Renal Medicine, Salford Royal Hospitals NHS Trust, Hope Hospital, Salford M6 8HD and eHealthcare Management, Roche Products Ltd, 40 Broadwater Road, Welwyn Garden City, Hertfordshire AL7 3AY
