Recent trends in life expectancy across high income countries: retrospective observational study
BMJ 2018; 362 doi: https://doi.org/10.1136/bmj.k2562 (Published 15 August 2018) Cite this as: BMJ 2018;362:k2562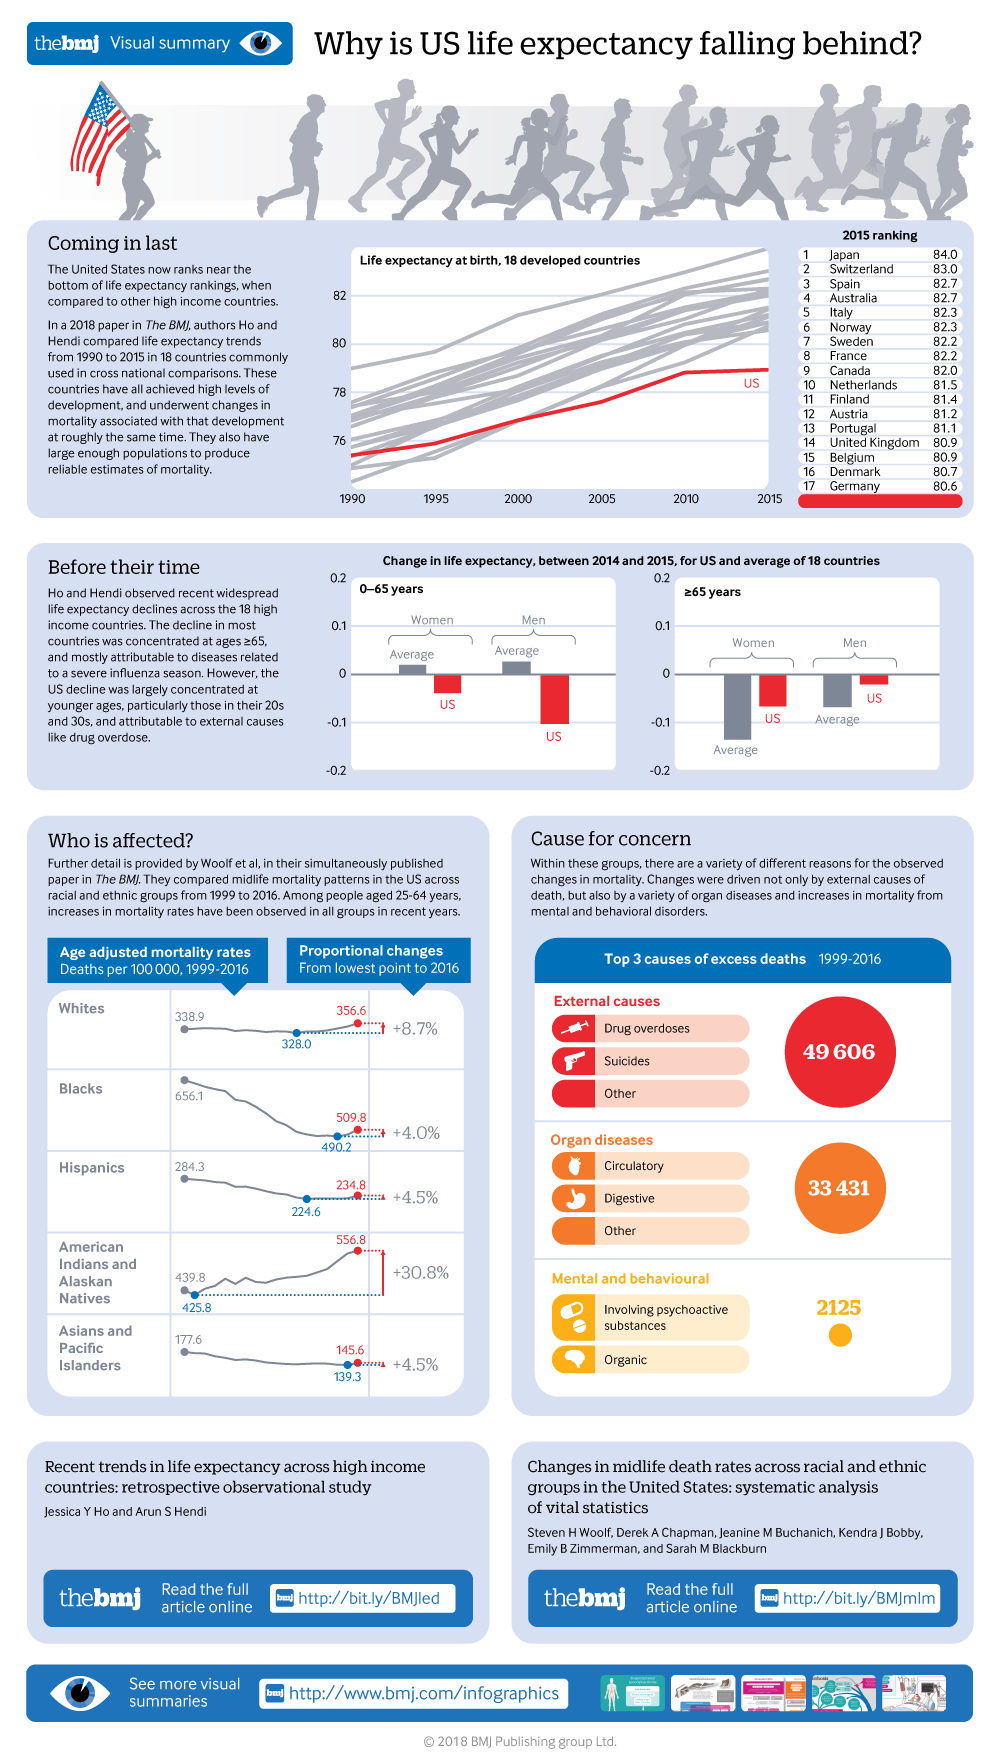
Visual summary available
Showing how US life expectancy is lagging behind other rich countries, which citizens are affected, and the causes of death that have risen most sharply in recent years.
Linked editorial
Reversals in life expectancy in high income countries?

- 1Leonard Davis School of Gerontology and Department of Sociology, University of Southern California, 3715 McClintock Avenue, Los Angeles, CA 90089, USA
- 2Office of Population Research and Department of Sociology, Princeton University, Princeton, NJ, USA
- Correspondence to: JY Ho jessicyh{at}usc.edu
- Accepted 4 June 2018
Abstract
Objectives To assess whether declines in life expectancy occurred across high income countries during 2014-16, to identify the causes of death contributing to these declines, and to examine the extent to which these declines were driven by shared or differing factors across countries.
Design Demographic analysis using aggregated data.
Setting Vital statistics systems of 18 member countries of the Organisation for Economic Co-operation and Development.
Participants 18 countries with high quality all cause and cause specific mortality data available in 2014-16.
Main outcome measures Life expectancy at birth, 0-65 years, and 65 or more years and cause of death contributions to changes in life expectancy at birth.
Results The majority of high income countries in the study experienced declines in life expectancy during 2014-15; of the 18 countries, 12 experienced declines in life expectancy among women and 11 experienced declines in life expectancy among men. The average decline was 0.21 years for women and 0.18 years for men. In most countries experiencing declines in life expectancy, these declines were predominantly driven by trends in older age (≥65 years) mortality and in deaths related to respiratory disease, cardiovascular disease, nervous system disease, and mental disorders. In the United States, declines in life expectancy were more concentrated at younger ages (0-65 years), and drug overdose and other external causes of death played important roles in driving these declines.
Conclusions Most of the countries that experienced declines in life expectancy during 2014-15 experienced robust gains in life expectancy during 2015-16 that more than compensated for the declines. However, the United Kingdom and the United States appear to be experiencing stagnating or continued declines in life expectancy, raising questions about future trends in these countries.
Introduction
Life expectancy is a key summary measure of the health and wellbeing of a population. A nation’s life expectancy reflects its social and economic conditions and the quality of its public health and healthcare infrastructure, among other factors. Monumental improvements in life expectancy have been the predominant trend for high income, developed countries over the course of the 20th and 21st centuries.12
In the absence of wars, new epidemics, or substantial economic reforms, lack of improvement or stagnation in life expectancy gains are viewed as a cause for concern, and actual declines in life expectancy are particularly alarming. Stagnation or declines in life expectancy may signal a decline in the health profile of the population driven by adverse socioeconomic trends, a deterioration in the provision or quality of healthcare services, or worsening behavioral factors.
Recent trends in the United States suggest that it has experienced a break from the trajectory of continued gains in life expectancy. In December 2017, the US National Center for Health Statistics reported that the country experienced a decline in life expectancy for two consecutive years.3 Between 2014 and 2016, overall life expectancy in the USA declined by 0.3 years.34 This decline was most pronounced among men, who experienced a decline of 0.2 years in each of the two consecutive years. American women experienced a decline of 0.2 years during 2014-15 and no appreciable change in life expectancy during 2015-16.
These declines are particularly troublesome in light of the US’s poor performance in international rankings of life expectancy. The USA now has the lowest life expectancy levels among high income developed countries, and Americans fare poorly across a broad set of ages, health conditions, and causes of death compared with their counterparts in these countries.5678
The USA may not be alone in experiencing declines in life expectancy—a recent study documented an increase in the age standardized death rate in England and Wales during 2014-15.9 However, whether this decline was driven by factors similar to those in the USA and whether any other high income countries experienced similar declines is unknown.
We assessed whether declines in life expectancy occurred in other high income countries during 2014-16, the main age groups and causes of death contributing to these declines, and the extent to which these declines were driven by shared or differing factors across countries. This study also provides an evaluation of how recent adverse trends in life expectancy have affected the US’s life expectancy standing compared with other high income countries.
Methods
Overview
We compared recent life expectancy trends in the United States with those in a set of high income countries, which overlap with those used in recent cross national comparisons of life expectancy.567810 These 17 countries are Australia, Austria, Belgium, Canada, Denmark, Finland, France, Germany, Italy, Japan, the Netherlands, Norway, Portugal, Spain, Sweden, Switzerland, and the United Kingdom. These countries have achieved high levels of development for many decades, underwent their mortality transitions in roughly the same period, and had population sizes sufficient to produce stable estimates.
Life expectancy estimates
We constructed life tables by sex for each country in 1990, 1995, 2000, and 2005, and for each year between 2010 and 2016 using standard life table methods and graduation to parameterize the life table.1112 A life table is a demographic tool used to compute life expectancy, and graduation is a recursive smoothing technique to produce estimates of the average years lived by decedents within an age group. The supplementary methodological appendix provides additional information on life table methods.
Data on deaths and person years of exposure come from the Human Mortality Database through the latest year available.13 For the remaining years, we used data from the official vital statistics agencies of individual countries (see supplementary table A1). The following quantities of interest are drawn from these life tables: life expectancy at birth—the number of years newborns who experience the life table death rates throughout their lifetime could expect to live; life expectancy between ages 0 and 65 years—the number of years newborns who experience the life table death rates throughout their lifetime could expect to live between the ages of 0 and 65; and life expectancy at ages 65 or more years—the number of years individuals who have survived to age 65 and who then experience the life table death rates throughout the remainder of their lifetime could expect to live.11
Cause of death data
We consider 22 mutually exclusive and exhaustive cause of death categories (see supplementary table A2 for the corresponding ICD-10 codes) and their contribution to changes in life expectancy during 2014-15. Causes of death data are primarily drawn from the World Health Organization mortality database14 and supplemented with data from Statistics Canada15 and Statistics Portugal16 (see supplementary table A1). France’s 2015 cause of death data are not yet available. We obtained the proportions of total deaths due to each of these 22 categories and applied them to all cause death rates to obtain cause specific death rates by age, sex, year, and country.
Two hypotheses have been suggested to explain increasing mortality in the USA and the UK: particularly severe influenza seasons17 and ongoing opioid epidemics.18 In a subset of analyses testing these hypotheses we focused on four cause of death categories: influenza and pneumonia (ICD-10 codes J09-J18), respiratory diseases (J00-J99), drug overdose (X40-X44, X60-X64, X85, and Y10-Y14), and external causes (V01-Y98). These categories are non-mutually exclusive: influenza and pneumonia are a subcategory of respiratory diseases, and drug overdose is a subcategory of external causes. We combined influenza and pneumonia into a single category because deaths due to influenza are commonly coded as pneumonia on death certificates.19 The two broader categories are employed in order to include countries that have less detailed cause of death data and because deaths from influenza are often under-detected and end up being coded as deaths from other respiratory illnesses, particularly among older adults.20
Cause of death analyses
We used Arriaga’s decomposition to determine which causes of death are primarily responsible for the 2014-2015 change in life expectancy for men and women in each country.1121 Arriaga’s decomposition is a method that partitions changes in life expectancy into cause of death contributions. We computed five cause of death contributions for each country (further broken down into 22 specific categories in supplementary figures A2 and A3). Negative contributions indicate that the cause tended to reduce life expectancy, whereas positive contributions indicate that the cause tended to increase life expectancy. For a given country-sex combination, the cause specific contributions sum to the total change in life expectancy during 2014-15. The supplementary methodological appendix provides additional information on Arriaga’s decomposition.
Corresponding to the two hypotheses described previously, we examined four specific causes of death that represent the impact of influenza and pneumonia and drug overdose. To determine whether these causes are responsible for recent declines in life expectancy, we computed cause deleted life tables using Chiang’s method for each country and for each of the four cause of death categories of interest in 2014 and 2015.1122 Cause deleted life tables are counterfactuals that answer the question, “What would life expectancy be in a given country if all deaths from a specific cause of death were eliminated?” This in turn allows us to determine whether, for example, life expectancy in the USA would still have declined during 2014-15 in the absence of drug overdose.
We determined the contribution of these four causes of death to life expectancy trends by comparing the observed life tables with the cause deleted life tables. The contribution of a specific cause of death to a decline in life expectancy during 2014-15 can be characterized in three ways. If, in the absence of the cause of death: life expectancy would have increased during 2014-15, then that cause is responsible for all of the decline; life expectancy would have declined by a smaller magnitude than observed during 2014-15, then that cause is partly responsible for the decline and we quantified this contribution in both absolute and percentage terms; and life expectancy would have declined even more than observed during 2014-15, then that cause is not responsible for the decline. The supplementary methodological appendix provides additional information on cause deleted life table methods.
Patient involvement
No patients were involved in setting the research question or the outcome measures, nor were they involved in developing plans for design or implementation of the study. No patients were asked to advise on interpretation or writing up of results. There are no plans to disseminate the results of the research to study participants or the relevant patient community.
Results
Recent trends in life expectancy
Between 2010 and 2016, life expectancy in the USA stagnated while life expectancy in other high income countries exhibited steady increases (fig 1). The USA posted the smallest life expectancy gains between 2010 and 2016 among all 18 countries (table 1). Between 2010 and 2016, life expectancy increased by only 0.19 years for American women (from 81.21 years to 81.40 years) and by only 0.04 years for American men (from 73.36 to 76.40 years). Not only did counterparts in other countries start out at higher levels of life expectancy, but they also experienced larger increases. On average, women and men in other countries gained 0.88 and 1.38 years, respectively, between 2010 and 2016 (these averages exclude Canada, for which 2016 data are not yet available). Among the comparison countries, the largest gains in life expectancy were observed for Danish women (1.45 years) and men (1.83 years), and the smallest gains were observed for British women (0.37 years) and men (0.68 years).

Life expectancy at birth (years) in 18 high income countries for women and men during 2010-16 and 1990-2015. Data for Canada are not available in 2016. See supplementary figure A1 for all countries identified. AUS=Australia; JPN=Japan; SWI=Switzerland; USA=United States
Life expectancy at birth by sex and country, 2010, 2014, 2015, and 2016, and change over time. Average refers to the average of the non-US countries (excluding Canada)
This recent stagnation in life expectancy in the USA has led to a further deterioration of its standing in international rankings. It is clear that the USA is falling further and further behind its peer countries, and this divergence has been particularly pronounced since 2010 (fig 1). The gap between American women and women in the average of the other countries grew by 0.68 years, from 2.35 to 3.03 years (table 1). For men, the gap grew by 1.34 years, from 2.06 to 3.40 years. Increases in the gaps between the USA and the world leaders (countries with highest life expectancy in each year) also indicate further deterioration of the US’s position. In 2016, the gap between the USA and the world leaders reached 5.77 years for women (up from 5.07 years in 2010) and 5.23 years for men (up from 3.69 years in 2010).
Declines in life expectancy
Most high income countries in our sample experienced declines in life expectancy during 2014-15. Of the 18 countries, 12 experienced a decline at birth for women, and 11 experienced a decline for men (table 1). These declines were fairly large in magnitude, amounting to 0.21 years on average for women and 0.18 years on average for men. The declines ranged from 0.03 years (Sweden) to 0.55 years (Italy) for women and from 0.003 years (Belgium) to 0.43 years (Italy) for men. In most of the countries that experienced declines, these declines were actually larger than those observed in the USA (figs 2 and 3).

Changes in life expectancy for women at birth, 0-65 years, and 65 or more years during 2014-15 in 18 high income countries. Countries are ordered by change in life expectancy at birth during 2014-15, from largest gain to largest decline. See table 1 and supplementary table A4 for corresponding values

Changes in life expectancy for men at birth, 0-65 years, and 65 or more years during 2014-15 in 18 high income countries. Countries are ordered by change in life expectancy at birth during 2014-15, from largest gain to largest decline. See table 1 and supplementary table A4 for corresponding values
It is unusual for so many countries to simultaneously experience declines in life expectancy and for the declines to be so large in magnitude. Among men, this is entirely unprecedented. Between 1980 and 2014 for the 18 countries, the maximum number of countries to simultaneously experience year-over-year declines in life expectancy for men was seven (in 1985), and that decline was smaller in magnitude (authors’ calculations based on Human Mortality Database1 and other data, available upon request). Among women, 12 countries simultaneously experienced declines in life expectancy in 2012, but the average magnitude of those declines was 0.08 years, roughly a third of the average decline during 2014-15. Aside from 2012 and 2015, the maximum number of countries to simultaneously experience declines in life expectancy of females was nine (also in 1985). In short, the 2014-15 declines in life expectancy are more widespread and larger in magnitude than anything observed in decades.
Next, we investigated the age and cause of death patterns of these declines to identify if any similarities arose among these countries. For women, of the 12 countries that experienced declines in life expectancy at birth, five experienced a decline between ages 0 and 65 (fig 2). All 12 countries experienced declines in life expectancy at ages 65 or more, and Danish and Norwegian women, who did not experience a decline in life expectancy at birth, additionally experienced small declines at ages 65 or more (fig 2). For men, seven of the 11 countries that experienced declines in life expectancy at birth also experienced declines between ages 0 and 65 (fig 3), and Canada and Australia, which did not have declines in life expectancy at birth, did have declines between ages 0 and 65. All of the countries that experienced a decline in life expectancy at birth also had declines in life expectancy at ages 65 or more (fig 3). Danish and Portuguese men, who did not experience declines in life expectancy at birth, did experience declines at ages 65 or more.
The declines in the USA are distinct from those of other high income countries in that they are more concentrated at younger ages (0-65). Among most other high income countries, mortality at older ages was the primary driver of the declines in life expectancy.
These varying age patterns suggest that different factors may be driving the declines in life expectancy in the USA compared with other high income countries. Figures 4 and 5 show the decomposition of the 2014-15 change in life expectancy into five broad cause of death categories (see supplementary figures A2 and A3 for more detailed categories). Among countries that experienced declines in life expectancy, deaths related to respiratory and cardiovascular diseases and to Alzheimer’s disease, other nervous system diseases, and mental disorders explain most of these declines for the non-USA countries. This was the case for both men and women. A general pattern that emerges is that the larger the decline in life expectancy at birth, the greater the role played by respiratory and cardiovascular diseases. For countries with smaller declines, these tended to reflect trends in mortality from Alzheimer’s disease, other nervous system diseases, and mental disorders. The USA appears to be quite distinct from the other countries: for American women, drug overdose and external causes, and respiratory and cardiovascular diseases, contributed roughly equally to the decline in life expectancy, but for American men, nearly all of the decline was attributable to drug overdose and external causes.

Contribution of broad cause of death categories to changes in life expectancy at birth for women during 2014-15 in 17 high income countries. Countries are ordered by change in life expectancy at birth during 2014-15, from largest decline to largest gain. Countries to left of dashed line experienced a decline in life expectancy during 2014-15, and countries to right of dashed line experienced a life expectancy gain during 2014-15. Cause of death categories for Portugal differ from those for the other countries (see supplementary table A2). See supplementary figure A2 for a more detailed version of this figure with 22 cause of death categories

Contribution of broad cause of death categories to changes in life expectancy at birth for men during 2014-15 in 17 high income countries. Countries are ordered by change in life expectancy at birth during 2014-15, from largest decline to largest gain. Countries to left of dashed line experienced a decline in life expectancy during 2014-15, and countries to right of dashed line experienced a life expectancy gain during 2014-15. Cause of death categories for Portugal differ from those for the other countries (see supplementary table A2). See supplementary figure A2 for a more detailed version of this figure with 22 cause of death categories
Since influenza and pneumonia and drug overdose were hypothesized to play key roles in declines in life expectancy in the UK and the USA and were also implicated as primary drivers of the 2014-15 declines in life expectancy, we examined them in further detail (table 2). These results answer the question, “What would life expectancy trends have been in the absence of these causes of death?” Among the countries that experienced declines in life expectancy for women, influenza and pneumonia were responsible for all of the decline in Sweden and Switzerland and for roughly a quarter of the decline in Austria, the Netherlands, and Portugal. The broader category of respiratory diseases accounted for much of the declines in these countries; in only three countries (Italy, Germany, and the USA) did it explain less than a quarter of the decline. In contrast, external causes appeared to be less important contributors to declines in life expectancy for women. The two exceptions were Sweden and the USA, where external causes accounted for 23% and 44% of the declines, respectively. Drug overdose was a key contributor in the USA—this cause alone was responsible for nearly a fifth of the decline in life expectancy for American women during 2014-15.
Contributions of four cause of death categories to changes in life expectancy between 2014 and 2015, women and men in 17 high income countries. Within each panel, countries are ranked in order from largest decline to largest increase in life expectancy. Drug overdose is a subcategory of external causes, and influenza and pneumonia is a subcategory of respiratory diseases
Among the countries that experienced declines in life expectancy for men, both respiratory diseases and external causes appear to play important roles (table 2). Respiratory diseases were particularly important in Belgium, the Netherlands, Spain, and Sweden, where they accounted for more than half of these declines. In all countries except for Italy and the USA, where they made no or small contributions to the decline, respiratory disease accounted for upwards of 20% of the decline. External causes are important contributors to declines in life expectancy in three countries, Switzerland, Sweden, and the USA, where they account for nearly all of the declines. Their contribution is much smaller (<12%) in the other countries. Drug overdose was the largest contributor to declines in the USA, accounting for 42% of the decline in life expectancy for American men.
Estimates for 2016
Almost all of the high income countries that experienced declines in life expectancy during 2014-15 experienced increases in life expectancy during 2015-16. For most of these countries, the declines in 2014-15 were more than made up for by robust increases in 2015-16 (table 1).
The exceptions were Finnish men and women, for whom the declines may have been offset by a year (ie, they did not experience declines in life expectancy during 2014-15 but did experience declines during 2015-16); the USA, which continued to experience declines for men and stagnation for women, and the UK, which experienced small declines or no growth for both men and women during 2015-16.
Discussion
This study found that during 2014-15 widespread declines in life expectancy occurred across high income countries. Of 18 countries, 12 experienced declines in life expectancy for women and 11 for men. This is the first time in recent decades that these many high income countries simultaneously experienced such large declines in life expectancy for both men and women. The magnitude of these declines are fairly large compared with previous declines. These most recent declines were around 0.20 years on average for both men and women—roughly twice as large as the average past declines for women and 70% larger for men. In other words, these recent declines were notable both for the number of countries and for the magnitude of the declines.
Declines in life expectancy have particular salience for the USA because it has lagged behind its peer countries.567810 While the levels of life expectancy in the USA have been ranked near the bottom of high income countries since 1990, the rate of increase in life expectancy was not substantially different from that of other countries until 2010. For example, between 1990 and 2010, the pace of increase in life expectancy for American men was fairly comparable to that of countries with the highest life expectancy in each year—the world leaders (fig 1). American women had slower rates of improvement in the 1990s but stronger gains in the 2000s (fig 1). From 2010 onwards, however, life expectancy essentially plateaued for American men and women, resulting in the other high income countries pulling far above the USA.
These increases in life expectancy gaps between the USA and other high income countries are substantial. If life expectancy in the other countries was frozen at their 2016 levels while life expectancy in the USA was allowed to increase at the rate of improvement it experienced in the 2000s—a period of fairly rapid increase in life expectancy for the USA (1.7 years per decade for women and 2.1 years per decade for men), it would take American women 18 years to match the average of the other countries and 34 years to match the world leader, while American men would need 16 years and 2.5 decades, respectively. If, instead, the USA’s current slow rate of increase in life expectancy was to hold (0.32 and 0.06 years per decade for women and men, respectively), it would take American men and women more than a century to reach the average life expectancy levels of the other countries.
Although other high income countries experienced recent declines in life expectancy, different factors appear to have been responsible for the declines in the USA. The USA experienced larger declines in life expectancy at younger ages and relatively small declines in life expectancy at older ages. In the other countries, declines at older ages were largely responsible for the declines in life expectancy at birth. The sizeable declines in life expectancy at younger ages for American men and women are strongly related to the USA’s ongoing, large scale drug overdose epidemic stemming from misuse of prescription opioids, heroin, and fentanyl2324 and from external causes. This is particularly true for American men, for whom drug overdose increased sharply in the past two years.23 Previous studies72526 have documented that in international comparisons of life expectancy, the USA performs relatively well at the older ages but poorly at the youngest ages. The age pattern of the recent declines in life expectancy serves to heighten the already sizeable US disadvantage at younger ages while reinforcing its more favorable performance at older ages.
Causes of death that predominate at older ages, including influenza and pneumonia, cardiovascular disease, Alzheimer’s disease, and other nervous system diseases were primarily responsible for declines in the other high income countries. H3N2 viruses, which are associated with increased hospital admissions and deaths, predominated during a particularly severe 2014-15 influenza season and contributed to reduced efficacy of influenza vaccine and increased mortality.18 It is possible that those with Alzheimer’s disease and other nervous system disorders had an increased risk of mortality in this year owing to influenza but their underlying cause of death was ultimately coded as being due to a non-influenza cause. Studies have also found evidence that influenza may precipitate cardiovascular events such as acute myocardial infarction and consequently mortality from cardiovascular disease.2728
Italy experienced the largest declines in life expectancy during 2014-15, roughly half a year for both men and women. The three causes of death contributing most to these declines were circulatory diseases, nervous system diseases, and external causes for men, and circulatory diseases, mental disorders, and respiratory diseases for women (supplementary figures A2 and A3). During 2015-16, life expectancy increased by about 0.45 years, returning Italian men to their 2014 life expectancy level and Italian women to a 10th of a year below their life expectancy in 2014.
Strengths and limitations of this study
This study provides a comprehensive examination of recent life expectancy trends in a set of high income countries using high quality data and consistent methodologies. We maximized the most recent data available to provide current information on trends in life expectancy. We provided new evidence identifying recent large declines in life expectancy shared across many high income countries.
One limitation of this study is that influenza and pneumonia may be underreported on death certificates. Influenza often goes undetected owing to lack of diagnostic testing, and influenza infections may increase the risk of dying from cardiovascular diseases and other respiratory diseases, which are ultimately coded as the cause of death on death certificates instead of influenza.2829 This underreporting is more severe at older ages where ascertainment of cause of death is relatively more difficult.20 We attempt to address this problem by using the broader cause of death category, respiratory diseases, which should capture a greater proportion of these influenza and pneumonia related deaths.
Another potential limitation is the issue of correlated causes of death, also known as the competing risks problem.30 We dealt with this in two ways: firstly, by using broad cause of death categories, which renders the results less sensitive to the competing risks problem, and, secondly, by ensuring that the results are robust by computing cause deleted life tables using an alternative assumption of constant mortality. This assumption is further discussed in the supplementary methodological appendix.
An additional potential limitation is the comparability of cause of death coding across countries. For example, the concern is how likely different countries are to report influenza related deaths as due to influenza, pneumonia, another respiratory disease, cardiovascular disease, and so on. For this reason, the cause of death categories in figures 4 and 5 group the categories to which influenza related deaths are most likely to be assigned. One indicator of the reliability and accuracy of data on cause specific mortality are the proportion of deaths coded to ill defined categories.31 This proportion has declined to low levels in all the countries included in this analysis over time.32
Finally, the key outcome measure of this study is life expectancy. Though life expectancy is a commonly used and intuitive summary measure of population health, other measures of health and wellbeing capture other dimensions of health and quality of life. These measures include disability adjusted life expectancy, disability-free life expectancy, healthy active life expectancy, and health adjusted life expectancy, which seek to take into account years lived in full health without the experience of disease, disability, or functional limitations. Large variations in disability-free life expectancy, for example, have been documented among OECD countries.33 We do not examine these measures in this study, and it is possible that trends in these other measures may not correspond to trends in life expectancy.
Conclusions and policy implications
Life expectancy declined across many high income countries during 2014-15. In some of these countries, life expectancy rebounded in the following year. Though this suggests that these declines may be a fluctuation rather than a new trend, it remains to be seen whether such simultaneous declines across high income countries will become more common in the coming years or whether these countries will continue to achieve robust gains in longevity.
Important exceptions to this rebound were the UK and the USA, which experienced either continued declines or stagnation during 2015-16. Life expectancy trends in the USA appear to be strongly related to its ongoing opioid epidemic; while drug overdose mortality is high in several high income countries (eg, Sweden, Norway), it seems that the American epidemic has not yet spilled over to most other high income countries.34 However, there are indications of recent increases in drug overdose in the other Anglophone countries (Australia, Canada, and the UK), although levels of mortality due to drug overdose in these countries remain much lower than in the USA. For the UK, the declines in 2014-15 were concentrated at older ages (≥65). Respiratory diseases, circulatory diseases, Alzheimer’s disease, nervous system diseases, and mental disorders, as well as drug overdose for men, were key drivers of these declines. Previous studies1735 of England and Wales suggested that decreases in funding to healthcare and social welfare programs may be driving increases in mortality among older adults, but further testing of this hypothesis is needed. While this study does not examine how socioeconomic inequality may be contributing to these declines in life expectancy across countries, it is possible that greater inequality within a country renders that country more vulnerable to declines in life expectancy. Previous studies have found a negative relation between income inequality and poverty and life expectancy across countries,36 and countries such as the USA, which is known to have high levels of socioeconomic inequality, have experienced recent declines in life expectancy among those of lower socioeconomic status.3738 Furthermore, countries with greater inequality between social classes may be more susceptible to phenomena such as drug overdose epidemics.39
Policies that have been suggested to address the US’s drug overdose epidemic include greater implementation and use of prescription drug monitoring programs, expanding access to substance misuse treatment programs, establishing supervised injection centers and needle exchange programs, increasing the availability of naloxone, and addressing the underlying social and economic conditions that may underpin drug use. These policies might have relevance not only for the USA but also for other high income countries that have also reported recent increases in opioid prescribing, including Australia, Canada, Denmark, Finland, Germany, Sweden, and the UK.4041424344454647
In many of these high income countries, mortality from influenza, pneumonia, other respiratory diseases, and cardiovascular disease played an important role in the recent declines in life expectancy. Countries should continue to encourage high rates of vaccination against influenza, increase awareness of the importance of vaccination, and maintain sufficient stocks of antiviral drugs such as Tamiflu. The influenza vaccine was known to be a poor match to the predominant influenza strain in 2014-15, which resulted in lower efficacy of the influenza vaccine. Once information about expected vaccine efficacy is known, public health and healthcare systems can take proactive approaches to reducing influenza related mortality, including increasing awareness of influenza symptoms and complications and intensifying outreach efforts, especially for vulnerable populations (eg, children, elderly people, and those who are immunocompromised).
This study also highlights the importance of maintaining and updating vital registration systems. A large number of high income countries simultaneously experienced declines in life expectancy, but it was not possible to identify this phenomenon until several years after the fact. To date, cause specific mortality data for 2016 are not yet available for the complete set of countries, and almost no countries have all cause mortality data for 2017 available. In the interests of timely identification of shared threats to life expectancy and population health more broadly, countries should make the release of accurate vital statistics data a priority. This would contribute to improved monitoring of trends in life expectancy and population health worldwide.
What is already known on this topic
Life expectancy in the United States is lower than in other high income countries, and the position of the USA in international rankings of life expectancy has been deteriorating over time
Life expectancy declined for two consecutive years in the USA between 2014 and 2016 and in England and Wales during 2014-15
Widespread or sustained declines in life expectancy are an important indicator of conditions influencing health and wellbeing within countries
What this study adds
Most high income countries included in this analysis experienced declines in life expectancy during 2014-15 likely related to a particularly severe influenza season
Declines in life expectancy in the USA differ from those in other countries in that they are more concentrated at younger ages (0-65 years) and largely driven by increases in drug overdose mortality related to its ongoing opioid epidemic
Many of these countries rebounded and experienced gains in life expectancy during 2015-16 substantial enough to offset the previous year’s declines, but the UK and the USA did not and continue to face adverse conditions
Footnotes
Contributors: JH and AH conceived and designed the study. JH acquired the data and drafted the initial manuscript. All authors contributed to analyzing the data, interpreting the results, and revising the manuscript. The corresponding author attests that all listed authors meet authorship criteria and that no others meeting the criteria have been omitted.
Funding: Funding: Principal support for this research was provided by a grant from the Robert Wood Johnson Foundation (No 74439). JH is supported by the Eunice Kennedy Shriver National Institute of Child Health and Human Development of the National Institutes of Health (award No R00HD083519). AH is supported by a pilot grant from the National Institute on Aging of the National Institutes of Health (award No P30AG043073). The content is solely the responsibility of the authors and does not necessarily represent the official views of the National Institutes of Health. The funding sources had no role in study design, data collection, data analysis, data interpretation, writing of the report, or the decision to submit the paper for publication. JH had full access to all the data in the study and had final responsibility for the decision to submit for publication.
Competing interests: All authors have completed the ICMJE uniform disclosure form at www.icmje.org/coi_disclosure.pdf and declare: JH and AH had financial support from the Robert Wood Johnson Foundation, JH had financial support from the National Institute of Child Health and Human Development, and AH had financial support from the National Institute on Aging for the submitted work; no financial relationships with any organizations that might have an interest in the submitted work in the previous three years; no other relationships or activities that could appear to have influenced the submitted work.
Ethical approval: Not required.
Data sharing: The full datasets are publicly available online and can also be requested from the corresponding author.
Transparency: The lead author (JH) affirms that the manuscript is an honest, accurate, and transparent account of the study being reported; that no important aspects of the study have been omitted; and that any discrepancies from the study as originally planned have been explained.
This is an Open Access article distributed in accordance with the Creative Commons Attribution Non Commercial (CC BY-NC 4.0) license, which permits others to distribute, remix, adapt, build upon this work non-commercially, and license their derivative works on different terms, provided the original work is properly cited and the use is non-commercial. See: http://creativecommons.org/licenses/by-nc/4.0/.