Development and validation of outcome prediction models for aneurysmal subarachnoid haemorrhage: the SAHIT multinational cohort study
BMJ 2018; 360 doi: https://doi.org/10.1136/bmj.j5745 (Published 18 January 2018) Cite this as: BMJ 2018;360:j5745
- Blessing N R Jaja, research associate1 3 4,
- Gustavo Saposnik, associate professor2 3 4,
- Hester F Lingsma, associate professor8,
- Erin Macdonald, research assistant3,
- Kevin E Thorpe, assistant professor6,
- Muhammed Mamdani, professor4 6,
- Ewout W Steyerberg, professor8 9,
- Andrew Molyneux, professor10,
- Airton Leonardo de Oliveira Manoel, critical care fellow1 3,
- Bawarjan Schatlo, assistant professor11,
- Daniel Hanggi, professor12,
- David Hasan, associate professor13,
- George K C Wong, professor14,
- Nima Etminan, associate professor12,
- Hitoshi Fukuda, assistant professor15,
- James Torner, professor16,
- Karl L Schaller, professor17,
- Jose I Suarez, professor18,
- Martin N Stienen, neurosurgery fellow19,
- Mervyn D I Vergouwen, assistant professor20,
- Gabriel J E Rinkel, professor20,
- Julian Spears, associate professor1 5,
- Michael D Cusimano, professor1 4 5,
- Michael Todd, professor21,
- Peter Le Roux, professor22,
- Peter Kirkpatrick, honorary consultant neurosurgeon23,
- John Pickard, professor23,
- Walter M van den Bergh, associate professor24,
- Gordon Murray, professor25,
- S Claiborne Johnston, professor26,
- Sen Yamagata, professor15,
- Stephan Mayer, professor27,
- Tom A Schweizer, associate professor1 3 4 5,
- R Loch Macdonald, professor1 3 4 5
- on behalf of the SAHIT collaboration
- 1Division of Neurosurgery, St Michael’s Hospital, Toronto, ON, Canada
- 2Division of Neurology, St Michael’s Hospital, Toronto, ON, Canada
- 3Neuroscience Research Program of the Li Ka Shing Knowledge Institute, St Michael’s Hospital, Toronto, ON, Canada
- 4Institute of Medical Science, University of Toronto, ON, Canada
- 5Department of Surgery, University of Toronto, ON, Canada
- 6Department of Health Policy, Management and Evaluation, University of Toronto, ON, Canada
- 7Dalla Lana School of Public Health of the University of Toronto, ON, Canada
- 8Department of Public Health, Erasmus MC-University Medical Centre Rotterdam, Rotterdam, Netherlands
- 9Department of Medical Statistics, Leiden University Medical Centre, Leiden, Netherlands
- 10Division of Endovascular Neurosurgery, Department of Neurosurgery, University of Oxford, Oxford, UK
- 11Department of Neurosurgery, University Hospital Göttingen, Germany
- 12Department of Neurosurgery, University Hospital Mannheim, Medical Faculty Mannheim, University of Heidelberg Theodor-Kutzer-Ufer 1-3, Germany
- 13Department of Neurosurgery, University of Iowa Carver College of Medicine, Iowa City, IA, USA
- 14Division of Neurosurgery, Department of Surgery, Prince of Wales Hospital, The Chinese University of Hong Kong, Hong Kong, China
- 15Department of Neurosurgery, Kurashiki Central Hospital, Kurashiki-city, Okayama, Japan
- 16Department of Epidemiology, University of Iowa College of Public Health, Iowa City, IA, USA
- 17Department of Clinical Neurosciences, Hôpitaux, Universitaire de Genève, Geneva, Switzerland
- 18Department of Anesthesiology and Critical Care Medicine, Johns Hopkins University, Baltimore, MD 21287, USA
- 19Department of Neurosurgery, University Hospital Zurich, Frauenklinikstrasse 10, 8091 Zürich, Switzerland
- 20Brain Centre Rudolf Magnus, Department of Neurology and Neurosurgery, room G03-228, University Medical Centre Utrecht, Heidelberglaan 100, 3584 CX Utrecht, Netherlands
- 21Department of Anesthesia, University of Iowa, Roy J. and Lucille A. Carver College of Medicine, Iowa City, IA, USA
- 22The Brain and Spine Center, Lankenau Medical Center, Wynnewood, PA, USA
- 23Division of Neurosurgery, Department of Clinical Neurosciences, Addenbrooke’s Hospital, University of Cambridge, Cambridge CB2 0QQ, UK
- 24Department of Critical Care, University Medical Centre Groningen, University of Groningen, Groningen, Netherlands
- 25Usher Institute of Population Health Sciences and Informatics, University of Edinburgh, Edinburgh, UK
- 26Dell School of Medicine, University of Texas, Austin, TX, USA
- 27Division of Critical Care Neurology, Columbia University College of Physicians and Surgeons, New York, USA
- Correspondence to: R Loch Macdonald, Labatt Family Centre of Excellence in Brain Injury and Trauma Research, Keenan Biomedical Research Centre of the Li Ka Shing Knowledge Institute of St Michael’s Hospital, Department of Surgery, University of Toronto, 30 Bond Street, Toronto, ON, Canada, M5B 1W8 macdonaldlo{at}smh.ca
- Accepted 24 November 2017
Abstract
Objective To develop and validate a set of practical prediction tools that reliably estimate the outcome of subarachnoid haemorrhage from ruptured intracranial aneurysms (SAH).
Design Cohort study with logistic regression analysis to combine predictors and treatment modality.
Setting Subarachnoid Haemorrhage International Trialists’ (SAHIT) data repository, including randomised clinical trials, prospective observational studies, and hospital registries.
Participants Researchers collaborated to pool datasets of prospective observational studies, hospital registries, and randomised clinical trials of SAH from multiple geographical regions to develop and validate clinical prediction models.
Main outcome measure Predicted risk of mortality or functional outcome at three months according to score on the Glasgow outcome scale.
Results Clinical prediction models were developed with individual patient data from 10 936 patients and validated with data from 3355 patients after development of the model. In the validation cohort, a core model including patient age, premorbid hypertension, and neurological grade on admission to predict risk of functional outcome had good discrimination, with an area under the receiver operator characteristics curve (AUC) of 0.80 (95% confidence interval 0.78 to 0.82). When the core model was extended to a “neuroimaging model,” with inclusion of clot volume, aneurysm size, and location, the AUC improved to 0.81 (0.79 to 0.84). A full model that extended the neuroimaging model by including treatment modality had AUC of 0.81 (0.79 to 0.83). Discrimination was lower for a similar set of models to predict risk of mortality (AUC for full model 0.76, 0.69 to 0.82). All models showed satisfactory calibration in the validation cohort.
Conclusion The prediction models reliably estimate the outcome of patients who were managed in various settings for ruptured intracranial aneurysms that caused subarachnoid haemorrhage. The predictor items are readily derived at hospital admission. The web based SAHIT prognostic calculator (http://sahitscore.com) and the related app could be adjunctive tools to support management of patients.
Introduction
Subarachnoid haemorrhage from a ruptured intracranial aneurysm (SAH) is a relatively uncommon but severe subtype of stroke that is associated with a sudden dramatic onset in otherwise apparently healthy individuals and often results in poor outcomes. On average, a third of affected individuals do not survive; at least one in five of those who do survive are unable to regain functional independence.1 SAH is unlike the more common ischaemic stroke as it affects younger adults (median age 55) and therefore results in disproportionately many years of lost productive life.12 Predicting the outcome of this condition can be challenging given the considerable heterogeneity in the characteristics of affected individuals and their clinical course and variability in morphology of the aneurysm. Reliance on clinical intuition alone might be insufficient for accurate prognosis of outcome.3 Thus, it is important that clinicians, affected individuals, and their family members have reliable evidence based tools that could inform expectations of outcome and decisions about treatment. This is important as reliance on clinical judgment alone could lead to overly pessimistic expectation of outcomes, which potentially could lead to withholding of treatment that otherwise could be lifesaving.3
Clinical prediction models statistically combine a set of characteristics of the patient and disease to estimate the probability of an outcome. They can be useful decision support tools, assisting clinicians in the complex choices they make about patient management and, in turn, facilitating evidence informed discussions with the patient and family members around outcome expectations for shared decision making.4 According to some studies, outcome prediction tools can outperform clinical intuition in patients with stroke.5 Several prediction models and risk scores have been developed for patients with SAH, but their uptake into clinical practice is limited.6 The reasons might be related to the use of suboptimal study design and analysis in the development of these tools, the lack of representativeness, the ease of use in clinical setting, or the absence of evidence of their generalisability in different settings, as shown in a systematic review.6 Therefore, validated easy to use prediction tools are urgently needed to support the management of SAH.
We developed and validated a set of clinical prediction models to support management after hospital admission of patients with SAH.
Methods
Study design and data source
We assembled a multidisciplinary team of researchers who collaborated to establish a repository of datasets of randomised clinical trials, prospective observational studies, and hospital registries. We previously reported the purpose, structure, and content of this database called the subarachnoid haemorrhage international trialists’ (SAHIT) repository,78 which archives the de-identified patient level data of patients with SAH from tertiary health institutions from different geographical regions, including Europe, North America, Oceania, and Asia, and datasets of randomised controlled trials. The development cohort included 10 936 patients from seven randomised controlled trials9101112131415 and two prospective observational hospital registries.161718 The randomised controlled trials were the Clazosentan to Overcome Neurological Ischemia and Infarction occurring after SAH trial; Intraoperative Hypothermia for Aneurysm Surgery Trial; Intravenous Magnesium Sulphate for Aneurysmal Subarachnoid Haemorrhage trial; International Subarachnoid Aneurysm Trial; the Tirilazad trials; the Magnesium Sulphate in Aneurysmal Subarachnoid Haemorrhage trials; and the Heinrich Heine University Concomitant Intraventricular Fibrinolysis and Low-Frequency Rotation After Severe Subarachnoid Haemorrhage trial. The prospective registries were the dataset of subarachnoid treatment of the University of Washington and the subarachnoid haemorrhage outcomes project of Columbia University. We excluded the following available datasets from the analysis: a hospital cohort from the University of Chicago; the Matrix and Platinum Science trial; the Neurocognitive Outcome Observational Studies from the University of Leeds; and another from the University of Durham. These studies did not record or provide data on clinical severity at admission or on outcomes (Glasgow outcome scale or modified Rankin scale). Table A in the appendix presents their details and specific reasons for the exclusion. The validation cohort included 3355 patients from seven studies (three randomised controlled trials and four hospital registries) that contributed data for archiving in the repository after the development of the prediction models. The trials were the British Aneurysm Nimodipine trial,19 the Acute Systemic Erythropoietin Therapy to Reduce Delayed Ischemic Deficits following SAH, and the Effects of Acute Treatment with Statins on Cerebral Autoregulation in patients after SAH trials.20 The hospital series were from Kurashiki Central Hospital, Japan; St Michael’s Hospital, Toronto, Canada; University Medical Centre Utrecht SAH Registry; and the Swiss study on SAH—a nationwide registry of SAH from Switzerland.21 We excluded two datasets from the validation analysis: the albumin in subarachnoid haemorrhage trial and the cerebral aneurysm re-rupture after treatment study (table A in the appendix for the reasons for the exclusion). None of the randomised controlled trials found a significant treatment effect for the studied intervention; this allowed us to pool data from both treatment and control groups in our analysis. The exceptions were for the British Aneurysm Nimodipine trial, as patients who received oral nimodipine had reduced incidence of cerebral infarction and improved outcome, and the International Subarachnoid Aneurysm Trial, as outcome differed in patients who were treated by surgical clipping and those who were treated by endovascular coiling. We included treatment modality as a predictor in the models. In all studies, a very small proportion of patients re-bled and some had the aneurysm revisited, the exception was the clazosentan study.
Variable selection
In a published systematic review, we identified relevant predictors of outcome in patients with SAH.6 We searched PubMed, Embase, and Web of Science databases without language or time restrictions to retrieve relevant studies. Eligible studies had a primary endpoint of mortality or functional outcome assessed with the modified Rankin scale or the Glasgow outcome scale. The review was conducted according to PRISMA guidelines. Based on the results of this published review, we selected the following predictor variables that are assessable early at hospital admission and are consistently associated with outcomes for inclusion in the prediction models:
Age (kept as continuous predictor in the analysis)
Clinical severity on admission measured by the World Federation of Neurosurgical Societies (WFNS) scale (five category ordinal scale)
Premorbid history of hypertension (yes or no)
Volume of subarachnoid haemorrhage on computed tomography on admission (according to the four category Fisher grade)
Size and the location of the ruptured aneurysm
Method of treatment (whether the patient had surgical clipping, endovascular coiling, or conservative treatment only).
In the analysis, we categorised aneurysm size as ≤12 mm, 13-24 mm, or ≥25 mm and aneurysm location as anterior cerebral artery (including ruptured anterior communicating artery aneurysms), internal carotid artery aneurysms, middle cerebral artery aneurysms, or posterior circulation aneurysms (including vertebral and basilar artery aneurysms).
Outcome measure
The outcome measure was score on the Glasgow outcome scale at three months. On this five category ordinal scale, 1=dead, 2=persistent vegetative state, 3=severe disability, 4=moderate disability, and 5=good recovery (fig 1). The scale was dichotomised for mortality (1 v 2-5) or for functional outcome (unfavourable (1, 2, 3) v favourable (4, 5)). We imputed scores at two month for the International Subarachnoid Aneurysm Trial and scores at six month for the Washington University registry and the Erythropoietin trial datasets. For the Kurashiki hospital and Swiss studies, in which outcome was assessed at 12 months with the modified Rankin scale (mRS), we imputed this for the Glasgow outcome scale (GOS) as follows: mRS score 0 and 1 = GOS score 5, mRS score 2 and 3 = GOS score = 4, mRS score 4 = GOS score 3, mRS score 5 = GOS score 2, mRS score of 6 = GOS score 1. Previous studies have used similar techniques to input outcome measures for prognostic modelling.22223

Scores and definitions for Glasgow outcome scale
Model development
We used frequency tables and box plots to study the distributions of categorical variables and restricted cubic splines to explore non-linearity in the effect of age.24 The association between predictor variables and Glasgow outcome scale was analysed by fitting proportional odds logistic regression models adjusting for the fixed effect of study. Prognostic strength was quantified as odds ratios with 95% confidence intervals. The relative importance of each predictor in the models was estimated with partial R2 statistic, which estimates the independent contribution of the predictor to the variance of the outcome. Using binary logistic regression analysis, we developed two sets of prediction models: one set to predict mortality, the other set to predict functional outcome. Each set consisted of three models in increasing order of complexity:
Core model including patient age, WFNS grade on admission, and a premorbid history of hypertension
Neuroimaging model consisting of the core model plus volume of subarachnoid haemorrhage on computed tomography on admission and size and location of ruptured aneurysm lumen
Full model that extended the neuroimaging model to include treatment modality.
In all, we developed six prediction models and performed a post hoc sensitivity analysis to examine interaction terms between predictors using likelihood ratio tests.
Model performance
We evaluated the overall predictive accuracy of the models with the R2 statistic.25 Model discrimination—the ability of the models to differentiate between patients who did or did not have a poor outcome—was evaluated with AUC (area under the receiver operator characteristics) curves. A perfect model will have an AUC of 1 whereas a non-informative model will have an AUC of 0.5. Model calibration—the ability of the models to produce unbiased estimates of the probability of the outcome—was evaluated graphically with calibration plots (plots of observed versus predicted outcomes) and statistically by computing the following three measures of calibration:
A goodness of fit test of the model in the development cohort
Calibration-in-the-large, which reflects the difference between the average of observed outcomes and the average of predicted outcomes. This statistic corresponds to the intercept of the regression model refitted with the linear predictors only at validation. A value of 0 indicates perfect calibration. Values less than or greater than 0 indicate average under or over-estimation of the outcome, respectively25
Recalibration slope, which is the slope of the refitted model. It represents the average predictor effects. A value of 1 indicates perfect agreement between the strength of the predictors in the development and validation data. Values less than or greater than 1 indicate on average stronger or weaker predictor effects.25
Model validation
The following procedures were used for model validation:
Internal validation, which evaluates the stability of a prediction model to random changes in sample composition. Internal validation was performed by the bootstrap resampling technique, in which regression models were fitted in 500 bootstrap replicates, drawn with replacement from the development sample. The model was refitted in each bootstrap replicate and tested on the original sample to estimate optimism in model performance
Internal-external validation: involving cross validation by omission of each constituent study of the development set in turn. The AUC derived from this procedure for each study was pooled with a random effects model, and heterogeneity between studies was assessed with the I2 statistic
External validation was performed with the validation datasets.
We also pooled the AUCs from the individual studies of the validation set using a random effects model, and assessed heterogeneity between studies with the I2 statistic.
Handling of missing data
Some data were missing for all variables, except for age and treatment modality. We filled in missing data using the technique of multiple imputation by chained equations, which samples imputed values from the posterior predictive distributions of missing data.26 We assumed data were missing at random.25 The imputation model was specified on all predictors, outcomes, and dummy variables for study. We generated 20 datasets for analysis that were identical with respect to non-missing data but could vary on imputed values. In all, we imputed 4309 of the 54 680 values (7.9%) needed for the core model; 9286 of the 87 488 values (10.6%) needed for the neuroimaging model; and 9286 of the 98 424 values (9.4%) needed for the full model. The significance level was set at 5%. All analyses were performed with the R software (version 2.15.3; R Foundation for Statistical Computing) using the rms and MICE packages; and Stata version 13.1 (Statacorp, College Station, TX).
Patient involvement
Patients were not involved in setting the research question or the study design. The outcome measures were designed to incorporate functional outcomes of importance to patients such as asking them how they are functioning with their jobs and/or family. Patient advocacy groups, including the Brain Aneurysm Foundation, will be consulted to advice on and facilitate the research dissemination to their members, including input on writing the research summaries, utility of the web calculator for lay users, and mobile application.
Results
Model development
Table 1 compares the distribution of variables between the development and the validation cohorts. Tables 2 and 3 show the breakdown by study. The median age was 53 (interquartile range 44-62) in the development cohort and 55 (46-65) in the validation cohort. Most patients were women (71% and 64%, respectively). In the development cohort, 13% (1317) of patients died and 29% (2971) survived with unfavourable outcome. The proportions in the validation cohort were 17% (483) and 28% (809), respectively. Ruptured aneurysms were more often clipped than coiled in the development cohort; in the validation cohort, however, they were more often coiled than clipped. We found the effect of age could be adequately modelled as a linear function, though a soft inflection point was noted at about age 60. There was no significant correlation between individual predictor variables. As shown in table 4, WFNS grade on admission had the strongest prognostic effect (partial R2=12.0%); followed by age (R2=1.9%); treatment modality (R2=1.3%); clot burden on computed tomography (R2=0.65%); premorbid history of hypertension (R2=0.37%); aneurysm size (R2=0.12%); and aneurysm location (R2=0.06%). The predictors collectively explained 23-31% of the variability in outcome.
Distribution of predictor variables in development and validation cohorts for model for prediction of outcome after aneurysmal subarachnoid haemorrhage. Data shown without imputation
Characteristics of development cohorts used to create outcome prediction model for aneurysmal subarachnoid haemorrhage. Figures do not include missing data
Characteristics of validation cohorts used to create outcome prediction model for aneurysmal subarachnoid haemorrhage. Figures do not include missing data
Association between predictors and three month outcome after aneurysmal subarachnoid haemorrhage, with odds ratios derived from proportional odds analysis
Internal-external validation
Bootstrap resampling showed negligible model optimism. The models had internally validated AUCs between 0.77 and 0.83. There was no significant lack of fit (goodness of fit P≥0.2 in all models). Cross validated performance was variable across studies (fig 2 and table B in the appendix). The partial R2 values ranged between 4% and 46%, and the pooled AUC values were between 0.74 and 0.77. Model performance was better in hospital registry cohorts than in cohorts from randomised controlled trials. The best performance was in the Columbia University cohort (R2=41-46%; AUC 0.83-0.85) and the lowest performance in the clazosentan trial cohort (R2=4-15%; AUC 0.64-0.72). Outcomes were somewhat poorer than predicted in hospital registry cohorts and better than predicted in randomised controlled trial cohorts (table B in the appendix). Nonetheless, the hospital registry cohorts had calibration-in-the-large values that were closer to the ideal value of 0 and recalibration slope values that were closer to the ideal values of 1 compared with their counterparts from randomised controlled trials, indicating better calibration in the former than the latter cohort. Performance indices were slightly better for the models to predict functional outcome (R2=15-46%; AUC 0.66-0.85) than the models to predict mortality (R2=5-42%; AUC 0.64-0.85). Extension of the core models to include neuroimaging parameters and treatment choices had a modest effect on performance: the AUC improved on average 0.01 but not uniformly in the constituent cohorts of the development set (fig 2).

AUC values in leave-one-study-out cross validation (internal-external validation) of model to predict outcome after subarachnoid haemorrhage with mortality outcome on left and functional outcome on right (weights from random effects analysis)
External validation
The SAHIT prediction models performed well in the pooled validation dataset and the different constituent samples (see figs 3 and 4; table C in the appendix). In the pooled dataset, R2 values were between 22% and 31%. The AUC ranged between 0.76 and 0.81, indicating all models had good discrimination. Discrimination was better with the models to predict functional outcome than the models to predict mortality (AUC range 0.80-0.81 v 0.76-0.78). Discrimination improved somewhat with increasing model complexity (fig 3). Overall, predictive accuracy and discrimination varied significantly across studies (I2=67%, P=0.016 for full model predicting mortality). Better performance values were noted in the hospital registry cohorts than the randomised controlled trial cohorts (fig 3, table C in the appendix). The best R2 and AUC values were obtained in the Swiss study cohort (R2=31-35%; AUC 0.80-0.82). All models showed good calibration in the pooled data (fig 4). Some miscalibration was noted, with the models to predict mortality slightly underestimating observed mortality risk and the models to predict unfavourable outcome slightly overestimating observed unfavourable outcome. The confidence intervals were narrow, however, and generally included the observed risk of the outcome.
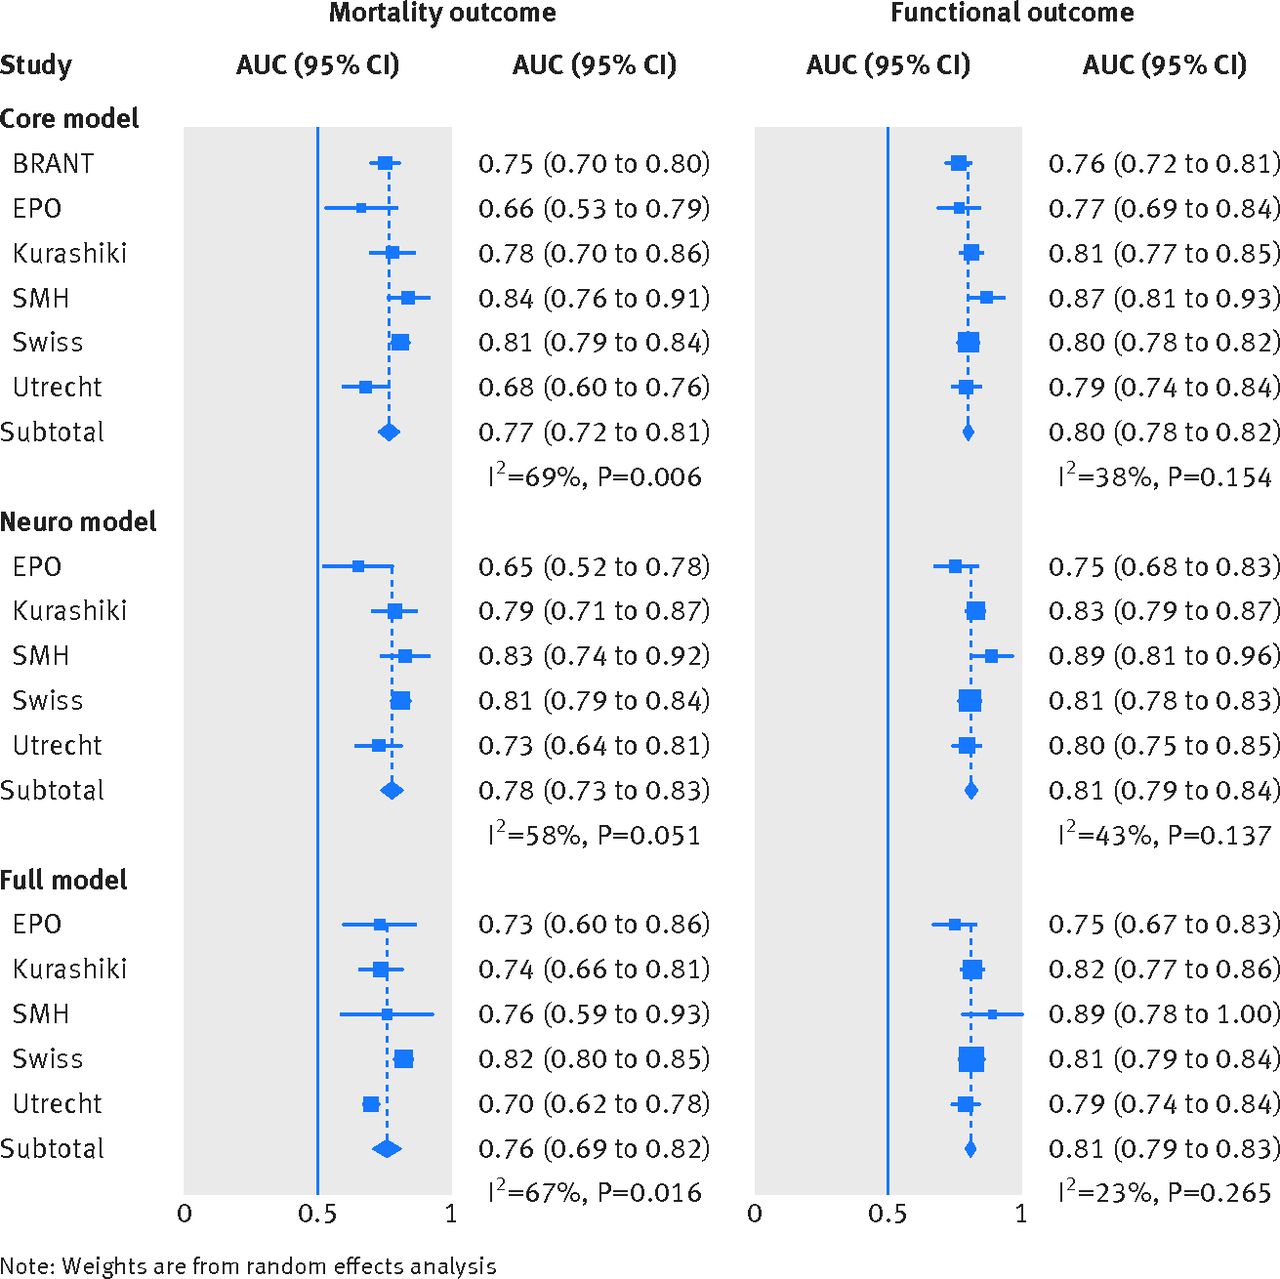
AUC values in pooled validation dataset for model to predict outcome after subarachnoid haemorrhage with mortality outcome on left and functional outcome on right (weights from random effects analysis)

Calibration plots in pooled validation dataset for model to predict outcome after subarachnoid haemorrhage
Sensitivity analysis
Some interaction terms were significant at the 5% level, including that between age and WFNS grade, age and hypertension, and aneurysm location and treatment modality. Inclusion of these interaction terms in the main (“full”) model did not result in improved performance at apparent validation (table D in the appendix).
Model presentation
We developed an online prognostic calculator based on the prediction models’ algorithms that is accessible at http://sahitscore.com. Also available are applications for handheld devices. The SAHIT prognostic calculator computes the probabilities of mortality and functional outcomes at three months, with the associated error margins, given values of the predictor items for a patient. Table E in the appendix provides the intercept and coefficients for the different models to support independent validation studies.
Discussion
Our prediction models for outcome in patients with subarachnoid haemorrhage performed robustly in a validation cohort from different geographical regions, time periods, and settings of care. The models were well calibrated and had good discrimination. The externally validated AUC was 0.80-0.81 for the models to predict functional outcome and 0.76-0.78 for the models to predict mortality. The predictor items are assessable at hospital admission. The web based calculator could facilitate the adoption into clinical practice.
Strengths and weaknesses of the study
There are potential limitations to our study. The development set included more trial cohorts than unselected hospital cohorts, which could account for the relatively low proportion of patients who died (13%) or survived with an unfavourable outcome (29%). These proportions, however, are consistent with other outcomes reported in the literature.2 The patients were also enrolled over a wide time period, during which there has been a trend towards increased adoption of endovascular coiling over surgical clipping and more aggressive treatment of ruptured aneurysms, even in elderly patients. Nonetheless, we found the models were robust in the validation cohort with mostly unselected hospital patients, who were more recently treated and in whom ruptured aneurysms were more often coiled than clipped.
Although the follow-up time period varied somewhat, especially in the validation cohort, the models performed well in the different constituent samples, including those with follow-up at three or six months (see fig 3 and table C in the appendix), indicating robustness to differences in the duration of follow-up. The best performance was in the Swiss study cohort with follow-up at 12 months, which suggests that our prediction models could also reliably predict long term outcome.
The reliability of the models might be confounded by measurement errors as aneurysm size and the volume of the subarachnoid haemorrhage on computed tomography might have been assessed with different methods of imaging and measurement techniques across studies. Volume might be difficult to reliably reproduce with current high resolution cranial computed tomography. In clinical practice, however, various institutions use different imaging techniques. Therefore, the use of different imaging techniques might be a strength rather than a limitation. Though the predictor variables in the models are the most prognostic for subarachnoid haemorrhage, they collectively explained a small proportion of the variability in outcomes (data on overall predictive accuracy as assessed by the R2 statistic), suggesting that the outcomes are dependent on several other factors that were not and could not have been fully captured in the study.
There is the possibility of updating the models as more reliable predictors of outcome of subarachnoid haemorrhage are identified. It should be noted, however, that prediction models generally have R2 values in the range of those of our study, and, for purposes of assessing prediction in new patients, discrimination and calibration are the important indices.232425 Secondary complications that occur during the clinical course, especially re-bleeding and delayed cerebral ischaemia, could potentially impact outcome negatively and hence the accuracy of our models as the predictions are based on predictor items that are derived at admission. Nonetheless, the development and validation cohorts included patients who re-bled and in whom the aneurysm was recoiled or surgically repaired. Rather than exclude all patients with missing data from the analysis, we used data imputation to reduce the impact of data loss. The proportion of missing data also differed between the development and validation sets. Multiple imputation is now widely accepted and increasingly used after theoretical and empirical evidence that the technique is superior to the traditional complete case analysis.25 The best scenario would have been that data were completely available for all patients. For cogent reasons, we had to exclude some studies that were available at the development or validation stage, creating the potential for selection bias. Finally, our study was not population based, hence the models do not account for the small proportion of individuals who might have died before hospital admission.
Comparison with previous studies
Several prediction models for outcome of subarachnoid haemorrhage have been described, though their clinical use is rare. Some examined the validity of predicting mortality in hospital with generic risk scores designed for critically ill patients admitted to the intensive care unit—for example, the simplified acute physiologic score II.2728 These risk scores are not specific for subarachnoid haemorrhage, and their validity to predict outcomes other than mortality in hospital is unknown. Most specific prediction models were developed from small datasets, indicating a lack of power; or they reflect experience from a single hospital, therefore potentially useful only in the context of that hospital.629 Few, if any, have been validated for use in clinical practice. The FRESH score was developed from the Columbia University dataset and is designed to predict cognitive and quality of life outcomes at one year based on the Hunt and Hess grade, APACHE-II physiological scores at admission, age, and whether an aneurysm re-bled within 48 hours of the ictus.29 The score was, however, externally validated for three month functional outcome according to the modified Rankin scale in the highly selected clazosentan trial cohort (AUC 0.77).29
A relatively older prognostic model was developed from 3521 patients who were enrolled between 1980 and 1983 into the prospective multicentre observational international cooperative study on the timing of aneurysm surgery.30 This model preceded the widespread use of nimodipine, early aneurysm repair, and endovascular coiling. These changes in treatment have improved outcomes after subarachnoid haemorrhage and potentially could influence the reliability of the model.
Some previous studies developed prediction models exclusively from clinical trial datasets, including those of the cooperative aneurysm study of intravenous nicardipine after SAH,31 the tirilazad trials in SAH,32 and the international subarachnoid aneurysm trial.33 Dijkland and colleagues validated the international subarachnoid aneurysm trial model for two month case fatality in an independent cohort of 307 patients from a single hospital.34 Their study showed that though the model had good discrimination, it calibrated poorly in the unselected hospital series. The international subarachnoid aneurysm trial included only patients at equipoise to be treated with endovascular coil embolisation or surgical clipping, which could explain the finding. The homogenous nature of trial cohorts, excluded patients, and treatment effects of simply being enrolled in a trial might constrain the utility in unselected hospital patients. This much is corroborated by the results of the validation analysis of our study, which showed better performance in hospital registry cohorts than trial cohorts. In terms of study power and representativeness, our prediction models far exceed prior prediction models or risk scores for use in patients with subarachnoid haemorrhage. In addition, we present extensive validation data on mortality and functional outcomes in consecutive hospital patients from different regions. Predicting functional outcome is probably more meaningful to current practice as more patients survive the condition now than in previous years,2 and the discussions around expectations of outcome might now be dominated by concerns around the quality of functioning.
Implications for patient education, clinical practice, and research
Patients with subarachnoid haemorrhage and their relatives need reliable information about the prognosis of this acutely devastating condition so they can participate effectively in shared decision making. This is important as they are less likely to rely only on the clinician’s intuition in making treatment decisions.3 The web based prognostic calculator is freely accessible and could serve as a resource to support patient education and inform discussions around outcome expectations and management, including rehabilitation needs.5 For instance, the SAHIT prognostic calculator could be useful in the outpatient clinic when doctors counsel patients with unruptured intracranial aneurysms about the prognosis of aneurysm rupture. In this regard, it complements other evidence based tools such as the PHASES score to assess the risk of intracranial aneurysm rupture.35 Our calculator also could be useful to track the progress of recovery at three month follow-up visit and beyond and might be useful at the time of discharge to inform rehabilitation plans. In the acute care setting, the tool could facilitate evidence informed discussions with the patient and family members about outcome expectations for shared decision making and to facilitate timely referral to centres with the resources to provide the best outcomes. There is growing consensus to regionalise management of subarachnoid haemorrhage, and indeed other types of stroke, as it seems that patients have better outcomes where there is multidisciplinary care.36 Many affected patients, however, first present to centres that might lack the necessary resources to optimally treat subarachnoid haemorrhage, and they might first be seen by clinicians with less experience in management. Timely referral of a patient is critical as it can improve outcome after subarachnoid haemorrhage.36 Our simple core model including age, premorbid history of hypertension, and neurological status on admission is potentially useful in settings where there is a high possibility of subarachnoid haemorrhage but timely referral is constrained by factors such as delays in obtaining confirmatory computed tomography of the head or a lumber puncture, among others.
This model had discrimination and calibration that are comparable with those of the extended models, including neuroimaging findings and treatment modality. We suggest that once results of computed tomography are available, the neuroimaging model that incorporates such findings should be used to refine the prediction. The choice of treatment might impact the utility of a prediction model of subarachnoid haemorrhage. The “full” model makes consideration for the nuances of treatment choice and expectation bias on the models’ predictions. For patients at equipoise, endovascular coil embolisation is preferred to surgical clip ligation.12 For the many other patients, choice of treatment depends on multiple factors, including the treating clinicians’ preference and resource availability, among others. As not all patients will benefit from definitive intervention, some clinicians take a cautious approach sometimes withholding definitive repair for some patients, particularly elderly patients who remain in poor neurological condition during hospital admission, who might be judged to do poorly ultimately or in whom life expectancy is anticipated to be short. Such treatment choice can be self fulfilling and should be accounted for to reduce the effect of expectation bias.
Our prediction models could also be useful to develop and evaluate an alternative model of care that integrates evidence from a suit of prediction models for outcomes after subarachnoid haemorrhage and secondary complications such as re-bleeding, seizure, and delayed cerebral ischaemia to identify those patients at an early stage who might need more or less aggressive monitoring after the ruptured aneurysm is secured. Guidelines could be developed in consultation with stakeholders on how to put this care model into action to facilitate the step up or step down of patients between costly high intensive care units and less expensive areas of the hospital to optimise resource utilisation without compromising quality of care.37 Finally, the SAHIT prediction models could be useful for research purposes and the advance of design and analysis of clinical trials in subarachnoid haemorrhage. For example, they could provide a more evidence informed approach to patient selection in trials of novel treatments.
Conclusion
The SAHIT prediction models were based on patient data from different regions and settings of care and included 10 936 patients in the development set; they reliably estimated outcome in 3355 patients in the validation set. By comparison, the most commonly used outcome prediction model in traumatic brain injury included 9205 patients in the development set (http://www.tbi-impact.org). The predictor items in the SAHIT prediction models are readily available at hospital admission, and their prognostic value is well recognised. We have developed an app and a web calculator based on the prediction algorithms (http://sahitscore.com) to support patient education, clinical practice, and future research.
What is already known on this topic
Subarachnoid haemorrhage (SAH) from a ruptured intracranial aneurysm occurs mostly at the age when individuals are likely to be at the peak of their career
The prognosis could be poor and challenging to predict
Several tools have been reported to aid prediction of outcome, but available tools have major weaknesses that potentially limit their routine use in clinical practice
What this study adds
An easy to use practical prediction tool was developed with the data from a large multinational population of patients to predict mortality and functional outcomes after subarachnoid haemorrhage
The tool performed satisfactorily in a different set of patients who were treated at different regions and settings of care
The SAHIT prognostic calculator could support clinical practice, aid patient education, and enhance research
Acknowledgments
We thank the patients whose anonymised data were used for this research.
Additional members of the SAHIT Collaboration
Adam Noble (King’s College London); Audrey Quinn (General Infirmary, Leeds); Benjamin Lo (Montreal Neurological Institute and Hospital, McGill University, Montreal); Hector Lantigua (Columbia University); Jeff Singh (Toronto Western Hospital, University of Toronto); Ming-Yuan Tseng (Medicines and Healthcare Products Regulatory Agency, London); Thomas Schenk (Friedrich-Alexander University, Erlangen)
Additional members of the Swiss SOS
Emanuela Keller, Luca Regli, and Jan-Karl Burkhardt (University Hospital Zurich); Ali-Reza Fathi, Javier Fandino, (Cantonal Hospital Aarau); Daniel Zumofen, and Michel Röthlisberger, (University Hospital Basel); Martin A Seule (Cantonal Hospital St Gallen); Christian Fung, Andreas Raabe (Inselspital Berne); Philippe Bijlenga (University Hospital Geneva); Roy Thomas Daniel, Rodolfo Maduri, (University Hospital Lausanne); Daniele Valsecchi (Cantonal Hospital Lugano).
Footnotes
Contributors: RLM initiated the SAHIT Collaboration, monitored data collection for the study, supervised the study, and revised and approved the final version of the manuscript. He is guarantor. BNRJ cleaned and merged the datasets, co-designed the analysis plan, performed the statistical analysis, and drafted and revised the paper. HFL and EWS co-designed the analysis plan, contributed statistical analysis codes, and revised the draft paper. The other authors and all members of the SAHIT collaboration designed the study, contributed data, and revised the draft paper.
Funding: This work was supported by a grant from the Canadian Institutes for Health Research, Personnel Award from the Heart and Stroke Foundation of Canada, an early researcher award from the Ontario Ministry of Research and Innovation, and a special overseas scholarship to BNRJ from the Rivers State Government of Nigeria.
Competing interests: All authors have completed the ICMJE uniform disclosure form at www.icmje.org/coi_disclosure.pdf and declare: no support from any organisation for the submitted work; RLM receives grant support from the Physicians Services Incorporated Foundation, Brain Aneurysm Foundation, Canadian Institutes for Health Research, and the Heart and Stroke Foundation of Canada and is chief scientific officer of Edge Therapeutics; GS is supported by the distinguished clinician scientist award from Heart and Stroke Foundation of Canada (HSFC); SM is a consultant to Actelion Pharmaceuticals; PLeR is a member of the scientific advisory board of Edge Therapeutics and Cerebrotech and provides regular consultation for Integra LifeSciences, Depuy-Synthes, Codman, and Neurologica; no other relationships or activities that could appear to have influenced the submitted work.
Ethical approval: The study was approved by the research ethics board of the St Michael’s Hospital, Toronto, Canada.
Data sharing: Patient level data and statistical codes are available from the corresponding author. Participants consent was not obtained and the study involved de-identified data; hence, the risk of patient identification is low.
Transparency: The lead author (RLM) affirms that this manuscript is an honest, accurate, and transparent account of the study being reported; that no important aspects of the study have been omitted; and that any discrepancies from the study as planned (and, if relevant, registered) have been explained.
This is an Open Access article distributed in accordance with the Creative Commons Attribution Non Commercial (CC BY-NC 4.0) license, which permits others to distribute, remix, adapt, build upon this work non-commercially, and license their derivative works on different terms, provided the original work is properly cited and the use is non-commercial. See: http://creativecommons.org/licenses/by-nc/4.0/.