Blood pressure and complications in individuals with type 2 diabetes and no previous cardiovascular disease: national population based cohort study
BMJ 2016; 354 doi: https://doi.org/10.1136/bmj.i4070 (Published 04 August 2016) Cite this as: BMJ 2016;354:i4070
- Samuel Adamsson Eryd, postdoctoral researcher1 2 3,
- Soffia Gudbjörnsdottir, professor1 2,
- Karin Manhem, professor2,
- Annika Rosengren, professor2 3,
- Ann-Marie Svensson, research advisor1,
- Mervete Miftaraj, statistician1,
- Stefan Franzén, senior statistician1,
- Staffan Björck, associate professor1
- 1Centre of Registers Västra Götaland, Gothenburg, Sweden
- 2Department of Molecular and Clinical Medicine, Sahlgrenska Academy, University of Gothenburg, Gothenburg, Sweden
- 3Sahlgrenska University Hospital/Östra Hospital, Gothenburg, Sweden
- Correspondence to: S Adamsson Eryd samuel.adamssoneryd{at}registercentrum.se
- Accepted 15 July 2016
Abstract
Objectives To compare the risk associated with systolic blood pressure that meets current recommendations (that is, below 140 mm Hg) with the risk associated with lower levels in patients who have type 2 diabetes and no previous cardiovascular disease.
Design Population based cohort study with nationwide clinical registries, 2006-12. The mean follow-up was 5.0 years.
Setting 861 Swedish primary care units and hospital outpatient clinics.
Participants 187 106 patients registered in the Swedish national diabetes register who had had type 2 diabetes for at least a year, age 75 or younger, and with no previous cardiovascular or other major disease.
Main outcome measures Clinical events were obtained from the hospital discharge and death registers with respect to acute myocardial infarction, stroke, a composite of acute myocardial infarction and stroke (cardiovascular disease), coronary heart disease, heart failure, and total mortality. Hazard ratios were estimated for different levels of baseline systolic blood pressure with clinical characteristics and drug prescription data as covariates.
Results The group with the lowest systolic blood pressure (110-119 mm Hg) had a significantly lower risk of non-fatal acute myocardial infarction (adjusted hazard ratio 0.76, 95% confidence interval 0.64 to 0.91; P=0.003), total acute myocardial infarction (0.85, 0.72 to 0.99; P=0.04), non-fatal cardiovascular disease (0.82, 0.72 to 0.93; P=0.002), total cardiovascular disease (0.88, 0.79 to 0.99; P=0.04), and non-fatal coronary heart disease (0.88, 0.78 to 0.99; P=0.03) compared with the reference group (130-139 mm Hg). There was no indication of a J shaped relation between systolic blood pressure and the endpoints, with the exception of heart failure and total mortality.
Conclusions Lower systolic blood pressure than currently recommended is associated with significantly lower risk of cardiovascular events in patients with type 2 diabetes. The association between low blood pressure and increased mortality could be due to concomitant disease rather than antihypertensive treatment.
Introduction
Several major hypertension guidelines have recently changed their recommended goal for systolic blood pressure in patients with diabetes.1 2 3 Instead of aiming for below 130 mm Hg, the current guidelines recommend below 140 mm Hg. The consequences of the changed guidelines are unknown.
Over the past 16 years, during which the previous recommendations were in effect, the average systolic blood pressure among Swedish primary care patients with type 2 diabetes has decreased by 15 mm Hg. In 2015, the average blood pressure of 300 000 patients was 135/76 mm Hg.4 The overall excess risk of death among individuals with type 2 diabetes has fallen to a historically low 15%.5
The reason for the new blood pressure target was the lack of randomised studies with conclusive results to support the goal of below 130 mm Hg, together with information based on post hoc analyses of clinical trials and register studies.1 These observational studies have usually shown a J shaped relation between blood pressure and cardiovascular events, with an increased risk at the highest and lowest levels.
The relevance of this J curve phenomenon has been called into question given that observational studies of clinical trial data could be flawed by uncontrolled confounding—that is, major disease is a possible cause of low blood pressure.6 If so, the problem is exacerbated by the tendency of clinical trials to focus on patients at advanced stages of disease and an increased risk of cardiovascular events as a means of ensuring sufficient statistical power and reasonable study size.
Earlier studies based on the Swedish national diabetes register have also shown a tendency toward a J shaped relation between blood pressure and cardiovascular disease in patients with type 2 diabetes. To ensure statistical significance, however, they included patients with previous cardiovascular disease. The register has grown substantially over the past decade, enabling appropriate selection of patients while still enabling sufficient statistical power. To test our hypothesis that the J curve phenomenon is caused by concomitant comorbidities, we examined the predictive value of systolic blood pressure at baseline for future cardiovascular events among patients with type 2 diabetes after excluding those with a history of cardiovascular or other major disease. In addition, we used several methods to minimise uncontrolled confounding by other risk factors.
We aimed to compare the risk associated with a systolic blood pressure that meets current recommendations with the risk of lower levels in patients who have type 2 diabetes and no previous cardiovascular disease.
Methods
This study was based on information from linking the Swedish national diabetes register, hospital discharge register, cause of death register, and prescribed drug register.
Databases
The diabetes register has been described previously.7 It was launched in 1996 as a tool for quality assurance in diabetes care. The register contains information about risk factors, complications, and treatment among patients aged 18 and over. Trained nurses and physicians report at least once a year either online or by electronic transmission of patients’ charts. Data are collected during appointments at specialist clinics and primary healthcare centres nationwide. All patients give their informed consent before inclusion. During the study period of 2006-13, the register doubled in size to about 300 000 patients. In 2015, it covered an estimated 90% of Swedish adults with type 2 diabetes.4
The hospital discharge register, cause of death register, and prescribed drug register are administered by the Swedish National Board of Health and Welfare. Since 1987, the hospital discharge register has included data for all inpatient care. As of 2001, data from outpatient appointments with both private and public care providers has also been included. The data concern diagnoses, procedures, and length of stay. The cause of death register contains data for all Swedes, regardless of whether they died in Sweden or abroad. The prescribed drug register contains information about all dispensed prescriptions in Sweden since 1 July 2005.8
Study population
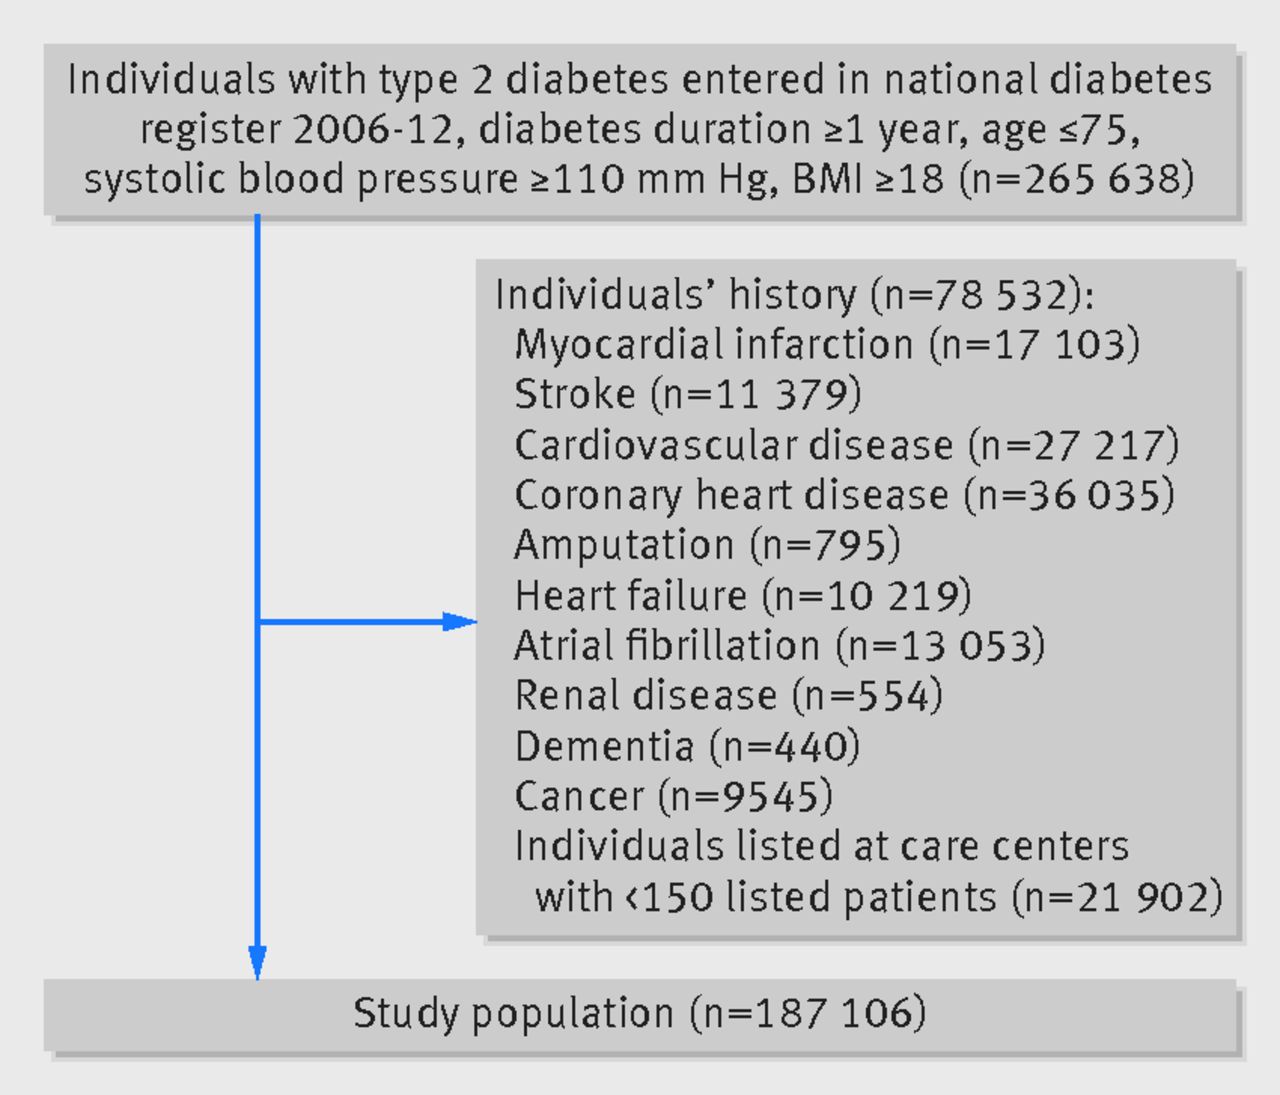
Patients with type 2 diabetes who had been entered in the diabetes register from 1 January 2006 to 31 December 2012 for whom systolic blood pressure data were available were eligible for inclusion in the study. The inclusion criteria were diabetes duration for at least a year, systolic blood pressure ≥110 mm Hg, age ≤75, and BMI ≥18. We included 265 638 individuals at 1320 care units. After exclusion of those at units with fewer than 150 patients (see below) or a history of acute myocardial infarction, stroke, coronary heart disease, heart failure, atrial fibrillation, end stage renal disease, amputation, dementia, or cancer at baseline, 187 106 individuals remained for further analysis (fig 1⇓). The highest exclusion rate because of previous cardiovascular disease was among patients with the lowest blood pressure. The total population before exclusion is described in the appendix.

Fig 1 Enrolment of participants in study of blood pressure and complications in individuals with type 2 diabetes and no previous cardiovascular disease
Type 2 diabetes was defined as either treatment with diet only, oral hypoglycaemic agents only, or onset of diabetes age ≥40 and treatment with insulin alone or combined with oral hypoglycaemic agents.
Baseline examinations and definitions
The index date was defined as the first examination after the patient had been included in the diabetes register. The inclusion criteria of the presence of diabetes for at least year ensured that patients had been monitored and treated for a sufficient length of time before the baseline variables were entered. The clinical characteristics reported to the diabetes register at baseline (the index date) were age, sex, duration of diabetes, systolic blood pressure, diastolic blood pressure, HbA1c, type of hypoglycaemic treatment, weight, height, total cholesterol, high density lipoprotein cholesterol, triglycerides, microalbuminuria and macroalbuminuria, and smoking status. Blood pressure was measured in accordance with national standards in the seated or supine position by either a physician or nurse with either oscillometric or auscultatoric methods. Smoking status was either yes or no.
All laboratory analyses were performed at local laboratories. HbA1c values were expressed in mmol/mol in accordance with the International Federation of Clinical Chemistry (IFCC) standard. Body mass index (BMI) was calculated as weight/height2. Low density lipoprotein cholesterol concentration was calculated in accordance with Friedewald’s formula.9 Microalbuminuria was defined as two positive results for three samples obtained within one year, with positivity defined as an albumin/creatinine ratio of 3-30 mg/mmol (about 30-300 mg/g) or urinary albumin clearance of 20-200 μg/min (20-300 mg/L) on two out of three consecutive tests. Macroalbuminuria was defined as an albumin/creatinine ratio >30 mg/mmol (about 300 mg/g) or urinary albumin clearance >200 μg/min (>300 mg/L). Individuals were defined as current users of drugs if they had a recorded purchase four months or less before the index date. Renal function measured as estimated glomerular filtration rate (eGFR) was based on the modification of diet in renal disease study equation.10
Follow-up and definition of endpoints
All individuals were followed from the index date until a first event, death, or the end of follow-up on 31 December 2013. The studied endpoints were non-fatal or total acute myocardial infarction, non-fatal or total stroke, a composite of acute myocardial infarction and stroke (cardiovascular disease), non-fatal or total coronary heart disease, non-fatal heart failure, and total mortality. Cardiovascular disease was defined as acute myocardial infarction or stroke, whichever came first.
We used ICD-10 (international classification of diseases, 10th revision) for classification of diseases and used both primary and contributory diagnoses. Acute myocardial infarction was defined as a diagnosis of myocardial infarction (I21). Stroke was defined as a diagnosis of intracerebral haemorrhage, cerebral infarction, or unspecified stroke (I61, I63, I64). Coronary heart disease was defined as a diagnosis of non-fatal myocardial infarction, angina pectoris, subsequent myocardial infarction, certain current complications after myocardial infarction, other acute ischaemic heart disease, chronic ischaemic heart disease, percutaneous coronary intervention, and/or coronary artery bypass grafting (I20 to I25). Heart failure was defined as a diagnosis of heart failure (I50). Fatal events of acute myocardial infarction, stroke, cardiovascular disease, and coronary heart disease were included only if the primary recorded cause of death was either disease of the circulatory system (I00-I99) or endocrine, nutritional, or metabolic disease (E00-E90).
History of atrial fibrillation was defined as ICD-10 code I48. History of end stage renal disease was defined as codes Z94.0, Z49.1, Z49.2, or Z99.2. History of dementia was defined as codes G300, G301, G308, G309, and F00-F03. History of cancer was defined as codes C00-C97.
All events were obtaining by linking Swedish personal identity numbers with the hospital discharge register and cause of death register. Validation studies of the hospital discharge register (also known as the national inpatient register) have shown high overall specificity.11
Statistics
The sample was assigned to six groups of systolic blood pressure: 110-119 mm Hg, 120-129 mm Hg, 130-139 mm Hg, 140-149 mm Hg, 150-159 mm Hg, and ≥160 mm Hg. Between 4.8% and 34.7% of participants were missing information about at least one laboratory measurement. Details about missing values are provided in the appendix. The highest rate of missing values was for low density lipoprotein cholesterol. We used multiple imputation, generating 10 imputed datasets, to avoid a reduction in sample size. Risk estimates remained essentially unchanged after multiple imputations, as opposed to complete case analysis. We used the Kaplan-Meier estimator to study incidence of endpoints over time across the blood pressure groups. The proportional hazards assumption was confirmed by plotting the negative log of the estimated survivor functions against time. Cox proportional hazards regression was used to estimate hazard ratios for the relation between systolic blood pressure groups and incidence of various cardiovascular endpoints. The 130-139 mm Hg group was used for reference purposes.
We tested two different models. Both models were adjusted for age, sex, duration of diabetes, type of diabetes treatment, HbA1c, smoking status, low density lipoprotein cholesterol, high density lipoprotein cholesterol, triglycerides, microalbuminuria, and macroalbuminuria. BMI and eGFR were used as categorical variables because of their non-linear relation with mortality. The second model was also adjusted for thiazide diuretics, loop diuretics, calcium antagonists, spironolactone, β blockers, and drugs for heart disease. These covariates were chosen after a separate analysis of their contribution to the model (see appendix for greater detail). As a covariate of treatment intensity at the care unit, we used the proportion of patients receiving triple therapy—that is, a combination of a thiazide diuretic, calcium antagonist, and either a renin-angiotensin system inhibitor or angiotensin II blocker (renin-angiotensin-aldosterone (RAAS) blocking agent). The hypothesis was that the approach offers an indicator for a step-up strategy and thus a measure of low blood pressure because of antihypertensive treatment rather than spontaneous low blood pressure. We chose this covariate after testing several similar variables (see appendix). To avoid outlier bias, we determined the frequency of use of the triple drug regimen by examining individuals in the 125-140 mm Hg range at clinics with at least 150 patients. We excluded 21 902 individuals because their clinics had too few patients. A secondary analysis also looked at the relations between systolic blood pressure and the various outcomes with individuals with previous disease included in the models. The appendix provides additional methodological details.
All analyses were performed in SAS version 9.4 (SAS Institute, Cary, NC).
Patient involvement
No patients were involved in setting the research question or the outcome measures, nor were they involved in recruitment, or the design and implementation of the study. There are no plans to involve patients in dissemination.
Results
A total of 187 106 individuals were included in the study. Table 1⇓ shows the baseline characteristics of the various systolic blood pressure groups. The average number of antihypertensive agents varied from 0.7 in the lowest blood pressure group to 1.6 in the highest. The mean systolic blood pressure in each of the blood pressure categories was skewed to the lower end of the range.
Baseline characteristics of 187 106 participants with various systolic blood pressure levels. Figures are numbers (percentage) unless stated otherwise
Table 2⇓ shows the number of endpoints during a mean follow-up period of five years. A total of 12 152 individuals (6.5%) died during the period, 3663 (30%) of the deaths were classified as cardiovascular. Table C in the appendix shows the causes of death in the various blood pressure groups. The lowest blood pressure group (110-119 mm Hg) had the highest rates of mortality from infection; diseases of the nervous, respiratory, and digestive systems; and external causes of morbidity.
Number of events in various systolic blood pressure groups during five year mean follow-up period. Figures are numbers (percentage) of participants
Figure 2⇓ shows the cumulative incidence of non-fatal cardiovascular disease for various baseline systolic blood pressures. The unadjusted risk of developing non-fatal cardiovascular disease was lowest in the group with lowest baseline systolic blood pressure.

Fig 2 Kaplan-Meier analysis of non-fatal cardiovascular events, showing proportion of patients with events (composite of nonfatal myocardial infarction or stroke) in different systolic blood pressure groups
Figure 3⇓ shows the relation between baseline systolic blood pressure and the different endpoints, adjusted for potential covariates. The lowest systolic blood pressure group (110-119 mm Hg) was associated with a significantly lower risk of non-fatal acute myocardial infarction (hazard ratio 0.76, 95% confidence interval 0.64 to 0.91; P=0.003), total acute myocardial infarction (0.85, 0.72 to 0.99; P=0.04), non-fatal cardiovascular disease (0.82, 0.72 to 0.93; P=0.002), total cardiovascular disease (0.88, 0.79 to 0.99; P=0.04), and non-fatal coronary heart disease (0.88, 0.78 to 0.99; P=0.03) than the reference group (130-139 mm Hg). Similar trends, though not significant, were observed for stroke and total coronary heart disease.

Fig 3 Hazard ratios in various systolic blood pressure groups for outcomes of non-fatal AMI (acute myocardial infarction), total AMI, non-fatal stroke, total stroke, non-fatal CVD (cardiovascular disease), total CVD, non-fatal CHD (coronary heart disease), total CHD, heart failure, and total mortality
The lowest systolic blood pressure group (110-119 mm Hg) was associated with a significantly increased risk of heart failure and total mortality. Table 3⇓ shows the characteristics of patients who survived or died in the group with the lowest systolic blood pressure at baseline and the reference blood pressure group (130-139 mm Hg). Patients in the lowest blood pressure group who died had the highest rate of smoking (31.8%) as well as the most treatment with loop diuretics and spironolactone.
Baseline characteristics of individuals who died compared with those who survived in group with lowest blood pressure and in reference group
Overall, we found no indications of a J shaped relation between systolic blood pressure and the endpoints, with the exception of heart failure and total mortality. A secondary analysis, however, presented in the appendix, showed that systolic blood pressure exhibited a more or less J shaped relation with all studied outcomes when the regression models included individuals who had previous disease.
Discussion
This observational study of 187 106 individuals with type 2 diabetes who did not have previous cardiovascular disease shows that those with systolic blood pressure lower than 120 mm Hg have a significantly lower long term risk of myocardial infarction, cardiovascular disease, and coronary heart disease than those with a systolic blood pressure of 130-139 mm Hg, which would meet the currently recommended goal.
Furthermore, we found no J shaped relation between systolic blood pressure and stroke, myocardial infarction, or coronary heart disease. We did, however, find a J shaped relation for both all cause mortality and heart failure. A secondary analysis showed that systolic blood pressure also exhibited a more or less a J shaped relation with all studied outcomes when we included patients with previous disease. Accordingly, the J curve relation observed in real world data depends on patient selection and the extent to which comorbidity can be adjusted for.
The new goal of below 140 mm Hg for systolic blood pressure in patients with diabetes is based on several mainly observational studies.1 2 3 The European guidelines highlight four studies as providing “supportive evidence” against reducing systolic blood pressure to below 130 mm Hg. The most often cited study is the randomised Action to Control Cardiovascular Risk in Diabetes blood pressure trial (ACCORD BP), which failed to show any significant benefit for the primary composite cardiovascular endpoint from intensive antihypertensive treatment.12 The trial did, however, show that the risk of stroke was reduced by 40% in the group assigned to systolic blood pressure below 120 mm Hg. The rate of cardiovascular events was only half of that which had been expected when the study size was planned. The next two studies were post hoc analyses of clinical trials showing a J shaped relation between blood pressure and prognosis. Post hoc analysis of data from the Ongoing Telmisartan alone and in combination with the Ramipril Global Endpoint Trial (ONTARGET) showed that neither myocardial infarction nor cardiovascular death was related to baseline systolic blood pressure.13 Based on a subgroup analysis of patients with low blood pressure who experienced a cardiovascular event, the authors concluded that a higher baseline risk, rather than excessive reduction of blood pressure, was a key determinant of the J curve phenomenon.
A post hoc analysis of data from the International Verapamil SR/Trandolapril Study (INVEST), a comparison of a β blocker and calcium antagonist based antihypertensive treatment strategy, showed that patients with systolic blood pressure below 130 mm Hg did not experience any favourable effect compared with those with blood pressure of 130-140 mm Hg. Thus, the authors proposed a treatment goal of 130-139 mm Hg.14 In this study, however, patients with systolic blood pressure below 130 mm Hg had the least antihypertensive treatment, measured both as the number and dose of drugs. The finding indicates that lower blood pressure was not a treatment effect but might have been caused by other disease.
The fourth highlighted study, NDR-BP-II, was an observational study of 53 553 individuals with type 2 diabetes that found a J curved relation between blood pressure and several cardiovascular complications.15 The national diabetes register has, however, grown considerably in size over the past decade, enabling appropriate selection of patients while still ensuring sufficient statistical power, as shown in the present study. While previous studies based on the diabetes register have included patients with a history of cardiovascular disease, we have shown here that excluding them eliminates the J curve phenomenon for several, but not all, endpoints. Simple adjustment for these comorbidities in the regression models, as in the NDR-BP-II study, was not sufficient to eliminate the J curve. These findings strengthen the hypothesis that the J curve phenomenon is caused by more patients with comorbidities in the lowest blood pressure groups.
The results of the Systolic Blood Pressure Intervention Trial (SPRINT) have reset the debate about optimal levels.16 The randomised design for two different blood pressure targets was similar to the ACCORD BP study, but more than twice as many patients were included. Patients with diabetes, however, were excluded. SPRINT showed that the treatment goal of below 120 mm Hg was associated with much better outcomes than below 140 mm Hg. As discussed in a recent editorial, these two studies exhibit many similarities and point to the same conclusion—that is, that more intensive antihypertensive treatment than the current recommendation provides additional protection from cardiovascular events.17
Several recent reviews and meta-analyses have summarised the literature but arrived at different conclusions regarding the benefits of antihypertensive treatment below 140 mm Hg.6 18 19 20 21 We analysed the risk related to systolic blood pressure at baseline, regardless of whether it was due to antihypertensive treatment or uncontrolled confounding (concomitant disease, etc). We tried to minimise uncontrolled confounding in several ways. Firstly, we included only patients who had had diabetes for a year or more, which ensured adequate monitoring and treatment before baseline. Like the ACCORD and NDR-BP-II studies, we had an upper age limit and excluded patients aged ≥76 to minimise the impact of concomitant disease. We also excluded those with previous coronary heart disease, stroke, atrial fibrillation, cancer, or BMI <18, as well as the few with systolic blood pressure below 110 mm Hg, which was outside of the scope of the study. In addition, we used drug prescription data as markers for comorbidity and treatment intensity. Finally, missing data were imputed to preserve study size and maximise statistical power.
By selecting patients without previous reports of cardiovascular disease, we eliminated the J curve relation between blood pressure and stroke, myocardial infarction, and coronary heart disease. Of concern, however, is that our adjustments did not eliminate the J curve relation with total mortality. Worth noting is that the group with the lowest blood pressure also received the least antihypertensive treatment. We cannot therefore draw any conclusions about harmful effects of intensive antihypertensive treatment. Patients in the group with the lowest blood pressure who died also had indications of more serious conditions, including a high rate of smoking and treatment with loop diuretics, spironolactone, and drugs for heart disease. They also had the highest rates of mortality from infection; diseases of the nervous, respiratory, and digestive systems; and external causes. Thus, this group would seem to include patients with a favourable prognosis, as well as a subgroup with complications that led to a high mortality rate. As the ONTARGET study concluded, the high mortality is probably more associated with high baseline risk rather than excessive reduction in blood pressure.13
Controlled clinical trials have the advantage of well defined endpoints that can be examined when they appear and assessed in accordance with strict criteria in a blinded fashion, while the endpoints in observational studies, such as ours, rely on endpoints with varying degrees of accuracy. Data on stroke and myocardial infarction from the hospital discharge register are highly reliable.11 These diagnoses are usually based on a clinical evaluation on acute admission to hospital, which is highly important for ensuing treatment. The situation for our other endpoints, including heart failure and total mortality, is different. Completeness of reporting and the date of onset are uncertain for heart failure, angina pectoris, and certain other cardiovascular diagnoses, given that primary care data are not included in the hospital discharge register. It is evident from the drug prescription data that some patients who do not have previous diagnoses of major diseases use drugs that are indicated for cardiovascular complications (spironolactone, furosemide, etc, and possibly β blockers as well). For causes of death, cardiovascular endpoints often appear together with other potentially fatal diagnoses, such as cancer, infection, or psychiatric problems. The cause of death register includes all deaths, regardless of whether they occurred in hospital or elsewhere. Fewer than 20% of death certificates are based on autopsy reports.22 Furthermore, considerable discrepancies have been reported between certificates and hospital discharge records.22 We believe that this difference in the accuracy of outcome measurements explains the fact that the almost linear relation between systolic blood pressure and risk for the most well defined endpoints was attenuated when we added less accurate and fatal endpoints. The J shaped relation was pronounced when the outcome was based solely on mortality data.
Strengths and limitations
The main strength of our study is the large number of participants, including patients from a nationwide diabetes register, with a high participation rate and data obtained from day-to-day clinical practice. The size of the register made it possible for us to select participants suitable for the aims of our study without loss of statistical power.
We did not examine the effect of blood pressure during the follow-up period as this could have introduced additional confounding. A decline in blood pressure during follow-up can be caused by comorbidity, changes in treatment or lifestyle, or a disease that is not easy to control for. Reliance on a single measurement is likely to introduce a regression dilution effect because of the variability in blood pressure over time. This might lead to an attenuation of the relation between blood pressure and outcome.23
The observed skewness of the mean systolic blood pressure in each blood pressure category is possibly due to digit preference for the nearest 10 mm Hg. The true systolic blood pressure is likely to be closer to the middle value than that reported.
One limitation of our study is that it did not include individuals with complications or those aged over 75. We believe that caution should be exercised when using observational studies to draw conclusions about recommended treatment goals for blood pressure among high risk patients. There will always be uncertainty as to whether low blood pressure is an effect of treatment or a disease that cannot be controlled for. As a result, our study possibly underestimated the prophylactic effect of lower blood pressure because the register based design could not fully correct for unreported disease that leads to low blood pressure and increased risk.
Conclusions
In conclusion, lower systolic blood pressure than currently recommended is associated with a significantly lower risk of cardiovascular events in patients with type 2 diabetes. The association between low blood pressure and increased mortality could be caused by concomitant disease rather than antihypertensive treatment.
What is already known on this topic
Hypertension is one of the major risk factors for cardiovascular disease, and the management of hypertension is a high priority in the treatment of type 2 diabetes
Recent hypertension guidelines have raised the target blood pressure for patients with diabetes from below 130 mm Hg to below 140 mm Hg because of a lack of conclusive randomised studies to support the lower goal, together with observational studies showing a J shaped relation between blood pressure and complications
What this study adds
Lower systolic blood pressure than currently recommended is associated with a significantly lower risk of cardiovascular events in patients with type 2 diabetes
Adjustment for comorbidity, mainly by exclusion of patients with previous cardiovascular disease, eliminates the J curve relation between blood pressure and stroke, myocardial infarction, and coronary heart disease
The association between low blood pressure and increased mortality might be caused by concomitant disease rather than antihypertensive treatment
Footnotes
We thank the regional coordinators, participating nurses, physicians, and other staff members who have contributed to the national diabetes register. Most of all, we thank the patients who support the register, both individually and collectively through the Swedish Diabetes Federation.
Contributors: SAE and SB conceived and designed the study, drafted the manuscript, and are guarantors. SAE, SB, SF, A-MS, and SG expanded on the study concept and design. SG, A-MS, and MM contributed to data collection. SAE, SB, and SF performed the statistical analyses. SF provided statistical expertise. SAE, SB, SF, A-MS, KM, AR, and SG interpreted the data. All authors reviewed and critically revised the draft and approved the final version.
Funding: This study was supported by grants from the Region Västra Götaland in Sweden, the Swedish Heart and Lung Foundation, Diabetes Wellness, the Swedish Diabetes Foundation, the Swedish Council for Working Life and Social Research (Epilife), and the Swedish Research Council.
Competing interests: All authors have completed the ICMJE uniform disclosure form at www.icmje.org/coi_disclosure.pdf and declare: no support from any organisation for the submitted work; no financial relationships with any organisations that might have an interest in the submitted work in the previous three years; no other relationships or activities that could appear to have influenced the submitted work.
Ethical approval: The regional ethical review board at the University of Gothenburg approved the study.
Data sharing: No additional data available.
Transparency: The lead authors affirm that the manuscript is an honest, accurate, and transparent account of the study being reported; that no important aspects of the study have been omitted; and that any discrepancies from the study as planned have been explained.
This is an Open Access article distributed in accordance with the Creative Commons Attribution Non Commercial (CC BY-NC 3.0) license, which permits others to distribute, remix, adapt, build upon this work non-commercially, and license their derivative works on different terms, provided the original work is properly cited and the use is non-commercial. See: http://creativecommons.org/licenses/by-nc/3.0/.