Glycaemic control in type 1 diabetes during real time continuous glucose monitoring compared with self monitoring of blood glucose: meta-analysis of randomised controlled trials using individual patient data
BMJ 2011; 343 doi: https://doi.org/10.1136/bmj.d3805 (Published 07 July 2011) Cite this as: BMJ 2011;343:d3805
- John C Pickup, professor of diabetes and metabolism1,
- Suzanne C Freeman, medical statistics student23,
- Alex J Sutton, professor of medical statistics2
- 1Diabetes Research Group, Division of Diabetes and Nutritional Sciences, King’s College London School of Medicine, Guy’s Hospital, London SE1 1UL, UK
- 2Department of Health Sciences, University of Leicester, Leicester, UK
- 3MRC Clinical Trials Unit, London
- Correspondence to: J C Pickup john.pickup{at}kcl.ac.uk
- Accepted 12 May 2011
Abstract
Objective To determine the clinical effectiveness of real time continuous glucose monitoring compared with self monitoring of blood glucose in type 1 diabetes.
Design Meta-analysis of randomised controlled trials.
Data sources Cochrane database for randomised controlled trials, Ovid Medline, Embase, Google Scholar, lists of papers supplied by manufacturers of continuous glucose monitors, and cited literature in retrieved articles.
Studies reviewed Randomised controlled trials of two or more months’ duration in men and non-pregnant women with type 1 diabetes that compared real time continuous glucose monitoring with self monitoring of blood glucose and where insulin delivery was the same in both arms.
Analysis Two step meta-analysis of individual patient data with the primary outcome of final glycated haemoglobin (HbA1c) percentage and area under the curve of hypoglycaemia (glucose concentration <3.9 mmol/L) during either treatment, followed by one step metaregression exploring patient level determinants of HbA1c and hypoglycaemia.
Results Six trials were identified, consisting of 449 patients randomised to continuous glucose monitoring and 443 to self monitoring of blood glucose. The overall mean difference in HbA1c for continuous glucose monitoring versus self monitoring of blood glucose was −0.30% (95% confidence interval −0.43% to −0.17%) (−3.0, −4.3 to −1.7 mmol/mol). A best fit regression model of determinants of final HbA1c showed that for every one day increase of sensor usage per week the effect of continuous glucose monitoring versus self monitoring of blood glucose increased by 0.150% (95% credibility interval −0.194% to −0.106%) (1.5, −1.9 to −1.1 mmol/mol) and every 1% (10 mmol/mol) increase in baseline HbA1c increased the effect by 0.126% (−0.257% to 0.0007%) (1.3, −2.6 to 0.0 mmol/mol). The model estimates that, for example, a patient using the sensor continuously would experience a reduction in HbA1c of about 0.9% (9 mmol/mol) when the baseline HbA1c is 10% (86 mmol/mol). The overall reduction in area under the curve of hypoglycaemia was −0.28 (−0.46 to −0.09), corresponding to a reduction in median exposure to hypoglycaemia of 23% for continuous glucose monitoring compared with self monitoring of blood glucose. In a best fit regression model, baseline area under the curve of hypoglycaemia was only weakly related to the effect of continuous glucose monitoring compared with self monitoring of blood glucose on hypoglycaemia outcome, and sensor usage was unrelated to hypoglycaemia at outcome.
Conclusions Continuous glucose monitoring was associated with a significant reduction in HbA1c percentage, which was greatest in those with the highest HbA1c at baseline and who most frequently used the sensors. Exposure to hypoglycaemia was also reduced during continuous glucose monitoring. The most cost effective or appropriate use of continuous glucose monitoring is likely to be when targeted at people with type 1 diabetes who have continued poor control during intensified insulin therapy and who frequently use continuous glucose monitoring.
Introduction
Continuous glucose monitoring uses a wire-type glucose sensor implanted in the subcutaneous tissue to monitor the glucose concentration of interstitial fluid in people with diabetes. Initially introduced into clinical practice in 1999 for short term, retrospective analysis of blood glucose control1 (where review of glucose traces allows healthcare professionals to advise on changes in therapy), continuous glucose monitoring is also now available for real time use and provides information on direction, magnitude, frequency, and duration of glycaemic oscillations on a moment to moment basis to aid control of diabetes by patients themselves.2 However, evidence from randomised controlled trials for the effectiveness of continuous glucose monitoring at improving glycaemic control in type 1 diabetes compared with conventional self monitoring of blood glucose has only recently appeared.3 4 5 6 7 8 In these trials the mean reduction in glycated haemoglobin (HbA1c) percentage with continuous glucose monitoring versus self monitoring of blood glucose has ranged from about 0.1% to 0.6% (1 to 6 mmol/mol), depending on age (those <25 years showed no significant reduction in HbA1c in the Juvenile Diabetes Research Foundation trial5), and particularly usage of the sensor: participants who used continuous glucose monitoring for more than 70% of the time or near continuously generally experienced the best reduction in HbA1c levels.3 7 8 9
The most cost effective use of continuous glucose monitoring in diabetes is likely to involve targeted use in those who will possibly benefit the most. We hypothesised that the clinical effectiveness of continuous glucose monitoring would be best in those people with type 1 diabetes who have the worst control at baseline (as noted in one study9) and who use the sensor most often. As it is extremely limited to test the effect of baseline HbA1c, sensor usage, and other covariates on continuous glucose monitoring outcome from a synthesis of aggregate or summary data in published trials,10 we carried out a meta-analysis of individual patient data from randomised controlled trials of real time continuous glucose monitoring compared with self monitoring of blood glucose, where variables such as age, duration of diabetes, days a week of sensor use, and baseline HbA1c were available for individual trial participants.
Methods
We followed suggestions for reporting and conduct of individual patient data meta-analysis as outlined previously.11 We identified trials without language restriction published up to June 2010 that met the inclusion criteria by searching the Cochrane database for randomised controlled trials, Ovid Medline, Embase, Google Scholar (search terms “diabetes mellitus”, “diabetes mellitus type 1”, “continuous glucose monitoring”, “clinical trial”, “meta-analysis”, “systematic review”), lists of papers supplied by the manufacturers of continuous glucose monitors, and cited literature in retrieved articles. Two independent reviewers (JCP and SCF) decided trial eligibility.
We selected for inclusion only studies that were randomised controlled trials and that compared glycaemic control and hypoglycaemia in participants with type 1 diabetes treated by intensive insulin therapy (multiple daily insulin injections or continuous subcutaneous insulin infusion) where either real time continuous glucose monitoring or self monitoring of blood glucose was used throughout the study for at least two months. We excluded observational studies, short term trials (<2 months), studies in pregnant women, trials in type 2 diabetes, extensions of previous studies, trials using retrospective continuous glucose monitoring without real time read out of glucose values, and trials where the insulin treatment differed in the two arms—for example, multiple daily insulin injections and self monitoring of blood glucose compared with continuous subcutaneous insulin infusion and continuous glucose monitoring.12 13 Trial quality was assessed by the components of a six point scale, according to the method of Jadad et al,14 but with an additional item for the method of allocation concealment. Excluded studies are available from the authors.
Data extraction and acquisition
Data on individual participants were obtained from the trialists, the funding sponsors who held the trial data, or the trial coordinating centres. We asked the sources to provide information on individual trial participants, including age, duration of diabetes, treatment allocation (continuous glucose monitoring or self monitoring of blood glucose), sensor usage (days a week), baseline and completion HbA1c percentage, and baseline and completion number of episodes of severe hypoglycaemia and hypoglycaemia measured as area under the curve for blood glucose concentrations <3.9 mmol/L (70 mg/dL). The area under the curve was obtained in each study from a period of blinded continuous glucose monitoring at the start and completion of the trial (median duration six days).
We did not obtain complete individual patient data on severe hypoglycaemia and therefore two independent reviewers extracted summary data from the text, tables, and graphs of published eligible trial reports on severe hypoglycaemia. Differences over interpretation were resolved by consensus after discussion.
Outcome measures
We assessed glycaemic control at study completion, as measured by HbA1c level and change in HbA1c from baseline, along with area under the curve of hypoglycaemia at study completion and change in area under the curve from baseline. The secondary outcome was the rate of severe hypoglycaemia at trial completion and the change in severe hypoglycaemia from baseline. Severe hypoglycaemia was defined as that requiring third party assistance, as recommended by the American Diabetes Association.15 We did not analyse data for other measures of continuous glucose monitoring, such as time in target range, because we could not obtain complete data for these measures from all trialists.
Statistical analyses
We carried out meta-analysis of individual patient data on HbA1c and area under the curve of hypoglycaemia. Initially we modelled individual patient data for each trial using a linear regression model including terms that distinguished between the continuous glucose monitoring and self monitoring of blood glucose treatment groups and baseline measurements. Using a random effect meta-analysis we then combined these to calculate an overall effect size for difference in means, and we explored robustness by carrying out meta-analysis with a fixed effect model. This strategy is often referred to as a two step approach to synthesis.11 We initially ln transformed the data for area under the curve of hypoglycaemia.
To explore the effect of patient level covariates on outcome, we carried out a further one step metaregression analysis by creating a single large dataset from the individual patient data. In this way we explored determinants of final HbA1c or area under the curve of hypoglycaemia using Bayesian approaches with covariates for baseline HbA1c, sensor use, age, duration of diabetes, and interactions between the covariates and baseline HbA1c. Initially we fitted all covariates in individual models, and then we created best fit models considering all covariates of interest. Covariates were considered in a stepwise manner, where the deviance information criterion16 was used for choosing between models, with differences in the criterion of three or more considered to be important. Because exploring patient level covariates in this way over multiple studies means associations are estimated as a combination of between study and within study variability, we tested for potential ecological bias by estimating the effects of covariates separately, decomposing the variability between studies and within studies.17 Outlying points were considered by plotting the deviance residuals against the leverage for each participant. We removed any outlying points and reanalysed the final model to ensure model results were robust to the exclusion of the most influential points.
We calculated the incidence rate ratio for severe hypoglycaemia from the aggregate data provided in trial reports using the number of events of severe hypoglycaemia and the number of person years in each arm of the trial.18 Using the Poisson distribution and a log link we calculated a generalised linear mixed model with random effects, to model treatment effect on the event rate.18
Potential publication bias was assessed by visual inspection of a contour enhanced funnel plot.19 We assessed heterogeneity between trials by the I2 statistic,20 with greater than 50% representing substantial heterogeneity and greater than 75% considerable heterogeneity.
Stata version 11 was used for the two stage individual patient data analysis and the analysis of severe hypoglycaemia. We used the Bayesian Markov Chain Monte Carlo software in WinBUGS version 1.4.3 to carry out the regression analyses on individual patient data. We fitted all variables with vague prior distributions. For all models we used a minimum burn-in of 50 000 and sample size of 50 000. All models were checked for the convergence of all variables using the history and density plots available in WinBUGS version 1.4.3. To ensure convergence for more complex models, we required iterations of up to 400 000 burn-in and 400 000 sample size. To confirm convergence of the best fitting regression model, we fitted these with two different sets of initial values and produced a Gelman-Rubin plot to check convergence. Further details of the statistical methods are available on request.
Results
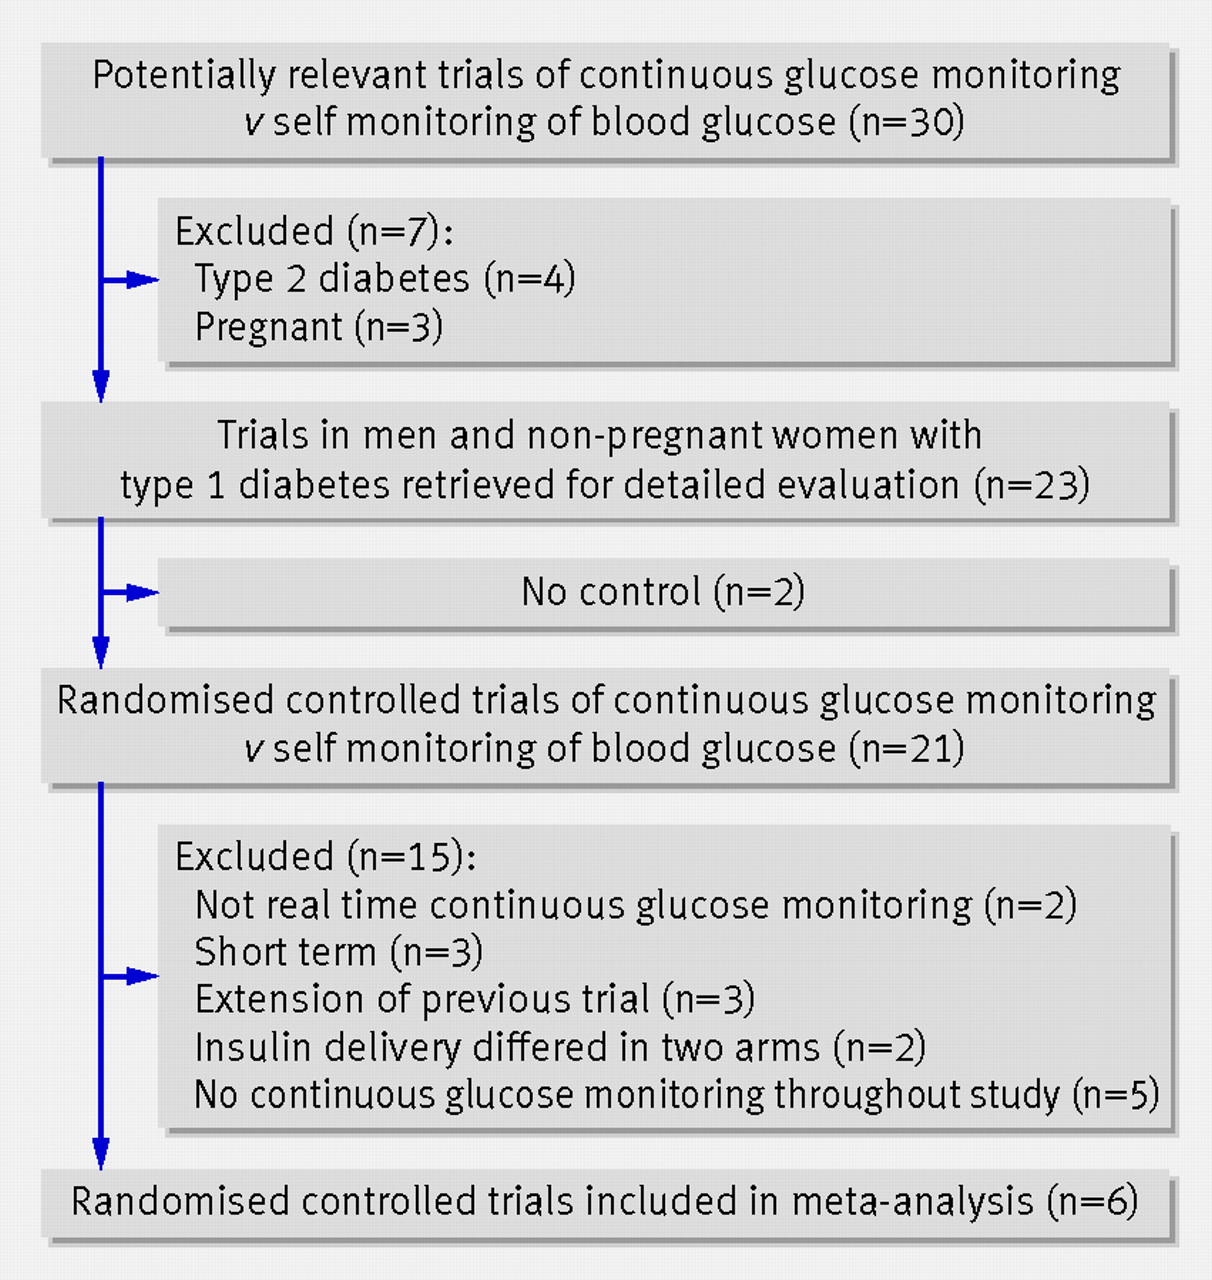
The initial literature search identified 30 trials comparing glycaemic control in people with diabetes using continuous glucose monitoring or self monitoring of blood glucose (fig 1⇓). Twenty four studies were excluded: four were in type 2 diabetes, three were in pregnant diabetic women, two did not have a control group, two used retrospective rather than real time continuous glucose monitoring, three were of short duration, three were an extension of previous studies, two used a different method of insulin delivery in the continuous glucose monitoring compared with self monitoring of blood glucose arm, and five did not use continuous glucose monitoring throughout the entire study.
Study characteristics
Six randomised controlled trials were eligible for meta-analysis.3 4 5 6 7 8 For one study we considered data from the uninterrupted use of continuous glucose monitoring and self monitoring of blood glucose arms only and not the arm where continuous glucose monitoring was used for three days every two weeks.3 All six trials scored 3 out of 6 on the study quality scale because of the absence of double blinding and lack of information on concealment. Table 1⇓ shows the characteristics of the studies, which were all parallel group, randomised controlled trials in type 1 diabetes. The study duration ranged from 13 to 26 weeks and the dropout rate varied from 1.6% to 12.9%. Insulin delivery was by continuous subcutaneous insulin infusion alone in three trials and continuous subcutaneous insulin infusion or multiple dose insulin injections in three trials. Individual patient data for HbA1c and area under the curve of hypoglycaemia were obtained from all six studies.
Characteristics of trials included in meta-analysis
Mean overall change in HbA1c level
Information was available on 892 people with type 1 diabetes randomly allocated to continuous glucose monitoring (n=449) and self monitoring of blood glucose (n=443). When an initial two step approach with a random effects model was used, the overall estimated reduction in HbA1c was 0.30% (95% confidence interval −0.43% to −0.17%) (3.0, −4.3 to −1.7 mmol/mol) when continuous glucose monitoring was compared with self monitoring of blood glucose (fig 2⇓). The I2 statistic (47.2%) indicated some heterogeneity between the six studies, although the effect size was similar with a fixed effect model (−0.28%, −0.36% to −0.19%) (−2.8, −3.6 to −1.9 mmol/mol).

Fig 2 Two step approach meta-analysis using individual patient data for difference in HbA1c percentage between continuous glucose monitoring and self monitoring of blood glucose using random effects model. Overall mean difference for all six trials was 0.30% (3 mmol/mol), favouring continuous glucose monitoring
Independent determinants of HbA1c
When the individual patient data from all studies were used in a one step approach, the final best fit regression model of the determinants of the final HbA1c level on continuous glucose monitoring or self monitoring of blood glucose included effects for baseline HbA1c, age, treatment (continuous glucose monitoring or self monitoring of blood glucose), and the frequency of sensor usage (table 2⇓). The largest effects resulted from the additive influences of baseline HbA1c and sensor usage and their interaction with treatment. Every one day increase of sensor usage per week increased the effect of continuous glucose monitoring compared with self monitoring of blood glucose by 0.150% HbA1c (−0.194% to −0.106%) (−1.5, −1.9 to −1.1 mmol/mol). Every 1% increase in baseline HbA1c increased the effect of continuous glucose monitoring compared with self monitoring of blood glucose by 0.126% HbA1c (−2.57% to 0.0007%) (−1.3, -2.6 to 0.0 mmol/mol). Although age was included in the model it had a comparatively small effect: every one year increase in age increased the effect of continuous glucose monitoring compared with self monitoring of blood glucose by 0.002% HbA1c (0.02 mmol/mol). Thus, continuous glucose monitoring would be expected to reduce the HbA1c level by only an extra 0.05% (0.5 mmol/mol) in a 40 year old with diabetes compared with a 15 year old with diabetes.
Regression coefficients for best fitting model for one step individual patient data meta-analysis of determinants of final HbA1c (%). Values are medians of posterior distributions for means (95% credibility intervals)
No evidence for ecological bias was detected. Seven outlying HbA1c values from individual patients were identified, but the variable estimates remained virtually unchanged when these were simultaneously excluded from the model (box).
Model equations used to determine final HbA1c (%)
Continuous glucose monitoring
α(i)+1.491+(0.618×baseline HbA1c)−(0.150×sensor usage)−(0.005×age)
Self monitoring of blood glucose
α(i)+(0.744×baseline HbA1c)−(0.003×age)
Where α(i)=distinct baseline effects for each of (i=6) studies (variables not shown), and where pooled baseline value across trials is 2.026, derived from regression models in the six individual trials
Fig 3⇓ summarises the model estimated relation between the difference in effect of continuous glucose monitoring compared with self monitoring of blood glucose and baseline HbA1c values for different sensor usages for an example 40 year old with type 1 diabetes. Both self monitoring of blood glucose and continuous glucose monitoring were effective at reducing HbA1c levels over the trial periods, but continuous glucose monitoring produced a greater reduction in HbA1c than self monitoring of blood glucose, with best effect with frequent use and high baseline HbA1c values.

Fig 3 Model estimated difference in HbA1c using continuous glucose monitoring compared with self monitoring of blood glucose according to baseline HbA1c percentage and sensor usage in an example 40 year old participant with type 1 diabetes. An individual, for example, with an initial HbA1c value of 8% (64 mmol/mol) would be expected to have a reduction in HbA1c of 0.35% (4 mmol/mol) with use of a sensor for five days a week, increasing to 0.65% (7 mmol/mol) with usage for seven days a week
Mean overall change in area under the curve of hypoglycaemia
Most individual participants had low levels of hypoglycaemia at baseline: the median for area under the curve of hypoglycaemia was 0.17 (interquartile range 0.02 to 0.83). When a two step approach with a fixed effect meta-analysis (fig 4⇓) was used, the overall reduction in area under the curve of hypoglycaemia was −0.276 (−0.463 to −0.089). In these participants this corresponds to a 23% reduction in the median exposure to hypoglycaemia. When a two step approach with a random effects model was used, a similar overall reduction occurred in ln area under the curve of hypoglycaemia of −0.265 (−0.637 to 0.108) when patients used continuous glucose monitoring compared with self monitoring of blood glucose (fig 4). The I2 statistic (71.2%) indicated considerable heterogeneity between the six studies.

Fig 4 Individual patient data two step meta-analysis of difference in ln area under the curve of hypoglycaemia during continuous glucose monitoring compared with self monitoring of blood glucose
Independent determinants of area under the curve of hypoglycaemia
When the individual patient data from all studies in a one step approach were used, a best fit combined model of the determinants of the final area under the curve of hypoglycaemia during continuous glucose monitoring or self monitoring of blood glucose was developed, which included weak effects for baseline hypoglycaemia and duration of diabetes but not for age or frequency of sensor usage (table 3⇓). The model predicts that an increase in baseline area under the curve of hypoglycaemia over the range of 7.66 seen in the individual patient data increases the effect of continuous glucose monitoring compared with self monitoring of blood glucose by only 0.69. An increase in duration of diabetes by 10 years increases the effect of continuous glucose monitoring compared with self monitoring of blood glucose on area under the curve of hypoglycaemia by only 0.14. There was little evidence of ecological bias in the estimation of the regression coefficients.
Regression coefficients for best fitting model for one step individual patient data meta-analysis of determinants of final ln area under curve of hypoglycaemia. Values are medians of posterior distributions for means (95% credibility intervals)
Meta-analysis of aggregate data for severe hypoglycaemia extracted from published studies
The incidence rate ratio for severe hypoglycaemia in one trial7 was not calculated owing to zero events in both arms. Figure 5⇓ shows that the overall incidence rate of severe hypoglycaemia during continuous glucose monitoring was not significantly different from that during self monitoring of blood glucose: 1.40 (0.87 to 2.25, P=0.17). One trial4 had a substantially larger number of severe hypoglycaemic events during continuous glucose monitoring than during self monitoring of blood glucose (rate ratio 4.0), although the confidence interval was wide.

Fig 5 Aggregate data meta-analysis of severe hypoglycaemia incidence rate ratio on self monitoring of blood glucose compared with continuous glucose monitoring
Publication bias was assessed for all outcomes using the contour enhanced funnel plot. There was little evidence of its presence.
Discussion
Our meta-analysis of individual patient data from six randomised controlled trials showed that when management of type 1 diabetes included real time continuous glucose monitoring compared with self monitoring of blood glucose the overall reduction in HbA1c was 0.30%. We confirmed our hypothesis that the improvement in glycaemic control with continuous glucose monitoring was greatest in those with the highest baseline HbA1c and those who used the sensor most frequently. Our model using data from 892 patients estimated that a patient with type 1 diabetes using continuous glucose monitoring continuously can expect a reduction in HbA1c of about 0.90% (9 mmol/mol) compared with self monitoring of blood glucose when the baseline HbA1c level is 10% (86 mmol/mol); at a baseline HbA1c level of 7% (53 mmol/mol), the reduction with continuous glucose monitoring compared with self monitoring of blood glucose is about 0.56% (6 mmol/mol). Every one day fewer per week of sensor use reduces the effect by an HbA1c value of 0.15% (1.5 mmol/mol).
Interpretation
The mean difference in HbA1c level of 0.3% (3 mmol/mol) between continuous glucose monitoring and self monitoring of blood glucose is of arguable clinical importance when applied to the general population with type 1 diabetes, but the much larger difference in those with high baseline HbA1c values who use the sensors frequently is of undoubted clinical value. A reduction in HbA1c of, for example, 0.9% (9 mmol/mol) in those with an initially high level is associated with a substantial reduced risk of developing diabetic microvasular disease because the relation between absolute risk and HbA1c percentage is curvilinear, with a much larger risk reduction in the high HbA1c range.21
The Juvenile Diabetes Research Foundation primary study5 found that continuous glucose monitoring was only significantly more effective than self monitoring of blood glucose in those aged 25 or more, most likely because older patients used the sensor more frequently. We found that increasing age had a small effect on the HbA1c percentage during continuous glucose monitoring (an additional reduction of about 0.05% for 25 years increase in age), but that this was independent of sensor use; this is possibly because older patients are slightly more able than younger patients to use data from continuous glucose monitoring to adjust therapy and diet so as to maintain good glycaemic control.
We also found that the improvement in HbA1c level with continuous glucose monitoring was accompanied by a small reduction in exposure to hypoglycaemia, as assessed by continuous glucose monitoring measured area under the curve of blood glucose values <3.9 mmol/L (70 mg/dL). The only slight difference between fixed and random effects models for change in area under the curve of hypoglycaemia indicates a likely effect in at least some populations or contexts. There was only weak evidence that baseline hypoglycaemia and no evidence that the frequency of sensor use are determinants of the reduction in hypoglycaemia during continuous glucose monitoring compared with self monitoring of blood glucose. From a meta-analysis of summary data we also found that the mean incidence rate of severe hypoglycaemia for continuous glucose monitoring compared with self monitoring of blood glucose was not significantly different, although one trial had a higher rate on continuous glucose monitoring than self monitoring of blood glucose.4
The failure to find a greater effect of continuous glucose monitoring on area under the curve of reduction in hypoglycaemia with increased sensor use, in contrast to the greater effectiveness on reduction of HbA1c of frequent sensor use, is of interest. Possibly, reduction of hypoglycaemia in those using continuous glucose monitoring was obtained not by adjusting insulin dosages or taking extra carbohydrate based on continuous glucose monitoring data but by general behavioural changes such as increased general confidence to manage diabetes afforded by use of continuous glucose monitoring. This possibility underlines our belief that continuous glucose monitoring is a highly complex therapy that involves interacting behaviours, learning, and decisions. Effective sensor use is likely to be a combination of frequency of sensor wear, amount and quality of education and training, and ability of patients to use the data. Instructions for use of continuous glucose monitoring are not standardised nor agreed by healthcare professionals and varied between studies (in one trial patients were given no specific instructions for interpreting data).7
Limitations of the meta-analysis
We used the components described by Jadad et al14 for quality assessment of trials, and although the scale has been validated22 we noted and addressed its limitation of not considering concealment of allocation by an additional rating for this component. All scales are limited by the quality of reporting of the trial conduct and there are suggestions for alternative ratings.23 In the six studies selected for analysis, all were appropriately randomised and had adequate description of withdrawals. In all cases the percentage of withdrawals was less than 15% (range 1.6-12.9%) and no common or specific reason was reported. None of the trials were double blind because this is impossible with continuous glucose monitoring and self monitoring of blood glucose. Whether allocation concealment took place was not noted in any of the trials, so this remains a possible source of selection bias. Overall, however, we consider the trials to be of equal and good quality and suitable for inclusion in a meta-analysis.
A major limitation of our study concerns the analysis of hypoglycaemia. Caution is needed in interpreting the changes in hypoglycaemia in our meta-analysis because none of the trials were designed or powered to study hypoglycaemia, and the frequency of glycaemic values less than 3.9 mmol/L and of severe hypoglycaemia was low in all trials. We could not therefore assess the effects of continuous glucose monitoring in those with a high frequency of hypoglycaemia or in hypoglycaemia prone people with diabetes who are at risk, such as those who are unaware of their hypoglycaemia. This is a notable limitation because there is a consensus that a potential clinical indication for continuous glucose monitoring is reducing the risk of hypoglycaemia in such groups.24 A randomised controlled trial of continuous glucose monitoring compared with self monitoring of blood glucose to study changes in area under the curve of hypoglycaemia and the rate of severe hypoglycaemia in those people with type 1 diabetes at risk of frequent hypoglycaemia is therefore still needed.
A further limitation is that the change in area under the curve of hypoglycaemia was assessed in the trials and compared in the continuous glucose monitoring and self monitoring of blood glucose treatments by a short period of continuous glucose monitoring at the start and completion of the study (blinded in the case of the self monitoring of blood glucose arm), and this may have been too brief an assessment to represent accurately the extent of hypoglycaemia throughout the trial. More data points were missing for hypoglycaemia than for HbA1c and the substantial heterogeneity between studies (I2=71.2% for area under the curve of hypoglycaemia) may reflect the variable completeness of the dataset.
Implications for clinical practice
The uptake of continuous glucose monitoring in clinical practice has been limited to date because the evidence for its effectiveness has appeared only recently and has varied between studies. As a result, funding from national health services and insurance reimbursement has been restricted, although use and reimbursement are now increasing. An important result from our analysis is that the cost effectiveness of continuous glucose monitoring can now be calculated for different patient groups according to their baseline HbA1c percentage, sensor usage, and age. It is important to note that continuous glucose monitoring is not a replacement for but a supplement to self monitoring of blood glucose, since at the moment self monitoring of blood glucose must be used to calibrate the sensor, and such costs must be considered when estimating cost effectiveness. The most cost effective and most appropriate use of continuous glucose monitoring in everyday clinical practice is likely to be when targeted at those people with type 1 diabetes who have continued to have an increased HbA1c level (a variable that will be relatively fixed despite intensive insulin therapy—the combination of continuous subcutaneous insulin infusion or multiple daily injections, self monitoring of blood glucose, renewed education on diabetes, and frequent contact with healthcare professionals) and who are willing to use continuous glucose monitoring frequently (a variable which is potentially modifiable). Our analysis also indicates that further studies of continuous glucose monitoring in those with disabling hypoglycaemia during intensified insulin therapy are still needed.
What is already known on this topic
Continuous glucose monitoring has been available in clinical practice for over 10 years, but uptake is relatively poor and reimbursement restricted
Recent evidence from randomised controlled trials on the effectiveness of real time continuous glucose monitoring shows varied effects on mean HbA1c levels compared with self monitoring of blood glucose
What this study adds
Continuous glucose monitoring is associated with a significant reduction in HbA1c level, which is greatest in those with highest baseline HbA1c values and in those who use the sensor most often
Patients with a baseline HbA1c of 10.0% (86 mmol/mol), for example, can expect about a 0.9% HbA1c improvement with continuous glucose monitoring when used daily, and reduced exposure to hypoglycaemia
Cost effective and appropriate use of continuous glucose monitoring is likely to be in people with type 1 diabetes with a continued raised HbA1c percentage during intensified insulin therapy and who use the sensor frequently
Notes
Cite this as: BMJ 2011;343:d3805
Footnotes
We thank the trialists and trial sponsors for supplying individual patient data. Reman McDonagh provided invaluable help in data collection.
Contributors: JCP initiated and designed the study, collected the individual patient data from trialists and other sources, and extracted and reviewed summary data from published articles with SCF. SCF and AJS carried out the statistical analysis. All authors contributed to data interpretation and to the final version of the manuscript. JCP is the guarantor.
Funding: SCF was supported by the Engineering and Physical Sciences Research Council.
Competing interests: All authors have completed the ICMJE uniform disclosure form at www.icmje.org/coi_disclosure.pdf (available on request from the corresponding author) and declare that: no authors had support from companies for the submitted work; JCP has received speaker and advisory board honorariums from Medtronic, a manufacturer of continuous glucose monitoring devices that might have an interest in the submitted work in the previous 3 years; no other relationships or activities that could appear to have influenced the submitted work.
Ethical approval: Not required.
Data sharing: No additional data available.
This is an open-access article distributed under the terms of the Creative Commons Attribution Non-commercial License, which permits use, distribution, and reproduction in any medium, provided the original work is properly cited, the use is non commercial and is otherwise in compliance with the license. See: http://creativecommons.org/licenses/by-nc/2.0/ and http://creativecommons.org/licenses/by-nc/2.0/legalcode.