Utility of genetic and non-genetic risk factors in prediction of type 2 diabetes: Whitehall II prospective cohort study
BMJ 2010; 340 doi: https://doi.org/10.1136/bmj.b4838 (Published 15 January 2010) Cite this as: BMJ 2010;340:b4838
- Philippa J Talmud, professor of cardiovascular genetics1,
- Aroon D Hingorani, professor of genetic epidemiology23,
- Jackie A Cooper, biostatistician1,
- Michael G Marmot, MRC professor of epidemiology and public health2,
- Eric J Brunner, reader in epidemiology and public health2,
- Meena Kumari, senior research fellow in population health2,
- Mika Kivimäki, professor of social epidemiology2,
- Steve E Humphries, BHF professor of cardiovascular genetics1
- 1Centre of Cardiovascular Genetics, Department of Medicine, University College London, London WC1E 6JF
- 2Genetic Epidemiology Group, Department of Epidemiology and Public Health, University College London, London WC1E 6BT
- 3Centre for Clinical Pharmacology, University College London, London WC1E 6JF
- Correspondence to: P J Talmud p.talmud{at}ucl.ac.uk
- Accepted 17 September 2009
Abstract
Objectives To assess the performance of a panel of common single nucleotide polymorphisms (genotypes) associated with type 2 diabetes in distinguishing incident cases of future type 2 diabetes (discrimination), and to examine the effect of adding genetic information to previously validated non-genetic (phenotype based) models developed to estimate the absolute risk of type 2 diabetes.
Design Workplace based prospective cohort study with three 5 yearly medical screenings.
Participants 5535 initially healthy people (mean age 49 years; 33% women), of whom 302 developed new onset type 2 diabetes over 10 years.
Outcome measures Non-genetic variables included in two established risk models—the Cambridge type 2 diabetes risk score (age, sex, drug treatment, family history of type 2 diabetes, body mass index, smoking status) and the Framingham offspring study type 2 diabetes risk score (age, sex, parental history of type 2 diabetes, body mass index, high density lipoprotein cholesterol, triglycerides, fasting glucose)—and 20 single nucleotide polymorphisms associated with susceptibility to type 2 diabetes. Cases of incident type 2 diabetes were defined on the basis of a standard oral glucose tolerance test, self report of a doctor’s diagnosis, or the use of anti-diabetic drugs.
Results A genetic score based on the number of risk alleles carried (range 0-40; area under receiver operating characteristics curve 0.54, 95% confidence interval 0.50 to 0.58) and a genetic risk function in which carriage of risk alleles was weighted according to the summary odds ratios of their effect from meta-analyses of genetic studies (area under receiver operating characteristics curve 0.55, 0.51 to 0.59) did not effectively discriminate cases of diabetes. The Cambridge risk score (area under curve 0.72, 0.69 to 0.76) and the Framingham offspring risk score (area under curve 0.78, 0.75 to 0.82) led to better discrimination of cases than did genotype based tests. Adding genetic information to phenotype based risk models did not improve discrimination and provided only a small improvement in model calibration and a modest net reclassification improvement of about 5% when added to the Cambridge risk score but not when added to the Framingham offspring risk score.
Conclusion The phenotype based risk models provided greater discrimination for type 2 diabetes than did models based on 20 common independently inherited diabetes risk alleles. The addition of genotypes to phenotype based risk models produced only minimal improvement in accuracy of risk estimation assessed by recalibration and, at best, a minor net reclassification improvement. The major translational application of the currently known common, small effect genetic variants influencing susceptibility to type 2 diabetes is likely to come from the insight they provide on causes of disease and potential therapeutic targets.
Introduction
Around one in 10 middle aged Europeans develop type 2 diabetes over a 10 year period.1 This may rise with the threatened epidemic of type 2 diabetes, driven partly by the increase in obesity, which is projected to result in a prevalence of type 2 diabetes worldwide of 366 million by 2030 (www.who.int/diabetes/facts/world_figures/en/).2 This will place a considerable burden on healthcare systems, as type 2 diabetes is a common cause of renal failure and blindness and increases the risk of cardiovascular diseases and mortality.
Estimation of people’s absolute risk of coronary heart disease, based on the Framingham, PROCAM, and QRISK equations,3 4 5 has become established as a means of targeting preventive interventions to those at highest risk. Earlier risk functions for estimating the risk of type 2 diabetes required an oral glucose tolerance test, which is impractical for screening large numbers of people. Despite evidence that some interventions prevent or delay development of type 2 diabetes in people at high risk,6 the prediction of risk of new onset type 2 diabetes has not been part of routine clinical practice.
Two risk scores were published in 2007 and 2008. They were based on demographic, anthropometric, and biochemical measures but did not require information from an oral glucose tolerance test. The Cambridge type 2 diabetes risk score is a pragmatic algorithm incorporating the routinely assessed variables age, sex, drug treatment, family history of type 2 diabetes, body mass index, and smoking status.7 In validating this risk score in the EPIC-Norfolk study, Rahman et al reported that the model performed well in distinguishing cases of later type 2 diabetes (discrimination), with an area under the receiver operating characteristics curve of 0.75 (where 1 indicates perfect discrimination and 0.5 indicates no discrimination).7 The Framingham offspring type 2 diabetes risk score also makes use of routinely collected clinical data and biochemical measures including age, sex, parental history of type 2 diabetes, body mass index, high density lipoprotein cholesterol, triglycerides, and fasting glucose. This model also provided good discrimination of incident cases of diabetes, with an area under the receiver operating characteristics curve of 0.85.8 Notably, the addition of other non-routinely collected measures of glucose metabolism such as the homoeostasis model assessment, fasting insulin, or two hour oral glucose tolerance test did not improve the risk prediction.8
Both risk algorithms include information on family history of type 2 diabetes. However, family history reflects shared environment as well as genotype, and whereas biochemical and non-biochemical features associated with type 2 diabetes alter with age, genetic predisposition is determined at conception and fixed through life. Identifying genotypes that alter susceptibility to type 2 diabetes, and using them on their own or in combination with existing phenotype based risk algorithms, might therefore improve prediction of risk, particularly if genotypes identify differences in the activity of pathways unmeasured in non-genetic risk models.
Large case-control studies using whole genome arrays of single nucleotide polymorphisms (genome-wide association studies) have identified multiple common risk alleles for type 2 diabetes, many of which reside in or near genes not previously implicated in the pathogenesis of diabetes,9 10 11 12 in addition to confirming loci identified by previous candidate gene studies.13 14 Around 20 single nucleotide polymorphisms associated with type 2 diabetes have been identified, for which the findings from the discovery study have been independently replicated in additional datasets and the effect sizes evaluated precisely by meta-analysis (as detailed in web table A).15 16 17 18 For all loci identified to date, effect sizes have been modest, with odds ratios for risk of type 2 diabetes ranging from 1.37 for single nucleotide polymorphisms in the gene TCF7L2 to 1.09 for those in the gene ADAMTS9,18 raising the question of whether information on genotype would be useful for prediction of risk. Moreover, risk alleles have been discovered mainly by using case-control studies, which, although efficient for the discovery of disease associated single nucleotide polymorphisms, are suboptimal for evaluating their performance as predictors of risk. This is optimally assessed by genotyping the genetic markers in prospective studies of initially healthy people in whom cases of incident disease accrue over time. However, the study designs, the number of disease associated single nucleotide polymorphisms evaluated, the metrics used to evaluate predictive performance, and the methods used to compare the performance of genotype with non-genetic risk factors have been variable. Despite this, genetic tests for the prediction of type 2 diabetes have already become available in the commercial sector (for example, www.23andme.com and www.decodeme.com/).
In this study, we first compared the ability of two phenotype based risk algorithms, the Cambridge risk score and the Framingham offspring risk score,7 8 with genotype based risk models for the discrimination of incident cases of type 2 diabetes in the prospective Whitehall II study of civil servants in the United Kingdom. We then evaluated the effect of addition of genotypes to the two non-genetic risk algorithms on the ability to discriminate between people who developed type 2 diabetes and those who remained free of the disease. We further assessed the effect of adding genotype to the calibration of the risk models (which involves assessing the closeness of the observed event rate to the predicted risk in different risk categories) as well as reclassification (which assesses the extent to which addition of genetic information shifts people to categories of predicted risk that better reflect their eventual outcome).19
Methods
Study population
Between 1985 and 1988, all civil servants aged between 35 and 55 years in 20 departments in central London were invited to a medical examination at their workplace.20 21 With 73% participation, the cohort included 10 308 participants at entry to the study. At phase 3 in 1991-3, all participants known to be alive and in the country were invited to the screening clinic, which included an oral glucose tolerance test; 6058 men and 2758 women (85.5% of the original sample) attended. For this analysis, phase 3 (when an oral glucose tolerance test was done for the first time) serves as the baseline. Biochemical screening was repeated at phase 5 (1997-9) and phase 7 (2003-4). Additional questionnaire-only phases assessed diabetes status at phase 4 (1995-6) and phase 6 (2001). Of the baseline participants, 6156 participated in phase 7 screening, at which DNA was collected.
Clinical characteristics
We measured age, sex, body mass index, waist circumference, blood pressure, lipids, C reactive protein, fibrinogen, glucose, smoking, and coronary heart disease and diabetes status at baseline. Weight was measured in underwear to the nearest 0.1 kg on Soehnle electronic scales. We measured height in bare feet to the nearest 1 mm by using a stadiometer with the participant standing erect with head in the Frankfort plane. We calculated body mass index as weight (kilograms)/height (metres) squared. We measured waist circumference, taken as the smallest circumference at or below the costal margin, with participants unclothed in the standing position by using a fibreglass tape measure at 600 g tension. We measured systolic blood pressure and diastolic blood pressure twice in the sitting position after five minutes’ rest with the Hawksley random zero sphygmomanometer. We took the average of the two readings to be the measured blood pressure. We took venous blood in the fasting state or at least five hours after a light, fat free breakfast, before a two hour 75 g oral glucose tolerance test was done. Serum for lipid analyses was refrigerated at −4°C and assayed within 72 hours. We used a Cobas Fara centrifugal analyser (Roche Diagnostics System, Nutley, NJ) to measure cholesterol and triglyceride concentrations. We measured high density lipoprotein cholesterol by precipitating non-high density lipoprotein cholesterol with dextran sulfate-magnesium chloride with the use of a centrifuge and measuring cholesterol in the supernatant fluid. We used the Friedewald formula to calculate low density lipoprotein cholesterol concentration. We measured C reactive protein in serum stored at −70°C with a high sensitivity immunonephelometric assay in a BN ProSpec nephelometer (Dade Behring, Milton Keynes). We measured fibrinogen by an automated Clauss assay in an MDA-180 coagulator (Organon Teknika, Cambridge), using the manufacturer’s reagents and the international fibrinogen standard. We measured blood glucose by the glucose oxidase method on a YSI Model 23A glucose analyser,22 23 and serum insulin with an in-house human insulin radioimmunoassay.24 We defined prevalent coronary heart disease as meeting MONICA criteria,25 giving positive responses to questions about chest pain,26 physician’s diagnosis, evidence from medical records, or positive electrocardiographic findings.
Diabetes, HbA1c, and homoeostasis model assessment
We determined diabetes status on the basis of a 75 g oral glucose tolerance test (phases 3, 5, and 7), use of anti-diabetic drugs, or self report of a doctor’s diagnosis (phases 3 to 7). We defined diabetes by a two hour glucose of at least 11.1 mmol/l or fasting glucose of at least 7 mmol/l.27 Glycated haemoglobin (HbA1c) was measured at phase 7 in EDTA whole blood on a calibrated HPLC system with automated haemolysis before injection. HbA1 is resolved as a separate peak, which does not interfere with quantification of HbA1c.28 We calculated homoeostasis model assessment as (fasting glucose (mmol/l) × fasting insulin (mU/l)/22.5).29 Non-fasting participants (fasting less than five hours) were assigned a missing value (n=435, 9.1%).
Genotyping
We extracted DNA from blood samples by using magnetic bead technology (Medical Solutions, Nottingham). Medical Solutions used SNPLex (Applied Biosciences) to determine the following single nucleotide polymorphisms, chosen because their association with diabetes risk has been replicated and the effect size has been estimated with precision from large scale meta-analysis (web table A): ADAMTS9 rs4607103, CALPN10 rs3792267, CDC123 (CAMK1D) rs12779790, CDKN2B rs10811661, FTO rs1421085 (which is complete LD with rs993050630), HHEX rs1111875, HNF1A (TCF2) rs1800574, IGF2BP2 rs440296, JAZF1 rs864745, KCNJ11 rs521, NOTCH2 rs10923931, PPARG rs1801282, SLC30A8 rs13266634, TCF2(HNF1B) rs4430796, TCF7L2 rs12255372, THADA rs7578597, and TSPAN8 (LGR57) rs7961581. Single nucleotide polymorphisms in BCL11A rs10490072, CDKAL1 rs17036101, TCF7L2 rs7901695, and VEGFA rs9472138 were genotyped by using the 50K IBC CVD chip (web table B).31 All single nucleotide polymorphisms were in Hardy-Weinberg equilibrium (χ2, P>0.05).
Statistical analysis
We used two sample t tests to compare mean baseline values of continuous variables in people who developed diabetes and those who did not. Where appropriate, we log transformed variables and present geometric means and approximate standard deviations. We used the χ2 test to compare categorical variables. We assessed the association of each genotype with risk of diabetes by logistic regression analysis and summarised the data by odds ratios and 95% confidence intervals. We used published regression coefficients to calculate the Cambridge type 2 diabetes risk score and Framingham offspring study type 2 diabetes risk score for each participant.7 8 In addition, we calculated two genetic scores. In the first, we assigned each person a score based simply on the number of risk alleles carried. Thus for CDKAL1, CDC123/CAMK1D, FTO, HNF1A, IGFBP2, KCNJ11, NOTCH2, TCF2, TCF7L2, TSPAN8/LRG5, and VEGFA, we coded genotypes “0” for common allele homozygotes,11 “1” for heterozygotes, and “2” for rare allele homozygotes,22 and for ADAMTS9, BCL11A, CALPN10, CDKN2A/2B, HHEX, JAZF1, PPARG, SLC30A8, and THADA, coding was “2” for common allele homozygotes and “0” for rare allele homozygotes,11 as the rare allele is reported to be protective (see web table B). In the second score, we calculated a genetic risk function by using weights derived from the risk coefficient for each gene based on odds ratios reported in previous meta-analyses (web table A).15 16 18 32 Risk estimates for each allele were available for 18 genes, and we multiplied these coefficients by 0, 1, or 2 according to the number of risk alleles carried by each person. Where effect estimates were reported for carriage of either one or two copies of each risk allele as a single group (CALPN10 and HNF1A), we multiplied risk coefficients by a score of 0 or 1. We assumed genetic and clinical variables to be independent and added the weighted genetic score to each of the risk algorithms to provide a combined phenotypic and genetic score.
We assessed discrimination with the detection rate, which is equivalent to sensitivity and defined as the proportion of all cases detected for a pre-specified false positive rate, as well as the area under the receiver operating characteristics curve. We assessed the calibration of the Cambridge risk score and Framingham offspring risk score in the estimation of the absolute risk of type 2 diabetes by comparing the difference between observed and expected event rates in different categories of risk with the Hosmer-Lemeshow test, with Akaike’s information criterion and the likelihood ratio test as global measures of model fit.33 We used the net reclassification improvement measure to assess the extent to which adding the genetic variables reassigned people to risk categories that better reflected their final outcome.34
Results
Web table C shows the baseline characteristics of the study participants. We excluded 103 people with prevalent type 2 diabetes at baseline from subsequent analysis. Of the 5135 participants followed for a median of 11.7 years to phase 7, with complete phenotype and genotype measures, 302 had developed type 2 diabetes by phase 7.
Discrimination using phenotype based risk scores
The odds ratio for developing diabetes was 8.4 (95% confidence interval 5.1 to 13.9) for people in the top fifth of the Cambridge risk score distribution compared with those in the bottom fifth, and the area under the receiver operating characteristics curve was 0.72 (95% confidence interval 0.69 to 0.76) at phase 7 (table 1⇓). The odds ratio for type 2 diabetes in participants in the top fifth of the Framingham offspring risk score distribution compared with those in the bottom fifth was 18.2 (9.8 to 33.8), with a significantly greater area under the receiver operating characteristics curve of 0.78 (0.75 to 0.82) (P=0.01) (table 1⇓ and fig 1⇓). Detection rates (sensitivity) for a 5% false positive rate were 19.7 (95% confidence interval 14.1 to 25.3) for the Cambridge risk score (cut-off point 0.34) and 30.6 (24.1 to 37.1) for the Framingham offspring risk score (cut-off point 0.08). The respective detection rates for a 10% false positive rate were 34.2 (27.5 to 40.9; cut-off point 0.26) and 43.0 (36.0 to 50.0; cut-off point 0.05) (table 1⇓).
Odds ratios and area under receiver operating characteristics curve for Cambridge type 2 diabetes risk score, Framingham offspring type 2 diabetes risk score, and genetic risk scores alone and in combination in Whitehall II study

Fig 1 Receiver operating characteristics curves for gene count score alone (area under curve 0.54, 95% CI 0.50 to 0.58), Framingham offspring risk score (area under curve 0.78, 0.75 to 0.82), and gene count score incorporated into Framingham offspring risk score (area under curve 0.78, 0.75 to 0.81)
Discrimination using genotype based risk scores
Web table B shows details of the 20 single nucleotide polymorphisms typed, together with risk estimates for type 2 diabetes from published meta-analyses (web table A). All genotypes were in Hardy-Weinberg equilibrium. In line with previous reports, FTO rs1421085 was associated with body mass index (P<0.001).30 CDC123/CAMK10 rs10811661 (P=0.001), KCNJ11 rs5219 (P<0.01), and TCF7L2 rs7901695 (P<0.002) were associated with two hour glucose after an oral glucose tolerance test. CALPN10 rs3792267 was associated with significant differences in concentrations of total cholesterol and low density lipoprotein cholesterol (P=0.01). We found no other associations between genotypes and phenotypes included in either of the non-genetic risk models at phase 3 or phase 7 (web tables D-J). The point estimates of the effect sizes were consistent with previous meta-analyses involving many thousands of cases of type 2 diabetes (web table A). However, as would be expected in a prospective study with fewer cases of diabetes and in agreement with the previous report from a prospective study of similar size,35 most associations were not significant at P<0.05 in this dataset.
Figure 2⇓ shows the distribution of the gene count score in people who developed type 2 diabetes and those who remained free of diabetes; the web figure shows the equivalent data for genetic risk function. Fourteen per cent of people with type 2 diabetes were in the top fifth of the gene count score compared with 13.9% of those without type 2 diabetes (web table K). The odds ratio for type 2 diabetes for participants in the top fifth of the score was 1.6 (0.9 to 2.5) compared with those in the bottom fifth. Twenty-five per cent of people with type 2 diabetes were in the top fifth of the genetic risk function, compared with 20% of those without diabetes, giving an odds ratio for type 2 diabetes of 2.3 (1.5 to 3.8) (web table K). The mean gene count score was 21.1 (SD 2.6) in people with type 2 diabetes and 20.5 (2.7) in those without type 2 diabetes (web table K). The simple gene count and the genetic risk function gave very similar discrimination, with areas under the receiver operating characteristics curve of 0.54 (0.50 to 0.58) (fig 1⇑) and 0.55 (0.51 to 0.59) (table 1⇑). Table 1⇑ shows the detection rates at 5% and 10% false positive rates.
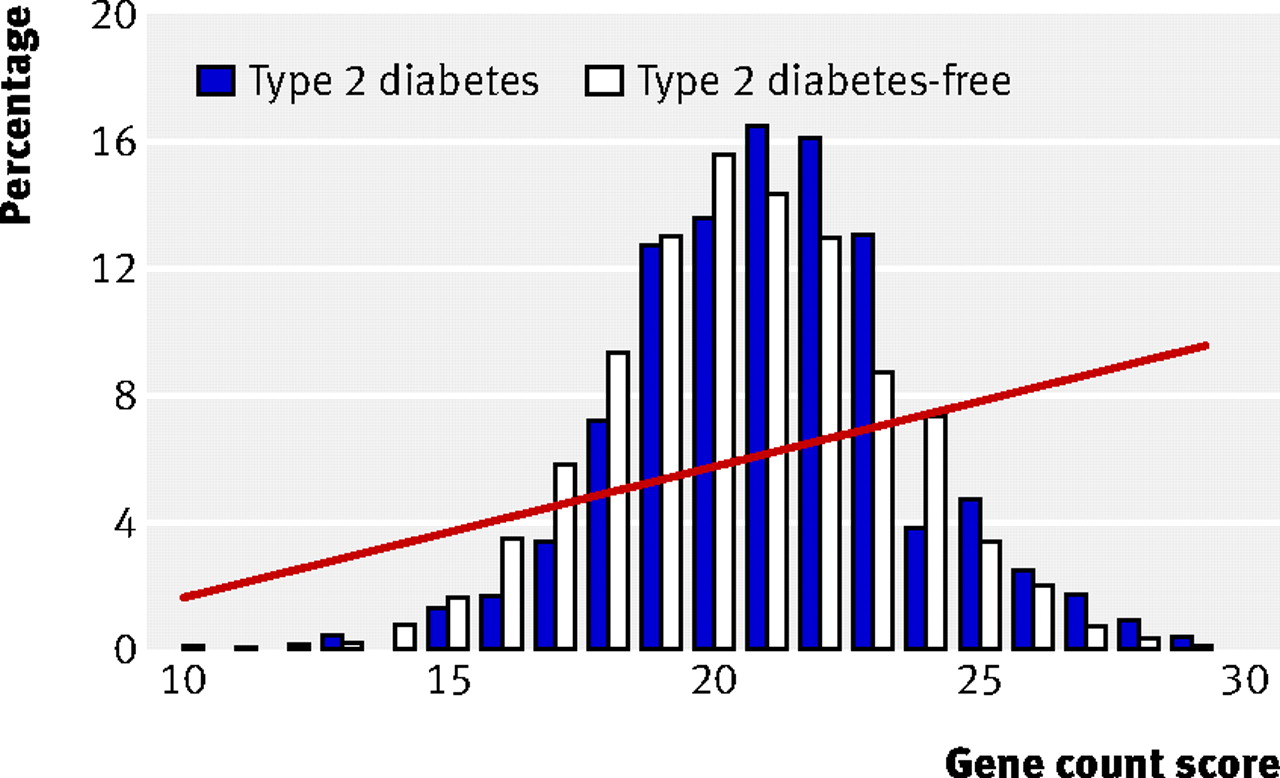
Fig 2 Percentage of participants in each gene count score category among those who developed type 2 diabetes and those who remained free from diabetes. Risk of developing diabetes according to gene count shown as fitted line from regression analysis
Effect of adding genetic information to discrimination and calibration of risk models
The addition of genetic information to either of the phenotype based risk models (using the simple gene count or the genetic risk function) did not improve discrimination (table 1⇑). Because part of the information included in the family history component of a risk score could reflect carriage of common genotypes, this may have undermined the incremental value of genetic information for predicting risk. However, the variants we studied explain only a small proportion of the familial aggregation of diabetes, and a formal analysis of the effect of inclusion or exclusion of the family history variable had almost no effect on the area under the receiver operating characteristics curve (data available on request).36
The addition of genetic information did little to alter the accuracy of the phenotype based models when assessed with the Hosmer-Lemeshow test of calibration (table 2⇓). Although the improvement in fit of the model was statistically significant when the Cambridge risk score was supplemented by the genetic risk function, the magnitude of the change was very small and unlikely to have any worthwhile clinical impact.
Effect of adding genetic information to global model fit and calibration of risk models to examine indices of model fit
We generated four 10 year risk categories for type 2 diabetes for each of the two phenotype based risk models (≤5%, 5-9.9%, 10-14.9%, and ≥15%) and then compared the observed and predicted event rates in each category of risk to assess if the addition of genetic information improved calibration (that is, the closeness of the observed event rate to the predicted risk) (table 3⇓). The phenotype based risk models accurately estimated the rates of diabetes in each of the four categories of predicted risk.
Prevalence and percentage of incident cases of type 2 diabetes in categories of predicted risk calculated by using phenotype based risk models alone, and same models with addition of genetic data
Reclassification
We used the net reclassification index to assess the extent to which adding genotype data to the phenotype based risk models resulted in the movement of participants into risk categories that more accurately reflected their eventual outcome. In these analyses, we used the same four risk categories (≤5%, 5-9.9%, 10-14.9%, and ≥15%) and did the analyses separately for people diagnosed as having type 2 diabetes on follow-up and those who remained healthy. Among the eventual cases, a shift to a higher risk category on the addition of genetic information is classed as a correct reclassification and a downward shift as an incorrect reclassification. The opposite is the case for people who remained healthy. The addition of the simple gene count to the Cambridge risk score resulted in a net reclassification improvement of −1.1% (95% confidence interval −6.0% to 3.8%) (table 4⇓), and the addition of information from the genetic risk function produced a net reclassification improvement of 4.6% (−2.0% to 11.3%) (P=0.17) (web table L). Neither the simple gene count score (net reclassification improvement 0.2%, −5.1 to 4.7) (table 5⇓) nor the genetic risk function (net reclassification improvement −3.2%, −9.9 to 3.5) (web table M) resulted in a net reclassification improvement when added to the Framingham offspring risk score.
Net reclassification improvement based on addition of gene count score to Cambridge risk score
Net reclassification improvement based on addition of gene count score to Framingham offspring risk score
Discussion
In a British cohort (the Whitehall II study), a panel of 20 genotypes associated with type 2 diabetes performed less well than the Cambridge and Framingham offspring type 2 diabetes risk scores in discriminating incident cases of type 2 diabetes. Adding the genetic panel to the phenotype based risk models did not improve discrimination and produced only minimal improvement in accuracy of risk estimation assessed by recalibration and, at best, a minor net reclassification improvement.
Over the past five years, the pace of identification of genetic loci underlying susceptibility to common diseases has increased rapidly, leading to interest in how this information might best be used to improve personal and public health. One potential application is the use of genetic information to help predict susceptibility to disease in initially healthy people, so as to focus preventive interventions on those at the highest risk of future disease. This targeted approach to prevention is exemplified by the established use of risk equations based on non-genetic variables to estimate risk of coronary heart disease and guide blood pressure lowering and cholesterol lowering treatment.3 4 This approach to the prevention of vascular disease, for which diabetes is a major risk factor, will become more systematic in the next two years, through the Department of Health’s vascular health check scheme (www.dh.gov.uk/en/Publicationsandstatistics/Publications/PublicationsPolicyAndGuidance/DH_083822).
Preventive interventions also exist for type 2 diabetes, which motivated the recent evaluation of risk scores (including those studied here) for the prediction of type 2 diabetes. The Cambridge risk score and the Framingham offspring risk score are based on a combination of demographic, family history, anthropometric, and biochemical data, but neither includes genetic information.7 8 Although these phenotype based risk models seem to perform well, an important question is whether typing a panel of validated genetic risk factors might improve their ability to predict type 2 diabetes. Some studies in this area have used case-control datasets.37 38 39 Although efficient for gene discovery, these are a suboptimal design for evaluating the predictive performance of a marker, as risk information is available only in relative terms and the range of metrics that can be derived to assess predictive performance is more limited than for prospective studies with incident cases of disease. Those prospective studies that have previously evaluated the performance of genetic markers have been set outside the UK, typed fewer type 2 diabetes risk alleles, or reported only some of a range of metrics available to evaluate the performance of a predictive test (table 6⇓).35 40 41 42 In a prospective study set in the UK, we therefore tested the performance of a panel of 20 common genes associated with type 2 diabetes, each of which confers a small to moderate increase in the risk of type 2 diabetes, and compared prediction based on genetic information alone, phenotypic information alone, and both, by using a range of metrics to assess predictive performance.
Comparison of published studies that have used genetic information with or without non-genetic risk factors to discriminate between people with and without type 2 diabetes, in case-control, cross sectional, or prospective settings
We found that risk functions based on routinely measured clinical variables better discriminated incident type 2 diabetes cases than did a panel of 20 diabetes associated single nucleotide polymorphisms. The inclusion of genetic information in the risk models did not improve the discrimination of cases of type 2 diabetes, and nor did it provide clinically important improvement in the accuracy of these models when assessed by calibration. The addition of genetic data to phenotype based risk models also provided minimal net reclassification improvement. The addition of genetic information resulted in the reassortment of people into different risk categories, but not all the shifts were helpful. Although some eventual cases were upgraded to higher risk categories, almost as many had their risk downgraded, and the opposite was true for many of those who remained healthy.
Our findings are consistent with the nine previous published reports of 10 study populations (table 6⇑),35 37 38 40 41 42 43 44 even though the number and range of genotypes and the phenotype based risk models used for prediction varied across studies (see Forrest plots at www.ucl.ac.uk/genetic-epidemiology/WebMaterial). All models included age, body mass index, and sex, and much of the predictive information in any phenotype based model is likely to be encompassed in these terms.
The relations shown in figure 2⇑ and the web figure illustrate one reason for the poor predictive performance of a panel of single nucleotide polymorphisms associated with common diseases. Although people carrying multiple risk alleles are at more extreme risk of type 2 diabetes than those carrying fewer copies, they represent only a small proportion of the population, because the inheritance of each risk allele is an independent event—the probability of inheriting multiple risk alleles is a function of the frequency of each allele in the population. For example, the probability of inheriting 10 independent risk alleles with frequencies around 0.3 is 0.310 (about 6×10⁻⁶). People with an intermediate number of risk alleles would therefore be expected to account for the major portion of cases of type 2 diabetes, because of the large number of people at intermediate risk in the population. This explains the substantial overlap of the distribution of risk alleles among people who developed diabetes and those who remained disease-free, which makes it difficult to set a cut-off point of a gene count (or genetic risk function) that reliably discriminates later cases of type 2 diabetes. Although genetic tests for type 2 diabetes, based on a subset of the alleles studied here, can already be purchased in the commercial sector, our findings suggest that much more rigorous evaluation of their use as a health technology is needed before such tests should be adopted by healthcare organisations.
As a technology, however, genotype based tests have several inherent advantages over non-genetic tests. Genotype based assays are cheap, have high fidelity, and can be multiplexed, in contrast to multiple phenotypic risk factors and biomarkers, many of which require different methods for their measurement, and which are more affected by biological variability and measurement error than is genotyping. Moreover, because genotype is invariant it offers the prospect of risk assessment from much earlier in life than is possible with phenotype based tests. In the case of cardiovascular risk factors, evidence shows that greater benefits accrue from earlier intervention among people at higher risk (for example, in the form of smoking cessation or cholesterol lowering).45 46 The findings of our study should thus not lead to the premature dismissal of genotype based risk prediction as a health technology. Rather, increased efforts should be made to understand the strengths and limitations of such tests as well as their optimal place in health care, a conclusion highlighted in the recent House of Lords Science and Technology Committee’s report on genomic medicine (www.publications.parliament.uk/pa/ld200809/ldselect/ldsctech/107/107i.pdf).
Limitations of study
Some limitations of our study should be noted. Although prospective, the Whitehall II study is workplace based and therefore not necessarily representative of the general population. However, the excellent performance in Whitehall II of the non-genetic risk functions for type 2 diabetes, both of which were developed and validated in general populations, suggests that this is unlikely to bias our conclusions substantially. Moreover, our findings are consistent with those of prospective studies set in representative general populations. Our findings are also not generalisable to people of non-European ancestry, who we excluded from this analysis. Although DNA was collected some time after baseline, which could have introduced a survivor bias, we think that this is unlikely to have affected our results given the modest effect of the alleles we studied on risk of diabetes and the long natural history of the development of the life threatening complications of diabetes.
The two risk tools studied, based on non-genetic markers, performed better than genotype based tests despite the fact that the models, which were developed in different datasets, were not specifically recalibrated for the Whitehall II population. The common diabetes associated single nucleotide polymorphisms we studied might have greater incremental value in the prediction of type 2 diabetes when evaluated against some of the other validated risk models. However, we chose the Framingham and Cambridge risk scores because they are contemporary (which could be important, given the recent increase in the incidence and prevalence of type 2 diabetes), were developed in populations with a similar profile to the Whitehall II participants, and were based on studies set in the United States and the UK, where many of the genetic studies were done. Moreover, both include variables that are routinely measured in clinical practice. We did not evaluate QDRisk, which is based on routinely collected primary care data (including deprivation scores, ethnicity, and current drug treatment for hypertension or cardiovascular disease and corticosteroid use), which was reported during the preparation of this manuscript.47
Because part of the information included in the family history component of a risk score will reflect common genotypes, this may have undermined the incremental value of genetic information for risk prediction. However, the variants we studied explain only a small proportion of the familial aggregation of diabetes.36 Whether genotypes have greater predictive utility in particular categories of patient (such as among leaner people or those of a particular ancestry) could be assessed by pooling participant level data from a large number of prospective studies with the relevant information to ensure adequate power. Our current analysis is limited to the 20 common risk alleles for type 2 diabetes identified by large association or genome-wide studies. However, sequence variants of intermediate frequency but larger effect size are likely to be uncovered by future research, so our interpretation on the predictive utility of genotype should be regarded as interim. Moreover, as the actual causal variants at each gene/region remain for the most part uncertain, the predictive utility of genetic markers may also have been underestimated.
Our conclusions about the performance of genetic testing for type 2 diabetes are confined to the use of single common alleles at each locus. Other common risk alleles are likely to exist at the same genetic loci (including the causal variants), which could provide additional information relevant to prediction. Our conclusions are also not transferrable to other common diseases. For example, genetic variants underlying the susceptibility to age related macular degeneration have been identified, at least one of which is both common and large in its effect on risk.48 We previously examined the predictive utility of a common single nucleotide polymorphism associated with the risk of coronary heart disease at the 9p23.1 chromosomal locus (rs10757274) when added to a risk function that included variables incorporated in the Framingham coronary heart disease risk equation.49 Although this genotype added minimally to the ability of the Framingham risk score to discriminate future events, improving the area under the receiver operating characteristics curve by only 3%, it did significantly improve reclassification of risk of coronary heart disease, albeit modestly. Moreover, for some disorders, including age related macular degeneration, few if any non-genetic biomarkers or risk factors exist that can be used to estimate risk of future disease.
Conclusions
Phenotype based risk models (the Framingham offspring and Cambridge risk scores) provided greater discrimination for type 2 diabetes than did models based on 20 common independently inherited alleles associated with risk of type 2 diabetes. The addition of 20 common genotypes associated with modest risk to phenotype based risk models produced only minimal improvement in the accuracy of risk estimation assessed by recalibration and at best a minor net reclassification improvement. The major translational application of the currently known common, small effect genetic variants influencing susceptibility to type 2 diabetes is likely to come from the insight they provide on causes of disease and potential therapeutic targets.
What is already known on this topic
Several routinely used anthropometric and biological measures are included in the validated Cambridge and the Framingham offspring type 2 diabetes risk models
Common single nucleotide polymorphisms associated with susceptibility to type 2 diabetes have been identified from whole genome and candidate gene association studies
The extent to which a comprehensive panel of genotypes will help in predicting incident diabetes in the UK is not known
What this study adds
A panel of 20 type 2 diabetes associated genotypes performed less well than the Cambridge and Framingham offspring type 2 diabetes risk scores in discriminating incident cases of type 2 diabetes
Including the genetic panel did not improve discrimination, calibration, or reclassification when added to the Cambridge or Framingham risk models
The major translational application of currently known common type 2 diabetes associated genotypes is likely to arise from the insight they provide on causes of disease and therapeutic targets
Notes
Cite this as: BMJ 2010;340:b4838
Footnotes
We thank all participating civil service departments and their welfare, personnel, and establishment officers; the Occupational Health and Safety Agency; the Council of Civil Service Unions; all participating civil servants in the Whitehall II study; and all members of the Whitehall II study team.
Contributors: PJT, ADH, and SEH conceived the study, and PJT wrote the first draft of the manuscript, with major input from ADH and SEH. JAC did the statistical analysis. M Kumari, MGM, EJB, and M Kivimäki critically assessed the manuscript. EJB contributed to the comparison of previously published studies. All the authors accept full responsibility for the conduct of the study, had access to the data, and controlled the decision to publish. All the authors are guarantors.
Funding: The study was funded by the Medical Research Council (G8802774); British Heart Foundation (RG/02/005); Health and Safety Executive; Department of Health; National Institute on Aging (AG13196), US, NIH; Agency for Health Care Policy Research (HS06516); and John D and Catherine T MacArthur Foundation Research Networks on Successful Midlife Development and Socio-economic Status and Health. SEH is a British Heart Foundation research professor, and ADH has a British Heart Foundation senior research fellowship (FS05/125). PJT, JAC, and SEH are supported by a British Heart Foundation research grant (RG/05/014). Genotyping in the Whitehall II study was supported in part by a British Heart Foundation project grant (PG/07/133). M Kivimäki is supported by the Academy of Finland and a BUPA Foundation specialist research grant. MGM is supported by a Medical Research Council research professorship. EJB is supported by a Stroke Association grant (TSA 2008/05). The funders had no role in the design and conduct of the study; the collection, management, analysis, and interpretation of data; the writing of the manuscript; or the decision to submit the manuscript for publication.
Competing interests: ADH is on the editorial board of Drug and Therapeutics Bulletin, a BMJ Group publication, has provided non-remunerated advice to GlaxoSmithKline and London Genetics, and has received honorariums for speaking at educational meetings with sponsorship from the pharmaceutical industry, which have been donated in whole or large part to charity.
Ethical approval: The study was approved by the UCL/UCLH ethics committee, and all participants gave written informed consent.
Data sharing: Whitehall II data, protocols, and other metadata are available to the whole of the scientific community. Please refer to the Whitehall II data sharing policy on www.ucl.ac.uk/whitehallII/data_sharing/index.htm.
This is an open-access article distributed under the terms of the Creative Commons Attribution Non-commercial License, which permits use, distribution, and reproduction in any medium, provided the original work is properly cited, the use is non commercial and is otherwise in compliance with the license. See: http://creativecommons.org/licenses/by-nc/2.0/ and http://creativecommons.org/licenses/by-nc/2.0/legalcode.