Cumulative risk adjusted mortality chart for detecting changes in death rate: observational study of heart surgery
BMJ 1998; 316 doi: https://doi.org/10.1136/bmj.316.7146.1697 (Published 06 June 1998) Cite this as: BMJ 1998;316:1697
- J Poloniecki, lecturer in statistics (j.poloniecki{at}sghms.ac.uk)a,
- O Valencia, research fellowb,
- P Littlejohns, director, Health Care Evaluation Unita
- aPublic Health Sciences, St George's Hospital Medical School, London SW17 0RE,
- bRegional Cardiothoracic Unit, St George's Hospital, London SW17 0RE
- Correspondence to: Dr Poloniecki
- Accepted 13 January 1998
Abstract
Objective: To detect changes in mortality after surgery, with allowance being made for variations in case mix.
Design: Observational study of postoperative mortality from January 1992 to August 1995.
Setting: Regional cardiothoracic unit.
Subjects: 3983 patients aged 16 and over who had open heart operations.
Main outcome measures: Preoperative risk factors and postoperative mortality in hospital within 30 days were recorded for all surgical heart operations. Mortality was adjusted for case mix using a preoperative estimate of risk based on additive Parsonnet factors. The number of operations required for statistical power to detect a doubling of mortality was examined, and control limits at a nominal significance level of P=0.01 for detection of an adverse trend were determined.
Results: Total mortality of 7.0% was 26% below the Parsonnet predictor (P<0.0001). There was a highly significant variation in annual case mix (Parsonnet scores 8.7-10.6, P<0.0001). There was no significant variation in mortality after adjustment for case mix (odds ratio 1-1.5, P=0.18) with monitoring by calendar year. With continuous monitoring, however, nominal 99% control limits based on 16 expected deaths were crossed on two occasions.
Conclusions: Hospital league tables for mortality from heart surgery will be of limited value because year to year differences in death rate can be large (odds ratio 1.5) even when the underlying risk or case mix does not change. Statistical quality control of a single series with adjustment for case mix is the only way to take into account recent performance when informing a patient of the risk of surgery at a particular hospital. If there is an increase in the number of deaths the chances of the next patient surviving surgery can be calculated from the last 16 deaths.
Key messages
Changes in the patient population affect a hospital's annual death rate
Year to year differences in death rate can be large even when there is no change in the underlying risk or case mix
It takes surprisingly many operations before an increase in death rate can be distinguished from random fluctuation
A formal inquiry should take place in a hospital if the death rate rises above control limits
The chances of the next patient surviving surgery should be calculated using the surgeon's most recent results
Introduction
If a comparison of hospitals or surgeons is to be useful it must be based on a statistic that is relevant to prospective patients. For heart surgery a key question is: “What are the chances of the patient surviving the operation if it is performed today at this hospital?” We monitored deaths after surgery using case specific estimates of survival, which were then adjusted for recent performance. The method could be applied to any process where failures can be identified.
The cumulative number of deaths after a surgical procedure can be plotted against the total number of operations and the cumulative sum (CUSUM) statistical technique applied to provide an alarm if the mortality exceeds an acceptable level. 1 2 Such a method, according to de Leval et al, would have enabled earlier detection and correction of an unacceptable number of deaths in a series of neonatal arterial switch operations. 1 2 The method is not, however, suitable for prospective monitoring when all types of patient and operation are combined into a single series and there is no national standard for acceptable performance.
Few published series have explored the statistical variation in outcomes, which may explain the difficulty and delay in recognising poorer results. 3 4 Adjustment for type of procedure and the patient's condition (collectively referred to as case mix) is necessary for monitoring deaths associated with general surgery. 5 6 We used a published set of weights for established risk factors in adult heart surgery789 to look for changes in the death rate over time.
Subjects and methods
All heart operations performed at St George's Hospital in London between January 1992 and August 1995 were analysed. Mortality in hospital within 30 days was recorded and checked for completeness against the mortuary records of the hospital. There is no established procedure by which an external auditor could check if a death occurring outside hospital but within 30 days had been missed, and so deaths outside hospital were not included. Table 1 lists the items describing the patient's preoperative condition and the proposed procedure. The items and additive weights used to derive an estimated percentage probability of death were as published,7 with the following exceptions. When the published weights (percentage mortality) are a range of values, we used fixed weights: 5 for congenital heart disease and 30 for preoperative catastrophic state — for example, rupture of the aorta. The category other rare circumstances was used only for tricuspid valve surgery, which was given a weight of 3. Heart transplant operations were not in the series presented by Parsonnet et al,7 and a weight of 15 was used on the basis of survival rates in the United Kingdom.
Parsonnet risk factors7*
Case mix for a calendar year was assessed as the percentage mortality predicted on the basis of the factors in table 1. Variations in case mix were analysed using analysis of variance after transformation to the natural logarithm (ln) of the odds of predicted mortality to give more uniform variance. Actual mortality was compared with predicted by the χ2test. Multiple linear logistic regression was used to test for annual effects, and the logit — that is, ln of the odds — of the Parsonnet predictor was included as a linear term. Because the ln of 0 is not possible, a predicted mortality of 0.5% was used instead. To test the combined significance of all four years, the χ2 test with three degrees of freedom was applied to the difference between models in twice the log of the likelihood.
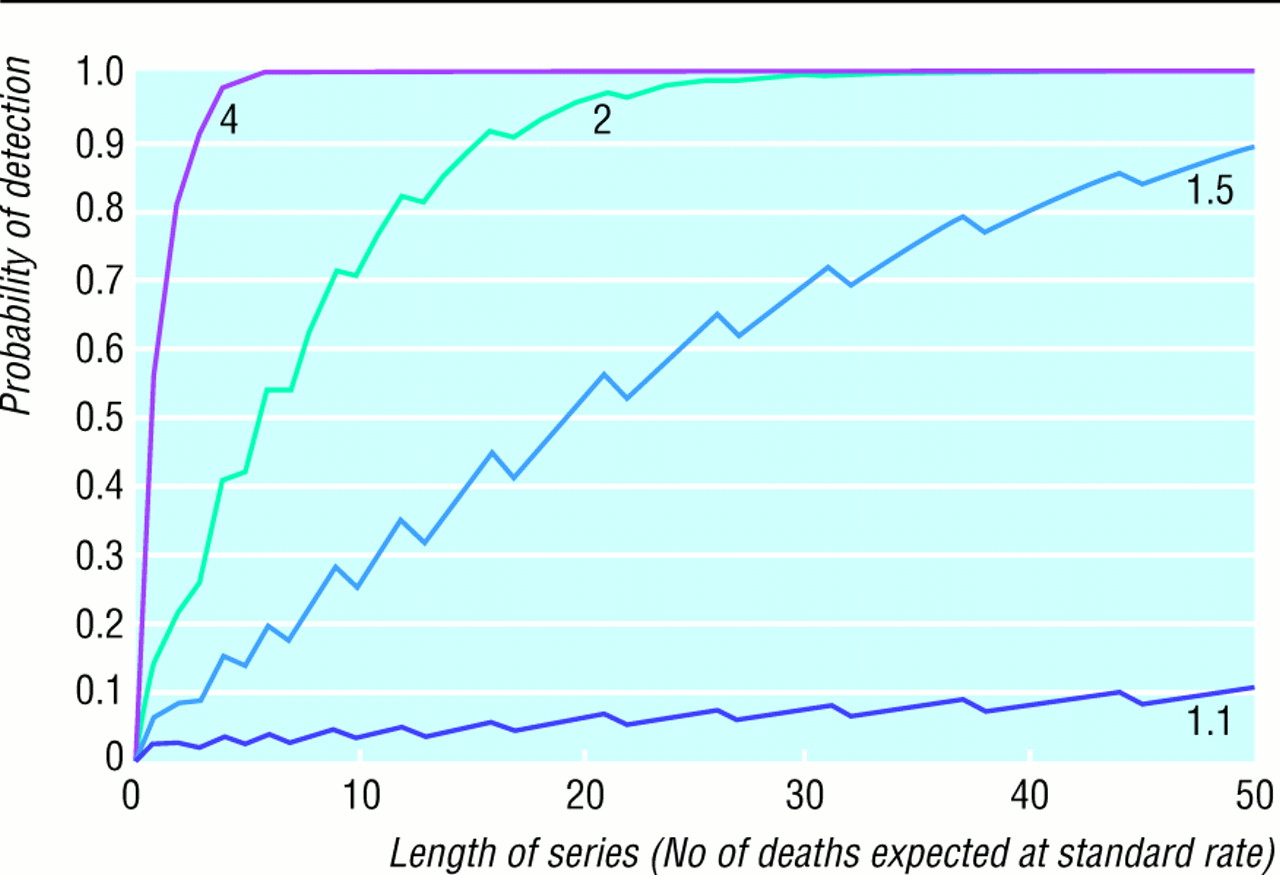
The statistical power of varying lengths of series to detect increases in mortality was calculated for integral numbers of predicted deaths and integral numbers of observed deaths by assuming that the number of deaths would follow a Poisson distribution with the mean equal to the predicted number (figure). The power may be overestimated by this approximation. The length of a series is specified in terms of risk exposure the expected number of deaths. The same number of deaths can be expected from a short series of high risk cases as from a longer series of lower risk cases. The calculations were used to decide how many recent operations were needed to compare with earlier performance to try to detect a change in mortality.

Probability of detecting an increase in death rate when the rate increases by a factor of 1.1, 1.5, 2, and 4. For example, for 90% probability of detecting a doubling of death rate from a standard rate of 10% to 20%, 16 expected deaths are required at standard rate that is, 160 operations
The difference between the expected number of deaths according to the Parsonnet predictor and the actual number of deaths was plotted against the operation number in chronological sequence.10 Control limits for variations in death rate with time were calculated at a nominal level of significance by comparing recent operations with earlier operations. The control limits indicate when the number of deaths in recent operations is significantly different at P<0.01 from the number of deaths predicted by a combination of the Parsonnet score and the previous rate of overperformance or underperformance relative to the Parsonnet score. The χ2 statistic with one degree of freedom was used, but this did not amount to a formal test of significance because the calculations were performed after every operation and no allowance was made for the number of tests.
Results
From January 1992 to August 1995, 3983 heart operations were performed. The youngest patient was 16 years old, and there were no missing data for Parsonnet scoring. Expected predischarge mortality according to the Parsonnet predictor was 376 (9.4%). The case mix as assessed by prospective Parsonnet risk of death in hospital varied with calendar year and ranged from 8.7% to 10.6% (P<0.0001) (table 2). Patient factors rather than procedural factors (table 1) were responsible, and the most significant change was in the age of the patients (table 2).
Annual death rates from 1992 to August 1995, with odds ratios relative to 1992
The actual number of deaths for the whole period was 277 (7.0%), which was 99 (26.3%) fewer than the Parsonnet estimate (P<0.0001). For the 656 (16%) patients with a Parsonnet score of 0 the observed number of deaths was 7 (1.1% (95% confidence interval 0.3% to 1.8%)).
Mortality by calendar year ranged from 5.6% to 7.7%, and the difference between the actual and predicted number of survivors as a proportion of predicted deaths represented an improvement of 16% to 39% compared with the Parsonnet estimate (table 2). Logistic regression estimates for the odds ratio of death in a given year, with 1992 as the reference year, ranged from 1.0 to 1.5, but the annual variations in mortality were not significant (P=0.18). The parameter estimate for the Parsonnet predictor in the regression model was close to 1.0 (0.95 (SE 0.06)), indicating that a factor of proportionality was all that was required to make the relative risk of mortality expressed as ln of the odds consistent with the Parsonnet prediction.
To see whether the death rate changes, we have to decide how far back in time a change might have occurred. This divides the series into recent versus earlier operations and allows a standard statistical test for a change (χ2 test) to be applied. The more operations that are included in the recent group the greater the power to detect a small change in the death rate, but this means operations continuing for perhaps an unnecessarily long time after there has been a large increase in death rate.
To choose a suitable number of recent operations, we examined the theoretical statistical power to detect changes in mortality. The risk exposure that is, the expected number of deaths rather than the number of operations determines the power, and we can specify the increase in mortality that we want to detect in multiples of the control rate without having to specify what the control rate is. Figure 1 shows the number of expected deaths required for a given probability of detecting increases in mortality. The plots are not smooth because the number of deaths has to be a whole number. A doubling of mortality can be detected with a risk exposure of 16 deaths, and 90% power, and it was decided to use this number of 16 expected deaths as the specification for a suitable number of recent operations.
Each successive run of cases with an expected mortality of 16 deaths was compared with all earlier operations. After 1338 operations performance was 39.3% better than the Parsonnet prediction. For the next 313 cases the Parsonnet prediction was 26.4 deaths, and therefore 16 deaths were expected at the previous level (39%) of performance relative to Parsonnet. Among these 313 cases, however, 27 patients died and the control limits were crossed at operation 1651 (fig 2). After another 86 operations the series was again within control limits for P=0.05 (not shown). There was only one other crossing of the 0.01 control limits, which occurred at operation number 2189; after another 34 operations the series was again within 0.05 limits.
Cumulative risk adjusted mortality chart with 99% control limits for change in mortality in last 16 expected deaths
Discussion
Data on risk factors suitable for monitoring deaths after heart surgery can readily be collected, and chart based methods can give an early indication of a deterioration in success rate. Mortality results in our series were overall 26% better than the Parsonnet estimate, which was derived in New Jersey in 1989.7 There were differences in the scoring system that we used compared with that of Parsonnet et al7 because, for example, heart transplants were not performed at their hospital.
Published comparisons of the performance of different hospitals or surgeons are likely to remain of limited value, even with the best possible use of the available data relating to risk factors. The performance data are sometimes anonymous11 and often out of date by the time of publication.12 A more fundamental limitation is that the comparisons are not based on randomised allocation of patients. Thus any differences in performance may be due to unmeasured factors affecting the case mix. Diverting patients or resources from one service to another on the basis of an unrandomised comparison, even if feasible, may not improve results.
In-house control
The charting procedure can be useful despite inevitable imperfections in risk adjustment based on routinely collected data because the purpose is to detect a change, particularly a deterioration, as a trigger for further investigation. A possible explanation for change could be that the patient population has changed in a way not adequately modelled by the risk adjustment, and this in some cases might lead to refinement of the preoperative risk assessment. When Parsonnet factors are not available, risk adjustment could be obtained from logistic modelling. 13 14 The logistic estimate should also be adjusted for current performance relative to prediction, as is done here with the Parsonnet estimate.
Figure 2 shows occasional deteriorations in survival rate, which last for varying periods of time. The formal statistical analysis by calendar year shows that they do not necessarily represent anything other than random variation about a constant survival rate. The control limits on the plot do not have a formally specified false positive rate (P value) because there is repeated testing at the 0.01 level, but they are clearly capable of giving warning of an adverse trend. A lower threshold for significance would give more frequent warnings, several of which would be false alarms. It seems better therefore to use the plot of actual results — that is, the centre line of figure 2 —as an informal visual early warning system and to reserve the statistical control limits as a trigger for formal investigation which would occur, hopefully, not too frequently. Corrective action is sometimes possible, 1 15 and it may be negligent to operate without a control scheme.
Calculating the ris
There has been no established method of calculating the chances that the patient will survive the operation, and consequently it has been difficult to know what to tell the patient. It will never be appropriate to tell the patient that the risk of death is zero. Other estimates, if unjustifiable, could be the subject of litigation. 3 16 The estimate should take into account risk factors and recent performance. The method used here is to calculate the risk using preoperative risk factors (in this case Parsonnet factors) and to adjust for recent overperformance or underperformance relative to this estimate.
Acknowledgments
The support and encouragement of surgeons John Parker, John Smith, and Andrew Murday are gratefully acknowledged. Martin Bland gave additional statistical advice. Many other colleagues gave valuable support.
Contributors: The cumulative risk adjusted mortality chart was developed by JP at St George's in 1995 and was used that year to display the performance of junior surgeons to the Royal College of Surgeons training inspector. It was presented in 1996 at seminars of the Universities of London and Sussex and at a public meeting at St George's Hospital on practical issues in organ transplantation. Figure 2 is a simplified version of the cumulative risk adjusted mortality chart. This paper is the first publication of statistical control limits for this type of chart. OV was responsible for the data. PL helped formulate and draft the paper. Tom Treasure helped to draft the paper. JP is guarantor for the study.
Funding: None.
Conflict of interest: None.