Ecological analysis of collectivity of alcohol consumption in England: importance of average drinker
BMJ 1997; 314 doi: https://doi.org/10.1136/bmj.314.7088.1164 (Published 19 April 1997) Cite this as: BMJ 1997;314:1164
- Helen Colhoun, clinical lecturera (helen{at}public-health.ucl.ac.uk),
- Yoav Ben-Shlomo, senior lecturerb,
- Wei Dong, lecturera,
- Lulu Bost, statisticiana,
- Michael Marmot, professora
- a Department of Epidemiology and Public Health, University College London, London WC1E 6BT
- b Department of Social Medicine, University of Bristol, Bristol BS8 2PR
- Correspondence to: Dr Colhoun
- Accepted 16 January 1997
Abstract
Objective:To assess whether the average consumption of alcohol is associated with the prevalence of heavy drinking, problem drinking, and abstention in England.
Design:Ecological analysis using data from a cross sectional household based survey of English adults.
Subjects:Random sample of 32 333 adults from the English population who participated in the 1993 and 1994 health surveys for England.
Main outcome measures:Association, expressed as the correlation coefficient, between the regional mean and median alcohol consumption and the regional prevalence of heavy drinking, problem drinking, and abstention.
Results:Mean consumption of alcohol in light to moderate drinkers was strongly positively associated with the prevalence of heavy drinking (r=0.75 in men and r=0.62 in women for drinking more than 21 and 14 units per week respectively). A similar association was found between median consumption and prevalence of heavy drinking. Abstention was not significantly associated with mean consumption in drinkers (r=0.08 for men and r=-0.29 for women). Both the median and mean consumption in drinkers were positively associated with the prevalence of problem drinking as defined by the CAGE questionnaire on alcohol use (r=0.53 for men and r=0.42 for women for the association with mean consumption).
Conclusion:Factors that increase the average consumption of alcohol in the population may result in an increase in the prevalence of heavy drinking and related problems.
Key messages
Regional mean alcohol consumption of those who do not drink heavily is strongly correlated with the regional prevalence of heavy drinking
Regional mean consumption is also associated with the regional prevalence of problem drinking as defined by the CAGE questionnaire
These observations imply that factors increasing mean consumption in light to moderate drinkers are likely to result in an increase in heavy drinking and related problems
The regional prevalence of abstention is not strongly associated with regional mean consumption, so any increase in problems from heavy drinking resulting from an increase in mean consumption cannot be assumed to be offset by beneficial effects on cardiovascular disease from reduced abstention
Introduction
There has been widespread criticism of the British government's increase in the definition of the upper limit of sensible drinking to between 3 and 4 units a day for men and between 2 and 3 units a day for women.1 2 The Interdepartmental Working Group considered that there was little evidence of harm at these rates of consumption and pointed to the possible benefits of light drinking on the risk of cardiovascular disease.1 However, the single population theory, as propounded by Rose, Ledermann, Skog, and others, states that the distribution of alcohol consumption moves up or down as a whole and that drinking behaviour is under “collective influence.”3 4 5 If the theory is correct it suggests that any increase in mean consumption is likely to lead to an increase in the prevalence of heavy drinking. Indeed, a separate working group of the royal colleges considered that public health would be affected adversely if mean consumption were to increase.6
The single population theory has been supported most convincingly by an analysis correlating mean consumption and the prevalence of heavy drinking across 32 centres participating in the Intersalt study.3 However, several important questions remain unresolved, which we address in this paper using data on alcohol consumption across English regions.
Firstly, as was pointed out in the Interdepartmental Working Group's report,1 whether such between country differences will also be seen within a country such as the United Kingdom is unclear.
Secondly, the theory suggests that an increase in mean consumption would also lead to a decrease in the prevalence of abstention, something that has not been consistently shown. This is particularly important for public health as an increase in the prevalence of light consumption and a corresponding reduction in abstention could result in a reduction in cardiovascular disease in some age groups.7
Thirdly, as women who drink heavily are more likely than men to drink at home the degree of collectivity of consumption among women might be less than among men, but this question has not been specifically examined.8 9
Finally, the single population theory has been criticised as being simply a statistical artifact on the grounds that mean consumption and the prevalence of heavy drinking must be correlated as a higher proportion of heavy drinkers will inevitably increase mean consumption.10 Our analysis addresses this criticism by removing heavy drinkers from the calculation of mean consumption and also by analysing the association between median consumption and the prevalence of heavy drinking. As an alternative approach we also used a measure of problem drinking, the CAGE questionnaire on alcohol use, which does not directly contribute to the mean.
Subjects and methods
The health survey for England is an annual household based survey that is carried out across all regions in England. The methods have been fully described elsewhere.11 12 We used data on 32 333 adults who participated in the 1993 and 1994 health surveys for England to calculate the mean alcohol consumption and the prevalence of heavy drinking and abstention for each of the former 14 regional health authority areas. The survey entailed an interview, during which respondents were asked about how much and how often they had drunk alcohol over the previous 12 months. This was used to estimate weekly consumption. The method is the same as that used in the general household survey.13 The invited sample was representative of the total English adult population in age, sex, regional distribution, socioeconomic status, and ethnic group. A new sample is invited each year, so the data for 1993 and 1994 are independent. The household response rate was 81% in 1993 and 77% in 1994. The response rate varied from 77% in the North East Thames region to 85% in the East Anglia region. Within regions the interviewed sample was representative of the age, sex, and social class of the total population of the region.
Sex specific mean consumption was correlated against the proportion of heavy drinkers across regions. Correlations were examined visually in scatter plots and were summarised using least squares linear regression weighted by the sample size in each region. The strength of the association was given by the correlation coefficient and the slope of the association by the regression coefficient for a unit difference in mean consumption (see table 2).
As the definition of heavy drinking is to some degree arbitrary, we used several definitions, thereby examining the sensitivity of the results to different thresholds. Three thresholds were used–the previous recommended limits (above 21 and 14 units per week for men and women respectively); the new daily benchmarks averaged over a week (28 and 21 units); and the value defining the highest 10% of consumption for both men and women as this affects a similar proportion of men and women, unlike the other definitions. The analysis was carried out with and without heavy drinkers contributing to the mean, thereby reducing the degree of inbuilt correlation between the mean and the proportion of heavy drinkers. As the median may be a better measure of the central tendency for a skewed distribution, we also examined the association between the median consumption among drinkers and the prevalence of heavy drinkers. The use of the median consumption also has the advantage that, provided the median is below the threshold for defining heavy drinking (which it is), it will not have an inbuilt correlation with the prevalence of heavy drinking.
The association between mean and median consumption in drinkers and the prevalence of non-drinkers was examined by the same method. Those who had never drunk and those who had not drunk any alcohol in the previous year were classified as abstainers. For this analysis abstainers were excluded from the calculation of the mean and median as the mean and median for the total population have an inbuilt correlation with the prevalence of abstention.
We also examined the relation between mean and median consumption among drinkers and a measure of problem drinking that does not contribute directly to the calculation of the mean. Problem drinking was defined as a score of two or more on a modified CAGE questionnaire on alcohol use of six items,14 which has been used in other population surveys.9 Three of the questions examine physical dependence (being unable to stop drinking, drinking to steady nerves, and having shaking hands on the morning after drinking) while the others concern social attitudes to drinking (feeling guilty, feeling you should cut down, being annoyed at others' criticisms of your drinking). We hypothesised that the questions on physical dependence were less likely than the others to be influenced by the extent of the acceptance of drinking in a culture and may therefore provide a more independent measure of problem drinking for the purpose of this analysis. We therefore examined the association between the mean and median consumption in drinkers and the prevalence of physical dependence (a score of at least one on these three questions).
Results
Table 1 shows the number of respondents, mean consumption, prevalence of abstention, and prevalence of drinking above 21 and 14 units for men and women respectively for the 14 regions from the north to the south of England. There was greater variation in the mean consumption and the prevalence of heavy drinking between regions among men than among women.
Mean consumption of alcohol and prevalence of heavy drinking and abstention in total population by region
Association of mean alcohol consumption in total population and in population excluding heavy drinkers with prevalence of heavy drinking across 14 English regions
There was a strong positive association between mean regional consumption and the prevalence of heavy drinking (fig 1 and fig 2), and this was found with all three definitions of heavy drinking (table 2). Unsurprisingly, the association was weakened when heavy drinkers were excluded from calculation of mean consumption, but it still remained strong. The association was similar for men and women (table 2). The associations were of similar magnitude when the analysis was restricted to those aged under 65 years and when abstainers were excluded.

Relation between mean alcohol consumption and prevalence of drinking more than 21 units a week in men across 14 regions in England
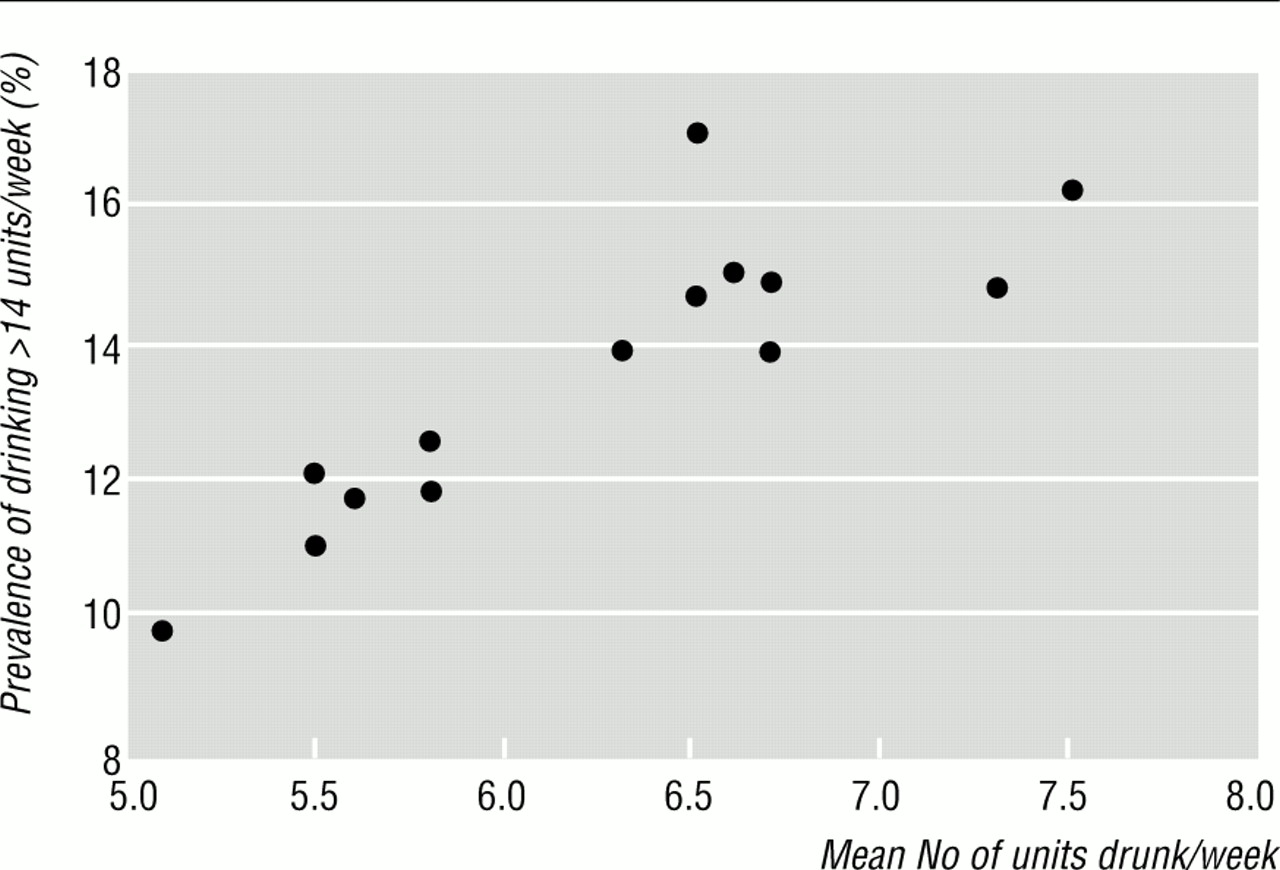
Relation between mean alcohol consumption and prevalence of drinking more than 14 units a week in women across 14 regions in England
Median consumption was strongly associated with the prevalence of heavy drinking across regions (table 3). As the proportion of abstainers could influence this association, we repeated the analysis excluding them. The association between median consumption in drinkers and the prevalence of heavy drinking was of a similar size to that in the whole population. For example, when heavy drinking was defined as above the 90th centile the correlation coefficients with median consumption in drinkers were 0.90 and 0.75 for men and women respectively.
Association between median alcohol consumption and heavy drinking across 14 English regions
On the basis of these data, a difference in the mean consumption of alcohol of 1 unit a week among men who did not drink heavily was associated with 1.3% more of the male population drinking above the current sex specific 90th centile or with 6.3% more drinking above 21 units a week (table 2). A similar difference among women who did not drink heavily was associated with 3.4% more women drinking above the sex specific 90th centile.
The association between the prevalence of abstention in men and women and the mean consumption in drinkers was much weaker (r=0.08, P=0.8 for men and r=-0.29, P=0.3 for women). The association between the median consumption in drinkers and the prevalence of abstention was of similar size (r=-0.05, P=0.9 among men and r=-0.35, P=0.2 in women).
The prevalence of problem drinking and physical dependence as defined by the CAGE questionnaire increased with drinking level (table 4). The prevalence of problem drinking was 3.7% among men and 2.3% among women drinking less than 21 and 14 units per week respectively. Regionally, the correlation between problem drinking and prevalence of drinking above the 90th centile for the total population was stronger among men (r=0.65, P=0.01) than women (r=0.45, P=0.1). Among those who drank the correlation between problem drinking and prevalence of drinking above the 90th centile was much higher for men (r=0.64 P=0.01) than women (r=0.24, P=0.4). Among women drinkers a higher correlation was seen for the association between the regional prevalence of regional heavy drinking and the physical dependence score (r=0.49, P=0.07 for women and r=0.54, P=0.05 for men).
Prevalence (%) of problem drinking and physical dependence defined by CAGE questionnaire by drinking level among drinkers
A moderately strong association among men and women was found between the mean and median consumption among drinkers and the proportion of drinkers with CAGE defined problem drinking (table 5). Among women the score for physical dependency showed a stronger association than the score for problem drinking.
Association of mean and median consumption among drinkers with problem drinking and physical dependence defined by CAGE questionnaire
Discussion
Our analysis confirms that the prevalence of heavy drinking is strongly associated with the mean and median consumption of the population across England and also shows that this is true for women and men. This builds on previous evidence supporting a dynamic relation between average consumption and heavy drinking and dismisses the idea that this relation does not exist within the United Kingdom. Regions where the average level of consumption is lower have fewer heavy drinkers–that is, there is a corresponding downward shift of the distribution. Among men, for example, the highest prevalence of drinking more than 21 units a week was in the Northern region (38.5%), where mean consumption was 22.7 units a week, and the lowest prevalence was in the North East Thames region (23.5%), where the mean was 14.3 units a week.
Previous analyses have tackled the problem of inbuilt correlation by repeating analysis with heavy drinkers excluded from the mean value.3 We took this further by examining the association of the median consumption with the prevalence of heavy drinking. Median consumption does not have an inbuilt correlation with the prevalence of heavy drinking. We found associations between median consumption and heavy drinking that were as strong as those for mean consumption.
Similarly, CAGE scores did not contribute to mean consumption and therefore any associations found cannot be due to an inbuilt correlation with heavy drinking. The prevalence of CAGE defined problem drinking was associated with both mean and median consumption in drinkers. Among men our analysis shows that variation between regions in mean or median consumption among drinkers is associated with variation in the prevalence of problem drinking.
Among women CAGE defined physical dependence showed a stronger association with average consumption and heavy drinking than did CAGE defined problem drinking. Our data suggest that CAGE data among women should be interpreted with caution; relevantly, the early validation studies of the CAGE questionnaire were largely in male patients.14
Implications for alcohol policy
We emphasise that our findings do not imply an inevitable relation between average consumption and prevalence of heavy drinking. An increase in mean consumption could result from a few abstainers taking a small amount of alcohol or from heavy drinkers increasing the amount they drink, without any change in the prevalence of heavy drinking. Neither do our findings rule out the possibility that measures aimed at the drinking practices of specific subgroups of the population rather than the general population might change the practices of people in a specific part of the distribution. For example, advice on the adverse consequences of abstention might change the practice of abstainers; indeed, such advice was given by the Interdepartmental Working Party.1 However, as noted above, when abstainers are excluded from the analysis the remaining variation both in median and mean consumption in moderate drinkers is strongly associated with variation in the prevalence of heavy drinking. Thus many factors determine a person's or population subgroup's alcohol consumption, but our analysis strongly supports the thesis that some social mechanisms have a detectable influence on drinking patterns in the collective population and that these have implications for public health.
The Interdepartmental Working Group's recommendation of an increase in sensible drinking benchmarks aims to inform the public that higher consumptions than previously recommended are safe and to encourage small amounts of regular drinking as opposed to bingeing.1 However, it assumes that heavy drinkers are indifferent to the acceptability of drinking in their culture and that an upward shift in consumption among moderate drinkers, which might result from increasing the benchmark for so called sensible drinking, is harmless. Our analysis suggests that this is not the case and that higher average consumption among moderate drinkers is associated with higher rates of heavy drinking and problem drinking. A separate issue is of course that, overall, the greatest burden of alcohol related problems is among the large group of moderate drinkers at low risk rather than the smaller number of people at high risk.
A much weaker association was found between the prevalence of abstention and mean consumption in drinkers, particularly among men. This suggests that the social determinants of abstention may differ from those that interweave the consumption patterns of heavy and moderate drinkers. Therefore, an increase in mean consumption among drinkers cannot be assumed to result in decreased abstention. In other words, the adverse consequences of an increase in heavy drinking could not be assumed to be offset by the beneficial effects on cardiovascular disease from a decrease in abstention.
There are several limitations to this analysis. We examined variations in consumption by regional health authority, so the correlation was based on only 14 areas. This reduced our power to show significant associations, although the large sample size did allow our estimates of both consumption and heavy drinking to be precise. Very heavy drinkers are likely to be underrepresented in population based household surveys which do not include non-household residences.15 However, this non-response would tend to reduce the power to detect an association between the regional median or mean in moderate drinkers and the prevalence of heavy drinking rather than to a false positive association. A false positive association would result only if the non-response was systematically higher among heavy drinkers in regions with lower mean consumption among moderate drinkers, which is unlikely. Heavy consumers have also been shown in some but not all studies to understate their consumption, and estimates of consumption from surveys are usually less than those expected from sales statistics.15 In addition, some studies have found that married women underreport consumption if their husband is present, although in general sex differences in validity of reporting are not found.16 Misclassification of heavy drinkers could give rise to an association between mean consumption and the prevalence of heavy drinking under certain conditions. However, misclassification could not account for the association that we found between the prevalence of heavy drinking and median consumption unless heavy drinkers were misclassified as drinking less than median, which is most unlikely.
Our analysis is based on cross sectional data. Such associations do not necessarily mean that similar changes will be seen with changes in mean consumption over time.10 This is a valid criticism, but it is countered by other analyses that have shown increases in heavy drinking with increases in mean consumption over time.5
Conclusion
The influence of guidelines or benchmarks on drinking behaviour is questionable.17 However, other policies such as the liberalisation of opening hours or reducing the real cost of alcohol are likely to be more effective in increasing mean consumption. Our data suggest that policies that increase consumption of the general population may lead to an increase in the amount of problem drinking and related problems and are therefore not in the interest of the public's health.
Acknowledgments
We thank P Prescott-Clarke, I White, and L Stevens for their comments on an earlier draft of this article.
Funding: MM is a Medical Research Council research professor. The health survey for England is commissioned by the Department of Health. The 1993 survey was carried out by the Social Survey Division of the Office of Population Censuses and Surveys, and the 1994 survey was carried out by the Joint Health Surveys Unit of Social and Community Planning and Research and the Department of Epidemiology and Public Health, University College London.
Conflict of interest: None.