Fundholders' prescribing costs: the first five years
BMJ 1996; 313 doi: https://doi.org/10.1136/bmj.313.7071.1531 (Published 14 December 1996) Cite this as: BMJ 1996;313:1531
- Correspondence to: Professor C M Harris, Academic Unit of General Practice, Leeds LS2 9LN.
- Accepted 28 October 1996
Abstract
Objectives: To determine whether the first five waves of English fundholding practices have reduced their prescribing costs relative to non-fundholding practices, and the duration of any reduction achieved.
Design: Analysis of item and cost data for all general practices in England in the six years from April 1990 to March 1996. The practices of each of the first five waves were identified at the Prescription Pricing Authority.
Setting: All general practices in England.
Main outcome measures: Changes and rates of change in net ingredient cost per prescribing unit, and changes in number of items per prescribing unit in fundholding practices, before and after fundholding, relative to continuing non-fundholders.
Results: Absolute prescribing costs increased over the six years, by 66% in the continuing non-fundholders and by 56–59% for fundholders. Successive waves of fundholders showed a similar pattern of change: a small relative reduction in the pre-fundholding year, maximum relative reduction in the first year, and a declining relative reduction in the second and third years. After this, their increases in costs were largely similar to those of non-fundholders. The number of items dispensed remained stable over the six years in all groups.
Conclusions: The real budgets operated by fundholders were associated with a reduction in costs of about 6% relative to continuing non-fundholders, and this saving seemed to be retained during the study. The relative reduction was small compared with the absolute increase seen in all groups and disappeared after the third year of fundholding. It was brought about by lowering the average cost per item rather than by giving fewer items.
Key messages
We analysed national data for all general practices in England over the six years from April 1990: the absolute cost per prescribing unit increased greatly in all practices, though to a slightly lesser degree in fundholders
The relative reduction in costs of fundholders, compared with non- fundholders, began in the pre-fundholding year, reached about 6% altogether in the first three years of fundholding, and then ceased though the saving remained
Reduction in costs was achieved by reduction in the average cost per item rather than by decrease in the number of items dispensed
In financial terms fundholding has therefore had some success
Introduction
When prescribing budgets for practices were introduced in April 1991 they were, for most practices, no more than notional. Termed “indicative prescribing amounts” (and, later, “target budgets”), sanctions against exceeding them were minimal, and incentives to keep within them did not exist. For the first wave of fundholding practices, however, prescribing budgets were real and the consequences of overspending were clear. Most importantly, there were incentives not to overspend: savings could be used to improve the practice's care of patients in approved ways, including supplementing either of the other two budgets—those for staff and for some aspects of hospital care.
It was well recognised that, of the three areas budgeted, the greatest potential for making savings lay in prescribing,1 and that prescribing budgets were intended as one of the government's many initiatives aimed at exerting downward pressure on the ever increasing national drug bill. They have given rise to many questions, mainly about the methods and fairness of budget allocation, and about their effectiveness.
Two important papers appeared in 1993. Bradlow and Coulter, in the former Oxford region, compared the prescribing costs of eight fundholding practices and seven non-fundholders in the six month periods before and after April 1991.2 The increase in costs was greater in the non-fundholders than in either dispensing or non-dispensing fundholding practices (18.7%, 10.2%, and 13.2% respectively); the rise in average cost per item followed the same pattern (11.9%, 4.8%, and 5.7%). Maxwell et al simultaneously reported a study in Scotland.3 They looked at six fundholding groups in the Grampian and Tayside regions and at six non-fundholding practices in Grampian from November 1990 to October 1992. Though both fundholders and non-fundholders reduced their prescribing volume for the classes of drug analysed, drug unit costs rose by 24% in the non-fundholding practices but by only 11% and 16% in the Tayside and Grampian fundholding practices respectively. The authors emphasised the importance of measuring drug volume in defined daily doses4 rather than by number of items, and noted that all the non-fundholders became fundholders soon after the study.
In 1994 the report of the Audit Commission was published.5 This looked at a sample of 3409 British practices, of which 289 were fundholders in 1992–3, excluding all practices with atypical percentages of elderly patients. The prescribing costs of the first and second wave fundholders in this year averaged 9.4% less per prescribing unit than those of the non-fundholders, and the average increase in cost per prescribing unit between 1991–2 and 1992–3 was 12% for non-fundholders, 10% for first wave fundholders, and 7.7% for second wave fundholders.
A paper by Wilson et al in 1995 studied prescribing in first, second, and third wave fundholders (100 practices) in the former Mersey region in the year before and the year after taking on fundholding and compared it with that of 319 non-fundholding practices.6 For all three waves, the rate of increase in costs was significantly lower than for the non-fundholders. Both cost per item and prescribing volume tended to decrease, the former mainly through an increase in generic prescribing. The authors cautioned against overinterpretation of their findings, since the fundholders were sited in more affluent areas than the non-fundholders, tended to be larger and better organised, and were more often training practices. By the end of the study, the differences between fundholders and non-fundholders in cost per item and generic prescribing were decreasing—possibly as a result of the incentive schemes offered to the non-fundholders in 1993, or because these practices were would-be fourth wavers who had to reach a generic prescribing rate of 50% by local regulations.
A second paper from the Oxford team, revisiting the practices studied two years earlier, also appeared in 1995.7 The pattern of change noted in 1993 had reversed, and between the second and third years the fundholders' costs increased much more than those of the non-fundholders. Differences between the two kinds of practice were of less importance than the size of the increase in both. The ensuing correspondence in the BMJ provided much support for the Oxford findings8: unpublished studies both in Avon and Nottingham found that fundholders had been unable to sustain their cost reductions. The Mersey researchers, however, thought that the finding of the reversal in the Oxford fundholders should be ascribed to the small number of practices studied and that incentive schemes for non-fundholders might be having an important effect.
Against this background of a growing suspicion that fundholders' budgets might have only short term effects in reducing costs, we studied item and cost data for all practices in England from April 1990 to March 1996, comparing successive waves of fundholders with continuing non-fundholding practices (those that did not take on fundholding in any of the five waves).
Methods
We obtained quarterly item and cost data from the Prescription Pricing Authority for all general practices in England for the six years from April 1990, and we identified the practices that became fundholders in each of the five waves to compare their performance over time with that of non-fundholders. The numbers of fundholders in each of the five waves were, respectively, 300, 277, 635, 793, and 644, totalling 2649. We measured cost and item data per prescribing unit (where patients aged 65 and over count as three units and all others count as one). Fewer than ten practices had given up fundholding, and we excluded these: they could have had little effect on the results.
Results
COSTS
Table 1 shows the annual net ingredient cost per prescribing unit over the six years for each of the five waves of fundholders and for the continuing non-fundholders. In 1990–1 the general practices that were about to become the first wave of fundholders were the only group with costs lower than those of the group that never subsequently became fundholders, and during the whole study period their costs remained lower than those of any other group. Over the six years, the costs of the continuing non-fundholders increased by 66%, while those of the five waves of fundholders rose by 56–59%.
Annual prescribing costs for all general practices in England by fundholding status (continuing non-fundholders and each wave of fundholders)
Figure 1 shows some of the same points graphically but also suggests that there has been a pattern common to all waves of fundholders—a small relative reduction in costs in the year before fundholding, the largest relative reduction in the first year of fundholding, and a tailing off in relative reduction over the next two years. Differences between the practices of the first wave and of the later waves are apparent.

Cost per prescribing unit for each wave of fundholding general practices in England as a percentage of the cost for the continuing non-fundholders: before and after fundholding 1990–1 to 1995–6, by quarter
Figure 2 makes this common pattern clearer by aligning the starting points of the five waves and showing the percentage quarterly change in costs of each wave relative to those of the continuing non-fundholders. No data were available for 1989–90, so that the percentage change for the first wave in its pre-fundholding year cannot be included. The other waves all achieved some relative reduction in their pre-fundholding year and went on to make their greatest relative reduction in the first year. Waves 1–4, for which more than one year's data existed, then showed steep rates of increase, which, for waves 1–3, took them temporarily above the costs of the non-fundholders. These later turned down again.

Percentage change in costs for each wave of fundholders relative to continuing non-fundholders, 1990–1 to 1995–6, by quarter, with commencement dates of the five waves aligned
We used the data from table 1 to calculate the annual percentage change for each fundholding wave and then subtracted the annual percentage change for the continuing non-fundholders. By weighting for the number of practices in each wave, we could then derive the average annual change in costs associated with fundholding over five years (table 2).
Average percentage change in cost per prescribing unit for fundholding general practices in pre-fundholding and first five fundholding years, allowing for change in costs of continuing non-fundholders
ITMES
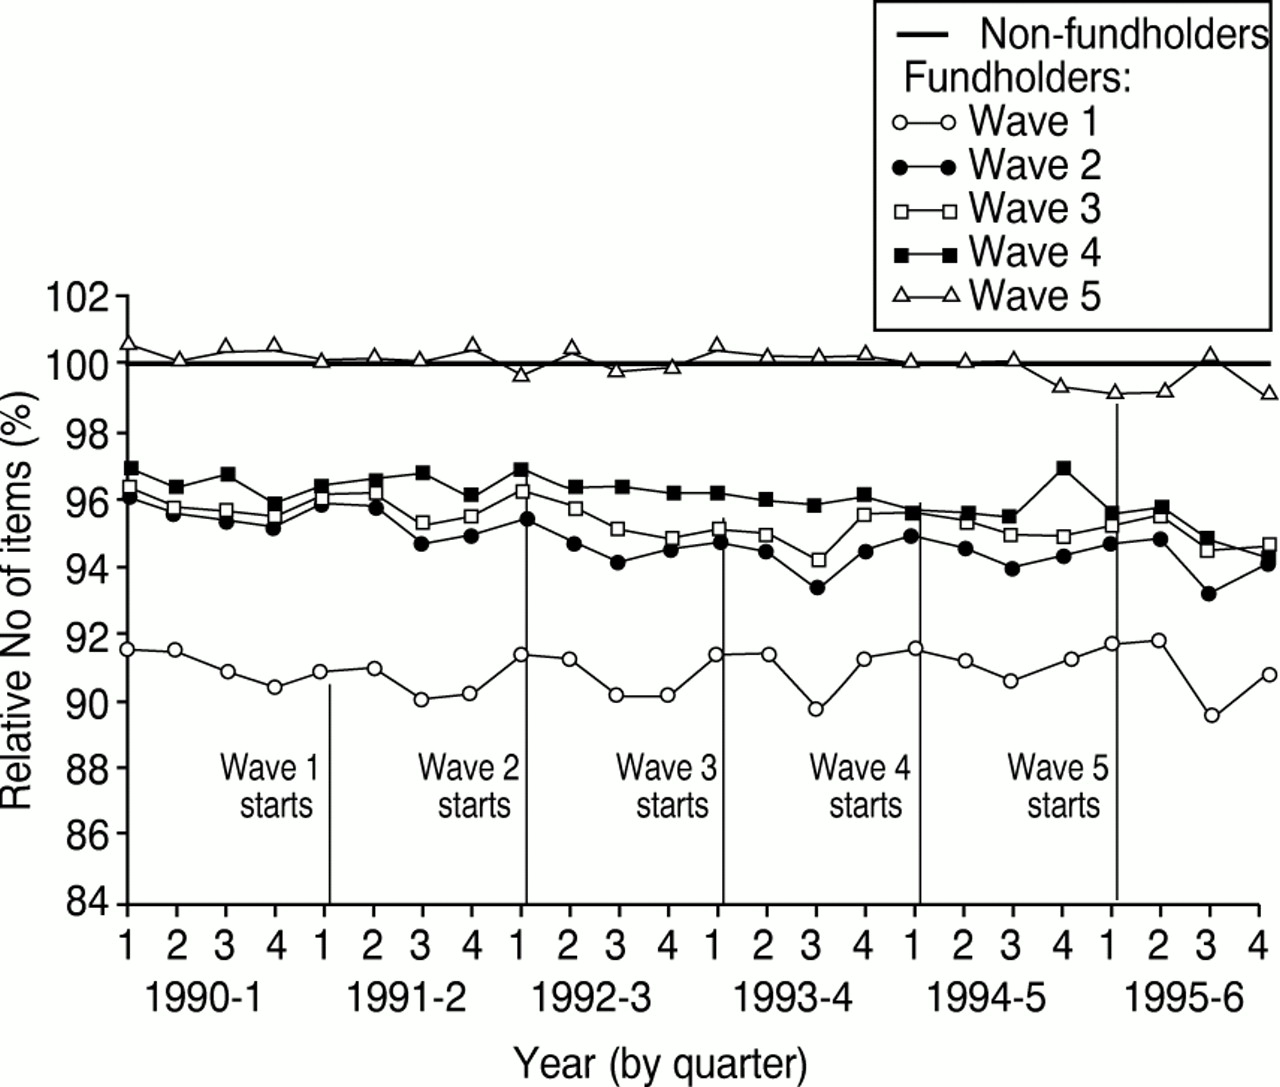
Figure 3 shows the number of items per prescribing unit dispensed for each of the five waves of fundholders relative to that of the continuing non-fundholder group over the six years of the study. The number for all groups remained stable, and each wave except the fifth had fewer items per prescribing unit than the non-fundholders. This implies that the relative cost reductions revealed in figure 1 must have resulted from a lowering of the average cost per item.

Number of items per prescribing unit for each wave of fundholders as a percentage of the number for the continuing non-fundholders: before and after fundholding, 1990–1 to 1995–6, by quarter
Discussion
Our study addresses two questions: whether the setting of real prescribing budgets for fundholders was associated with a reduction in prescribing costs, relative to non-fundholders, and how long any association lasted. We found that prescribing costs increased substantially in both fundholding practices (56–59%) and non-fundholding practices (66%) in the six years studied but that the fundholding practices did show a reduction relative to the non-fundholders of about 6%. The relative reduction began in the year before fundholding, was maximal in the first year of fundholding, and declined in the second and third years. After that the relative reduction ceased and the costs of the fundholders ran in parallel to those of continuing non-fundholders, locking in the decrease achieved.
The first wave fundholders differed from subsequent waves in that they alone had lower costs per prescribing unit than the continuing non-fundholders before they began fundholding, and they made greater savings subsequently than any other wave relative to the non-fundholders. Nevertheless, their overall pattern of change was similar to that of the other waves. It is too early to tell whether the very small further relative reduction they made in their fifth year will be continued, or whether it will be reflected in the performance of the other waves. It is possible that the practices of the first wave differed from those of later waves in several other respects7 and cannot validly be compared with them.
In financial terms, fundholding budgets therefore had some success in containing expenditure on drugs. It was not possible to quantify the savings made because of changes in drug use and drug prices over the six years and because many other pressures, both upward and downward, were operating simultaneously on all practices. The relative reduction was achieved by lowering the average cost per item, and other studies suggest that this will have been brought about largely by an increase in the level of generic prescribing. There are, however, several other ways of lowering the average cost per item: prescribing less expensive preparations, reducing the duration of prescriptions, and prescribing lower doses of some drugs.
LIMITATIONS OF STUDY
Our use of the continuing non-fundholding practices as the comparator presents a problem. They may differ in many ways from fundholding practices and have undergone different kinds of change over the six years—one of these being participation in the financial incentive schemes that began in 1993. It is therefore difficult to say exactly what the reduction of 6% means: there are no absolute standards against which to measure prescribing costs, and we must caution against interpreting the figure in ways that the study does not justify.
While agreeing with Maxwell et al that prescribing volume is ideally measured in defined daily doses rather than by number of items,3 we found this impossible for practical reasons. It is certainly vital in small scale studies, but, for analysis at a national level, using the number of items is not likely to distort the results.9 Similarly, using prescribing units rather than ASTRO-PUs as the population denominator makes little difference to the outcome of large scale studies using data aggregated from many practices.
It is possible that fundholding practices gave their patients private prescriptions more often than did non-fundholders when the cost to the patient was lower then the prescription charge. No evidence is available on this point, and there is doubt as to whether doing so is permitted within general practitioners' terms of service.
CONCLUSION
The two questions about fundholders' prescribing budgets have been answered as far as it is possible to do so. Since it is likely that prescribing budgets are here to stay, the two greatest needs now are to find the way of setting them that most effectively achieves reductions in costs and, more importantly, an appropriate method of assessing their cost effectiveness in terms of clinical outcome.
We thank the Prescription Pricing Authority for providing the data used in the study.
Footnotes
-
Funding The Prescribing Research Unit was funded by the Department of Health.
-
Conflict of interest None.