Article Text

Statistics from Altmetric.com
Introduction
New Zealand was the first country to develop national clinical guidelines recommending that an explicit measure of absolute cardiovascular disease (CVD) risk should be the primary determinant of a decision to initiate blood pressure or lipid-lowering therapy.1 2 To facilitate the assessment of absolute CVD risk, we designed the New Zealand CVD risk charts3 which made it possible for clinicians to rapidly assess and explain a patient's risk. A patient's 5- or 10-year predicted CVD risk (a short-term measure) is now widely recommended internationally as the key clinical information to inform CVD risk-management decisions. However, 15 years after introducing the New Zealand absolute risk-based recommendations, our experience suggests that absolute risk is still not well understood by many practitioners or patients, and we believe this has been a significant barrier to the implementation of absolute CVD risk-based management. In this article, we describe the strengths and weaknesses of ‘short-term absolute CVD risk’ as a clinically useful measure and introduce a new integrated set of measures now being widely tested in New Zealand—the Heart Forecast. These measures retain the strengths of previous absolute risk-based measures while addressing their weaknesses. In our opinion and those of clinicians now using the Heart Forecast, this may represent a significant advance in absolute CVD risk communication.
Absolute and relative measures of CVD risk and the management of cardiovascular disease risk
A patient's absolute or ‘global’ CVD risk is typically calculated as their predicted probability of having a symptomatic CVD event during the subsequent 5- or 10-year period. Measures of absolute CVD risk are derived from cohort studies that estimate the simultaneous effect of multiple risk factors on CVD event rates. The main reason for estimating patients' absolute CVD risk is to determine the likely absolute benefit of interventions (eg, the estimated number of people who could be prevented from having a new CVD event over a 5- or 10-year-period per 100 similar patients treated for this period). While the relative risk reduction achievable from treatment is very similar across a broad spectrum of patients, the magnitude of the treatment benefit has been demonstrated to be directly proportional to patients' pretreatment absolute CVD risk, even when blood pressure or lipid levels are considered to be at ‘normal’ levels. For example, the absolute benefits of blood pressure or lipid-lowering treatment have been observed to be two- to threefold greater in patients with ‘average’ blood pressure or blood lipid levels but high absolute CVD risk compared with patients with much higher levels of one or other of these risk factors but a lower pretreatment absolute CVD risk.4
The traditional approach to CVD risk-factor management was based on evidence from cohort or case–control studies that people with a significantly raised level of an individual risk factor were at a higher CVD risk relative to people with lower levels of this risk factor. However, there are several reasons why measures of individual risk factors and the use of individual risk factor treatment thresholds are poor indicators of both risk and the potential to benefit from treatment. First, CVD risk increases progressively from very low blood pressure and lipid levels that are typically described as normal and are well below typical treatment thresholds. Second, the atherosclerotic process underlying ischaemic events results from an interaction of many risk factors, with modest increases in multiple risk factors being more harmful than a significantly raised level of any single factor.4 Third, CVD risk is influenced by the length of exposure to risk factors that is poorly characterised by measurement of risk factors at one point in time. This explains why age is a powerful predictor of a future CVD event. While age may be a risk factor in its own right, it also serves as a proxy for the length of exposure to risk factors that are either unknown or unaccounted for in contemporary risk-prediction models.
These observations have led most national and international guideline developers to modify their previous ‘relative risk driven’ treatment recommendations based primarily on threshold levels of blood pressure or blood lipids, to take account of a patient's absolute CVD risk.
Short versus long-term (including lifetime) measures of absolute CVD risk
Most clinical guidelines on CVD risk factor management now recommend that treatment decisions should be informed by short-term (typically 5 or 10 years) estimates of absolute CVD risk, because a clinician's first priority is to decide how intensively to manage a patient's current risk. If the short-term risk is high, intensive management, usually with drugs and lifestyle modification, should be initiated. However, if the short-term risk is low, less intensive intervention strategies are appropriate in the short-term, usually based around lifestyle changes, as low-risk patients have more time to safely change their behaviour (and risk).
Both 5- and 10-year CVD risks are standard short-term measures, with the latter simply being slightly more than twice the magnitude of the former. In New Zealand, for example, 10-year CVD risk prediction charts were replaced by 5-year risk charts in national clinical guidelines from the mid-1990s. This change was stimulated in part by feedback from general practitioners that many patients considered a 10-year risk to be too far into the future to be very meaningful. In addition, as most trials of CVD risk factor interventions are about 5 years in duration, evidence-based estimates of treatment benefit are likely to be more accurate over 5 years than over 10 years.
It has been argued by some commentators that clinical decision-making should be informed by long-term rather than short-term CVD risk. This is particularly relevant for young people whose short-term CVD risk is almost invariably ‘low.’ A longer-term measure would ideally help identify those younger people who are most likely to develop an accelerated risk as a result of their current adverse risk factor profiles. However, it is almost impossible to differentiate meaningfully between the long-term risks of most patients. This is illustrated in an analysis predicting lifetime risk of CVD—the most extreme example of long-term CVD risk—among 50-year-olds in the Framingham Heart Study.5 The 3.2% of men and 4.5% of women who had ideal risk profiles had lifetime CVD risks, to age 95 years, of only 5.1% and 8.2% respectively. However, the remaining 95–97% of 50-year-olds all had high lifetime risks (about 36–69% among men and about 27–50% among women5); the CVD risk in all of these patients would justify similar clinical management. Lifetime risk versions of current CVD risk charts would classify everyone in the highest risk category. Long-term risk measures also have other shortcomings. For example, in the Framingham analyses described above, smokers and non-smokers had the same lifetime CVD risk, despite a twofold greater CVD risk in the short-term among smokers, because many of the smokers died from other diseases before they had a chance to have a CVD event.5
Understanding absolute risk
The main weakness of absolute CVD risk as a clinical measure, whether short or long-term, is that it is an unfamiliar concept to most people, whether they are patients or practitioners. Most of us understand relative risk—smokers have twice the risk of having a heart attack as non-smokers—but this information is not very helpful unless you also know the risk of heart attacks in non-smokers. Similarly, informing smokers that their current 5-year absolute risk of a CVD event is 10% is not much more useful, unless they are also told the absolute level of risk they could achieve by quitting and have a ‘yard-stick’ to gauge what this change in risk means. Most of us have little idea of the absolute magnitude of the many risks we expose ourselves to or guard ourselves against and therefore have little idea about how to respond to information about absolute risks or benefits.
Another problem with absolute measures of risk is that they are abstract constructs derived from mathematical algorithms. Blood pressure or blood lipids are direct, understandable measurements, and for both patients and clinicians it makes intuitive sense to use drugs or other interventions specifically designed to lower blood pressure or blood lipids. In contrast, it is less intuitive that blood pressure or lipid-lowering drugs can significantly lower CVD risk, even when these risk factors are considered to be ‘normal.’ It is even less intuitive that these same drugs could be more effective when given to patients with average levels of blood pressure or blood lipids than to patients with much higher levels.
All these factors are important challenges to the implementation of absolute CVD risk-based management recommendations.
Your heart forecast: an alternative approach to communicating short-term absolute cardiovascular risk that incorporates the benefits of relative risk and long-term risk measures
We present a new approach to communicating absolute CVD risk that was inspired by the work of Grover et al.6 They described a risk communication tool that estimated a patient's ‘cardiovascular age.’6 Their model estimates the life expectancy of individual patients based on their annual risk of fatal coronary disease, fatal stroke and non-CVD death, and compares it with the average life expectancy of individuals of the same age and sex. The difference between the two numbers is then added or subtracted from one's chronological age to provide the cardiovascular age. The difference between one's chronological age and cardiovascular age is the age gap. We believe that an estimated cardiovascular age and the age gap are more understandable than a measure of 5- or 10-year CVD risk. These new measures also combine both a relative component (are you older or younger than your cardiovascular age?) and an absolute component (the size of the age gap). In an accompanying editorial, we wrote ‘We think that Grover and colleagues may have found the right metric to translate predicted cardiovascular risk into something meaningful to patients and physicians: the age gap between real age and cardiovascular age.’7 Grover's approach also captures the increasing risk of a non-cardiovascular death and the shrinking time horizon as one ages that must attenuate the benefits of treatment among older individuals. Another strength is that the model estimates the long-term risks associated with a risk factor as well as the potential benefits of modifying that risk factor over one's entire life expectancy.
However, when we were developing the New Zealand Heart Forecast, we sought to use a ‘cardiovascular age’ metric that was directly linked to the assessment of 5 year CVD risk as currently recommended by the New Zealand CVD risk-management guidelines.8 We also wanted this metric to be easily displayed on the same graph as the 5-year CVD risk. Furthermore, rather than following Grover's approach that compared an individual's risk with the average risk of their age- and gender-specific counterpart, we chose to compare it with a more ‘ideal’ age and gender-specific risk. The main reason for taking this approach was because the average New Zealand CVD risk was considered too high by international standards to be an acceptable target.
Your Heart Forecast is a dynamic graphic integrated set of measures that conveys several CVD risk-communication messages in a stepwise fashion to forecast a patient's short-term CVD risk at all ages from 35 to 75 years. It uses existing risk communication metrics and adds further dimensions. Your Heart Forecast is available as a free stand-alone or downloadable tool for clinicians provided by the University of Auckland and the New Zealand National Heart Foundation (http://www.yourheartforecast.org.nz) and has also been integrated into PREDICT, a computerised clinical decision support system (http://www.enigma.co.nz/predict) by the Forecast software developers, Enigma Publishing. The Heart Forecast was designed to be consistent with the 2003 New Zealand Guidelines for the Assessment of CVD risk,8 which use a modified Framingham Heart Study risk prediction algorithm (see appendix) but could be relatively easily modified to use other risk prediction algorithms.
The components of the ‘Your Heart Forecast’ are described and illustrated in figures 1–3 using the example of a 35-year-old male smoker, with a blood pressure of 150/80 mm Hg and a total cholesterol-to-HDL cholesterol ratio (TC/HDL) of 5.7 but who does not have diabetes.

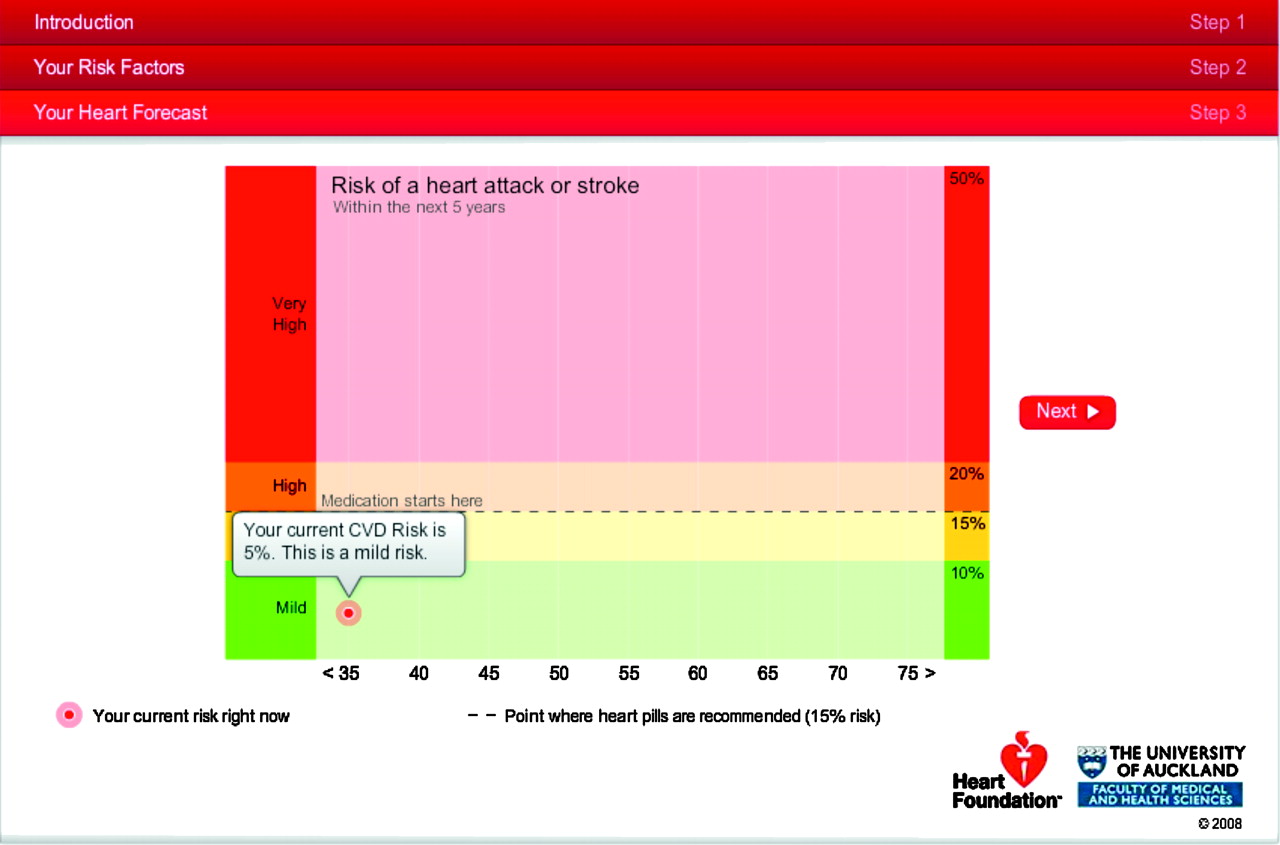
Your Heart Forecast: display of our 35 year old male patient's current 5-year CVD risk.

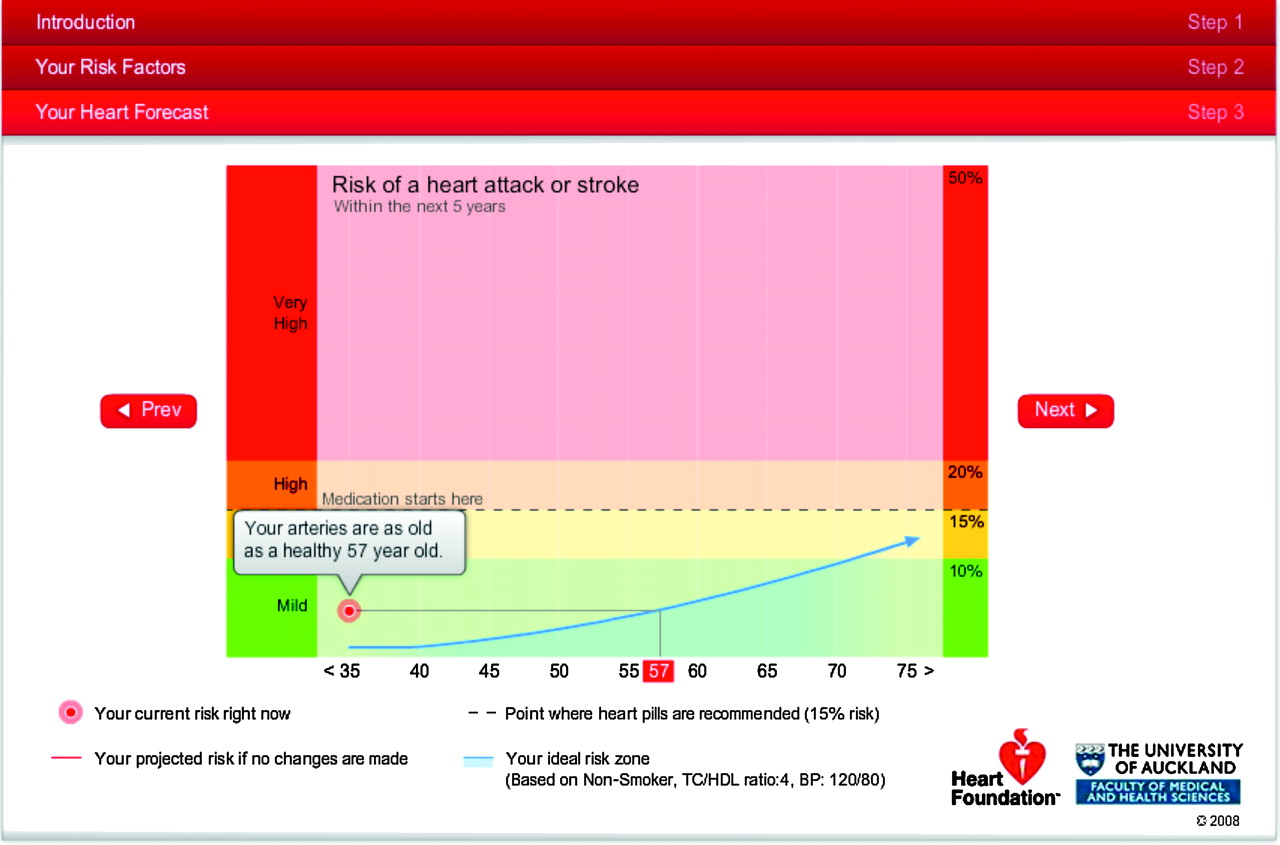
Your Heart Forecast: the 'cardiovascular age' of our 35 year old patient. His current CVD risk is projected to the age of a man with the same 5-year risk but with an ideal risk profile.

Your Heart Forecast: forecasts are projected for the patient based on his current risk factor profile if no changes occur (red trajectory) and if he was able to quit smoking (green trajectory).
Component 1: current 5-year CVD risk (%)
The Heart Forecast's first risk screen presents the patient's current 5-year absolute CVD risk (figure 1). In this example, the 5-year CVD risk, based on a standard published Framingham risk algorithm,9 is 5%. Increasing risk is illustrated by the same horizontal colour bands used in current New Zealand guidelines CVD risk colour charts.8 The dotted line represents the national recommendation to commence pharmaceutical management above a 15% 5-year CVD risk. However, the concepts are generic, and the Heart Forecast tool could be readily modified to use other risk scores and country-specific treatment recommendations.
Component 2: current 5-year risk relative to ideal 5-year risk trajectory
The second screen (not shown) illustrates the 5-year absolute CVD risk trajectory of a person who is the same age and gender as the patient but who has ‘ideal’ levels of the modifiable risk factors included in the risk prediction algorithm (ie, a non-smoker, with a systolic blood pressure (SBP) of 120 mm Hg and a TC/HDL of 4). These ideal blood pressure and TC/HDL levels have been derived from meta-analyses of individual participant data from 61 cohorts, including almost one million people followed for about 10 years.10 11 The trajectory draws a line through estimates of 5-year CVD risk calculated at 5-yearly intervals up to age 75 years, which is the age limit recommended by the algorithm's developers.9 This screen aims to provide information on the patient's current short-term absolute CVD risk relative to the current and future short-term absolute risk of a peer with an ideal (and achievable) risk profile.
Component 3: cardiovascular age
The third screen (figure 2) displays the ‘ideal’ risk trajectory, and a line is dynamically drawn from the patient's current absolute CVD risk to the age at which someone with an ideal risk factor profile would be to have the same current 5-year CVD risk of the 35-year-old example patient. This age is used to communicate the current impact of the patient's modifiable risk factors on his arteries. We call this age his ‘Arterial Age’ or Cardiovascular Age, and it is calculated in the same way as the Framingham Study investigators Heart Age,12 although using a slightly different ideal risk profile. The 35-year-old example patient is told that he has the arteries of a healthy 57-year-old man. This does not mean that he will develop heart disease 22 years earlier or that he has lost 22 years of his life; rather his current cardiovascular risk is the same as the CVD risk of a man 22 years older than himself who has an ideal risk profile.
Component 4: heart forecast given current risk profile
The next screen (not shown) forecasts the patient's 5-year CVD risk as he ages, assuming that his blood pressure, TC/HDL, smoking and diabetes status do not change from their current levels. This heart forecast is likely to be a conservative estimate, as blood pressure and some other CVD risk factors tend to worsen with age. The area between his heart forecast curve and the ideal curve also illustrates the increasing excess risk due to modifiable risk factors over time.
Component 5 (not shown)
This highlights the age at which current New Zealand guidelines recommend he should start drug treatment (aged 50 years in the example).
Component 6: ‘What if’ scenarios based on changes to modifiable risk factors.
In the final screen (figure 3), new forecasts (relative to current and ideal forecasts) are projected for the patient based on changes to his risk profile. The one shown in figure 3 illustrates his forecast (the green middle trajectory) if he was able to quit smoking. Other scenarios can be generated based on changes in SBP or TC/HDL or to demonstrate the risk associated with developing diabetes.
Conclusion
Commentators agree that there is no one correct way to communicate risk and that imparting information in multiple ways is likely to be of most value.13–16 We have built on the developments of others6 17 and translated several risk communication metrics (both previously described and novel) into a dynamic integrated set of measures. Your Heart Forecast was designed to be used during a patient–practitioner consultation as an intuitive graphical application that conveys several CVD risk communication messages individualised for each patient in a coherent story.
Strengths and limitations
The Heart Forecast is based on the 1991 Framingham CVD equation,9 as this is the equation currently recommended by New Zealand CVD risk guidelines. However, studies suggest that the risk prediction scores derived from Framingham have only modest accuracy.18–22 There are also increasing concerns about the validity of using Framingham-based scores among high-risk ethnic groups, those who are socio-economically deprived, people with diabetes or those patients who are already on treatment at the time of risk assessment. More recent equations have been published that include other predictive variables such as blood pressure therapy, social deprivation and family history.12 23 A strength of the Heart Forecast approach is that it is relatively easy to replace the current prediction equation with new or updated country-specific equations.
The approach we took to cardiovascular age will be less accurate than the Grover model but has the advantage of simplicity and is directly linked to current risk prediction charts. We also chose to compare a patient's risk to an ideal risk profile, rather than an average risk, as average age- and gender-specific CVD event rates in New Zealand are high by world standards. In 2004, New Zealand ranked 24th out of 27 OECD countries for age-standardised CHD mortality. We acknowledge that by choosing ideal risks, interventions would be recommended for almost everyone. However, the cardiovascular age is presented simultaneously with the short-term absolute risk, and the latter is used to determine whether a patient should take cardiovascular drugs. For the majority of patients, the heart forecast provides an opportunity and the relevant information to encourage lifestyle changes.
We display the 15% 5-year absolute CVD risk threshold recommended by New Zealand guidelines for initiating drug treatment. Given that risk prediction scores have only modest accuracy, and every estimate is associated with error, the use of a specific absolute CVD risk level is acknowledged as simplistic but practical. While most CVD guidelines have such treatment thresholds, they generally include an ‘out-clause,’ according to clinical judgement. In future, it may be more appropriate to provide a ‘risk zone’ in which lifestyle and behavioural changes along with single drugs are recommended at the lower end and multiple drugs at the upper end of the zone.
The Heart Forecast was initially sentinel-site-tested by over 100 primary care physicians and nurses in over 35 practices in New Zealand. It is now being used by over 1000. Feedback is very positive and suggests that the Heart Forecast is not dependent on a patient's health literacy skills and significantly supports CVD risk communication and shared decision-making. More formal testing of the effectiveness of the toolkit is required, but it is reassuring that user feedback is very positive and that other highly regarded investigators have been simultaneously and independently developing similar risk metrics.12 For example, Unilever International staff have worked closely with Framingham Heart Study investigators to develop a direct-to-consumer Heart Age Tool (http://wwwfiglorahearts.co.uk/Consumer/StarArticle.aspx?Path=Consumer/KnowYourHeart).
We believe that ‘Your Heart Forecast’ maintains the strengths of absolute and relative measures of CVD risk while addressing their main weaknesses. The Heart Forecast measures include both short-term absolute and relative risk components, adds the dimensions of ‘arterial age’ and risk in the long-term, shows how the arterial age is determined, and includes treatment thresholds and scenarios for lifestyle and modifiable risk factor changes. It could be easily modified for use in different populations using different risk algorithms, and we present the Heart Forecast to encourage widespread evaluation of its usefulness.
Appendix
Calculation for Framingham risk equation and NZGG-adjusted Framingham score
Since the early 1990s, New Zealand guidelines have used a CVD risk-prediction algorithm based on the Framingham Heart Study derived by Anderson et al.9 This equation predicts the risk of the following fatal and non-fatal CVD events: myocardial infarction, angina, coronary insufficiency, sudden and non-sudden coronary death, stroke (both ischaemic and haemorrhagic), transient ischaemic attack, peripheral vascular disease (claudication), congestive heart failure. The equation is applicable to patients aged 30–74 years and may be used for predicting CVD events from 4 to 12 years.
Step 1: Calculate μ
CVD prediction equation co-efficients (Anderson 1991)
The variables smoking and diabetes are set to 1 when present and 0 when absent. SBP is measured in mm Hg and age in complete years.
Step 2: Calculateσ ˆ
So
Step 3: Calculate u ˆ
Step 4: Calculate p
The 5-year predicted probability for CVD is then given by:
Step 5: NZ CVD risk guideline adjustment
A 5% CVD risk would then be added to the calculated Framingham score if a patient met any of the adjustment criteria:
family history of premature ischaemic CVD;
being of Māori, Pacific or Indian subcontinent ethnicity;
having diabetes and microalbuminuria;
having type 2 diabetes for 10 years or over;
having type 2 diabetes and HbA1c consistently greater than or equal to 8%;
having metabolic syndrome according to ATPIII criteria.
Classification
If the calculated (and adjusted) risk is less than 15% 5-year CVD risk but a patient has a blood pressure is consistently greater than 170/100 or total cholesterol greater than 8 mmol/l or TC/HDL ratio greater than 8, the person is classified at least at high risk (>15% 5-year absolute CVD risk).
Population ideal targets
Population ideal targets were taken from the Prospective Studies Collaboration who conducted metanalyses of 61 cohort studies investigating the association between SBP10 and cholesterol11 and vascular mortality incidence. Their SBP reference range was between 115 and 124 mm Hg, and centred at 120 mm Hg with the TC/HDL range between 3.5 and 4.5 and centred at 4.
References
Footnotes
Funding The development of the Heart Forecast into an electronic tool was funded by the National Heart Foundation of New Zealand and the University of Auckland. The Heart Forecast is a not-for-profit tool freely available to anyone to use via a web browser. The concepts may be copied and modified but not sold.
Competing interests SW and RJ have received funding from the Health Research Council of New Zealand and The Heart Foundation of New Zealand. SE has received a travel grant from the Pharmacy Guild. CW as an employee of Enigma Publishing Ltd received funding for the company from The Heart Foundation to provide software consulting, software development services, safety assurance of the developed product and collection and collation of end-user feedback.
Provenance and peer review Not commissioned; not externally peer reviewed.