Article Text

Abstract
BACKGROUND A study was undertaken to assess the importance of thunderstorms as a cause of epidemics of asthma exacerbations and to investigate the underlying mechanism.
METHODS A case control study was performed in six towns in south eastern Australia. Epidemic case days (n = 48) and a random sample of control days (n = 191) were identified by reference to the difference between the observed and expected number of emergency department attendances for asthma. The occurrence of thunderstorms, their associated outflows and cold fronts were ascertained, blind to case status, for each of these days. In addition, the relation of hourly pollen counts to automatic weather station data was examined in detail for the period around one severe epidemic of asthma exacerbations. The main outcome measure was the number of epidemics of asthma exacerbations.
RESULTS Thunderstorm outflows were detected on 33% of epidemic days and only 3% of control days (odds ratio 15.0, 95% confidence interval 6.0 to 37.6). The association was strongest in late spring and summer. Detailed examination of one severe epidemic showed that its onset coincided with the arrival of the thunderstorm outflow and a 4–12 fold increase in the ambient concentration of grass pollen grains.
CONCLUSIONS These findings are consistent with the hypothesis that some epidemics of exacerbations of asthma are caused by high concentrations of allergenic particles produced by an outflow of colder air, associated with the downdraught from a thunderstorm, sweeping up pollen grains and particles and then concentrating them in a shallow band of air at ground level. This is a common cause of exacerbations of asthma during the pollen season.
- asthma
- thunderstorms
- season
Statistics from Altmetric.com
Patients with asthma commonly report that symptoms are exacerbated with “changes” in weather but there has been surprisingly little investigation of this phenomenon. Usual day to day variation in meteorological characteristics such as temperature, humidity, and rainfall is thought to have only a minor impact on the severity of asthma.1-3
Although there have been several reports of localised epidemics of exacerbations of asthma in association with thunderstorms,4-11 for the most part these have been isolated, often dramatic, episodes easily recognised as epidemics by those who have experienced them. Asthma associated with thunderstorms has been thought to be a rare event, causing severe epidemics but not responsible for a substantial proportion of disease exacerbations overall. An examination of the occurrence of thunderstorms detected by a network that monitored atmospheric electrical activity within health service regional boundaries in England and Wales found that days with high sferic (or lightning) activity were associated with a 1.25 increased risk of asthma admissions7 and a 52.4 fold increased risk of asthma epidemics8 in the affected health region. However, this increased risk for epidemics was predominantly associated with rare severe lightning days, implying that thunderstorms did not explain a large proportion of the admissions for asthma.8
The timing of the thunderstorm related epidemics during the grass pollen season has implicated this allergen in the mechanism of thunderstorm associated attacks of asthma. Indeed, it has been shown that grass pollen grains rupture on exposure to moisture to produce numerous allergen-bearing starch granules which have aerodynamic properties favouring their entry into the lower respiratory tract.12 However, this observation has not explained the unique association with thunderstorms, as opposed to other rain events.
On the evening of 30 October 1997 there was a severe epidemic of exacerbations of asthma in association with a thunderstorm in Wagga Wagga (population 55 519), an inland town in south eastern Australia. During the evening and the following morning 215 asthmatic subjects attended the local emergency department, 41 of whom required admission to hospital. Our investigation of this episode confirmed that affected patients were almost all allergic to rye grass pollen.13This episode, and reports of similar episodes at this time of the year in this and other towns in south eastern Australia, prompted us to re-evaluate the importance of thunderstorms as a cause of epidemics of asthma exacerbations and to investigate further the underlying mechanism.
We hypothesised that thunderstorms and their associated outflows of colder air from the downdraught cause epidemics of asthma in their path by sweeping up pollen grains and particles and then concentrating them in the shallow band of air which constitutes the outflow (fig 1). Subjects allergic to grass pollen who are exposed to this outflow will inhale a high concentration of allergenic material that is capable of inducing a severe asthmatic reaction in the airways.14Such events may be an important cause of severe exacerbations of asthma.

Schematic representation depicting the mechanism by which thunderstorm outflows confine atmospheric particles in a narrow band of air near ground level. A vertical thunderstorm cross section is shown near the base and in the direction of storm motion (to the right). The downdraught and outflow are enclosed by the dashed lines. The shaded area near ground level represents starch granules released by rain drops from grass pollen grains at or near ground level which are then transported ahead of the rainfall by the outflow winds. The height of the head of the outflow is approximately 1 km.
The aim of this investigation was to establish the contribution of thunderstorm outflows to daily rates of hospital attendance for asthma in a region in which severe thunderstorm related epidemics have been reported. The relative importance of thunderstorms, their associated outflows, and cold fronts in predicting these events was also investigated.
Methods
The study was conducted in six inland rural towns on the tablelands or western slopes of the Great Dividing Range in south eastern Australia: Wagga Wagga (population 55 519), Tamworth (population 35 014), Orange (population 33 964), Bathurst (population 28 842), Dubbo (population 36 701), and Albury (population 41 795). A case control study design was implemented in which “case days” were epidemic days and “control days” were randomly sampled from the non-epidemic days over the same period.
IDENTIFICATION OF EPIDEMIC (CASE) AND NON-EPIDEMIC (CONTROL) DAYS
Data on emergency department attendances for asthma in the six towns for the period from January 1995 to December 1998 were obtained from a computerised database maintained by the New South Wales Department of Health. (The first date for Wagga Wagga was 2 July 1995 and the first date for Tamworth was 1 March 1995.) The median daily number of attendances for asthma ranged from zero in Bathurst to two in Wagga Wagga and Tamworth. For each of these towns the expected number of attendances on each day was estimated by fitting a log linear model allowing for autocorrelation and also for overdispersion using iteratively reweighted least squares. The model included terms controlling for linear, quadratic and cubic trends over time, seasonal factors (using four orders of sinusoidal terms), day of the week effects, and autocorrelation of residuals.15 ,16 The model was fitted in Stata (Stata Statistical Software Release 5.0, StataCorp, 1997) using the arpois routine.16 Days on which the observed number of attendances was greater than four standard deviations in excess of the expected number were considered epidemic days; a total of 48 days were identified as epidemic days. Control days were those in which the observed number of attendances was within one standard deviation of the expected number. A random sample of 191 of these control days (equal to four times the number of epidemic days) was selected.
IDENTIFICATION OF THUNDERSTORMS, THEIR ASSOCIATED OUTFLOWS, AND COLD FRONTS
A meteorologist (JC), who was blinded to the epidemic or control status of the days, examined data from thunderstorm observations, hourly or half-hourly automatic weather station (AWS) records, and synoptic charts for each of the selected days. AWSs are located 3–10 km outside the centre of each town. Days in which thunderstorms were reported within 80 km of the town were identified. The occurrence of a cold front or thunderstorm outflow was ascertained by identifying characteristic sudden increases in wind speed, pressure and relative humidity, decreases in temperature, and changes in wind direction in the AWS records. The differentiation between cold fronts and thunderstorm outflows was based on the duration of the changes and examination of the relevant isobaric chart. Days for which AWS data were missing for one hour or more were classified as missing with respect to the presence of thunderstorm outflows and fronts (except where these were identified at another time during the day).
DATA ANALYSIS
The occurrence of observed thunderstorms within 80 km and thunderstorm outflows identified by AWS data was examined graphically for each town for epidemic days and the randomly selected control days. The association of epidemics with observed thunderstorms, thunderstorm outflows, and cold fronts was assessed by contingency tables and tested by the χ2 statistic. The strength of the association was quantified as an odds ratio with 95% confidence interval.
POLLEN COUNTS
Pollen grains were collected using a Burkard seven day recording volumetric spore trap17 with a sucking rate of 10 l/min. The trap was located in a semi-rural setting at Charles Sturt University 6.7 km north/north west of the centre of Wagga Wagga, NSW, Australia and 15.8 km north west of the AWS near that town. The orifice of the trap was 3 m above the ground level. The sampling method used was that described by Odgen et al.18
For the analysis presented here the segment of the exposed tape corresponding to 30 October was isolated, embedded in silicone grease, and stained with a commercial pollen stain (Biopol Laboratory Inc, Spokane, WA, USA). Twenty four transverse strips were counted for every hour.19 The grass pollen grains were classified either as whole and intact grass pollen grains or as ruptured, spraying or empty pollen grains. The number of pollen grains was expressed as the average number per m3 air for each 1 hour period.
Results
METEOROLOGICAL PREDICTORS OF EPIDEMIC DAYS
The detection of thunderstorm outflows at the automatic weather stations in each town and reporting of thunderstorms within 80 km of the town were both associated with the occurrence of epidemics of asthma admissions in that town (table 1). However, the association with thunderstorm outflows was stronger and more specific, occurring on 33% of case days but only 3% of control days. This association was even stronger during late spring and summer (October to January inclusive). Twelve of 25 epidemic days (48%) during this period were associated with thunderstorm outflows compared with only four of 49 control days (8%). There were 14 occasions on which thunderstorms were observed within 80 km of the town but no thunderstorm outflows were detected at the town's AWS, four of which were on epidemic days (15%) and 10 on control days (7%, p = 0.13). There was no association between the occurrence of a cold front and asthma epidemics (table 1). The association between epidemics and thunderstorm outflows was similar when meteorological data for the selected day and the day preceding the selected day were evaluated. Taken together, these findings suggest that the outflows—rather than electrical activity, thunder, or rain alone—are responsible for the epidemic events.
Association between meteorological events and epidemic days
METEOROLOGICAL AND AEROBIOLOGICAL DESCRIPTION OF ONE EPIDEMIC
On 30 October 1997 in Wagga Wagga the AWS detected a thunderstorm outflow at 21.42 hours (fig 2). During the hour beginning 21.30 the concentration of airborne rye grass pollen grains increased fourfold compared with the previous hour or eightfold compared with the average over the preceding nine hours. The concentration of husks, representing grains which had ruptured and released their contents (fig 3), increased sevenfold at this time compared with the previous hour or 12 fold compared with the average over the preceding nine hours. This event coincided with the onset of an epidemic. The local ambulance service recorded the first emergency call for assistance in Wagga Wagga at 22.08 hours.
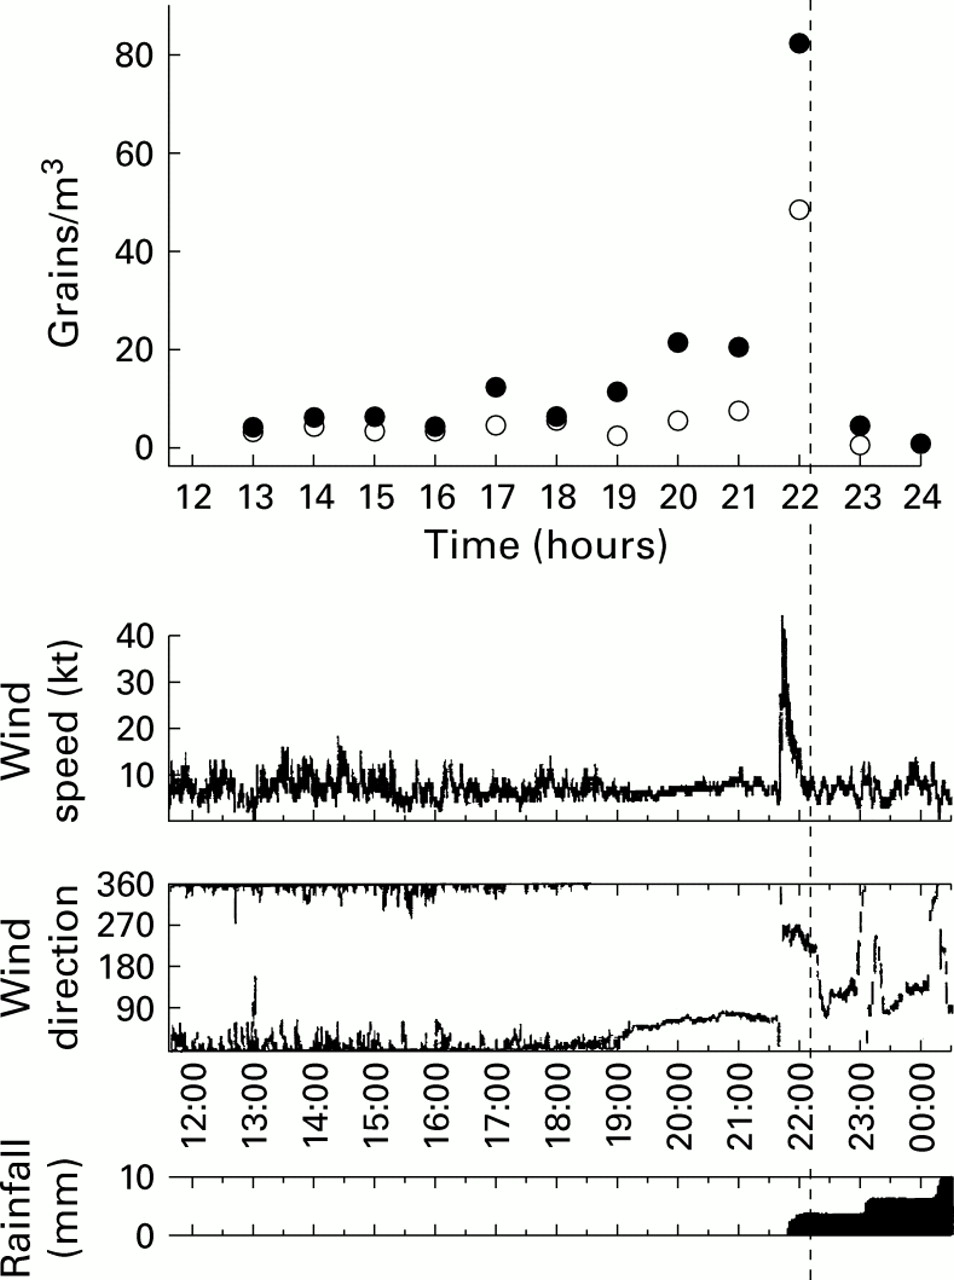
Chart showing the relation between airborne pollen concentrations and the arrival of the thunderstorm outflow in Wagga Wagga. Closed circles represent intact pollen grains, open circles represent empty pollen husks. The data are plotted at the mid point of the hour over which the concentrations have been measured. Data for wind speed, wind direction, and rainfall were recorded each minute by analogue chart recorder and have been scanned into the figure. The vertical dashed line represents the time at which the first ambulance call, seeking assistance for an attack of asthma, was received in Wagga Wagga. Examination of the recorded radar images (not shown) reveals that the line of the thunderstorms arrived at the site of the Burkard trap about 10 minutes before it reached the AWS.

Photomicrograph showing rye grass pollen grains. The grain in the centre is in the process of rupturing and releasing its starch granule contents.
Discussion
We have shown that, in a large region of the hinterland of south eastern Australia, the incidence of excess hospital attendances for asthma during late spring and summer is strongly linked to the occurrence of thunderstorm outflows. We have further demonstrated that, in one severe and well characterised event, the arrival of the thunderstorm outflow was accompanied by a large increase in the concentration of both intact and ruptured pollen grains in ambient air. This occurrence coincided with the onset of the epidemic.
This study used a robust and unbiased method to identify epidemic and non-epidemic days based on the difference between the observed number and the number expected on the basis of previous trends and cycles. Blinding of the meteorologist to the epidemiological data ensured that the classification of thunderstorms and related events was unbiased.
It seems likely that the outflow of cold air associated with a thunderstorm (as illustrated in fig 1), rather than electrical activity, thunder or rain alone, is responsible for the observed event. The occurrence of thunderstorms in the area around a town without a detectable outflow at the AWS adjacent to the town was not associated with a significantly increased risk of an epidemic, although it is acknowledged that the confidence interval around the estimate of association is broad. Furthermore, the observation of a sudden increase in the concentration of pollen particles with the arrival of the thunderstorm outflow on 30 October 1997 would be most consistent with sweeping up and concentration of particles by the outflow as we have hypothesised.
The evidence about thunderstorm related epidemics of asthma exacerbations can be summarised as follows. (1) The occurrence of epidemics is closely linked to thunderstorm outflows. (2) At least in this setting, the thunderstorm outflow related epidemics are limited to late spring and summer when there are high levels of airborne grass pollen.5 (3) People with grass pollen allergy are most likely to be affected.4 ,10 ,13 (4) At least in the case study reported here, there is a close temporal association between the arrival of the thunderstorm outflow, a major rise in the concentration of intact and ruptured pollen grains, and the onset of the epidemic. These findings support our hypothesis that thunderstorms trigger epidemics of exacerbations of asthma during the pollen season by sweeping allergenic particles up and concentrating them in a narrow band of air close to ground level. Subjects allergic to pollen who are in the path of the thunderstorm outflow are likely to inhale air which is heavily loaded with pollen allergen and, consequently, to experience an airway asthmatic response.
As there were few thunderstorms not accompanied by rainfall, we were unable to support or refute Knox's hypothesis12 for the mechanism by which pollen grains rupture to release particles of respirable size. It seems likely that rainfall and the outflow associated with thunderstorms both play a part in the genesis of thunderstorm related epidemics of asthma.
Our results suggest that thunderstorms and their associated outflows may be responsible for a greater proportion of epidemics of asthma exacerbations than previously recognised. A previous UK study,8 which also showed that thunderstorms were strong predictors of epidemics, found that only six of 38 epidemics (16%) occurred on high sferic days. In contrast we found that, overall, one third of epidemics were preceded by a thunderstorm outflow and, during late spring and summer, nearly half of the epidemics could be attributed to thunderstorm outflows.
Understanding the mechanism underlying thunderstorm associated epidemics of exacerbations of asthma and appreciating its importance as a cause for these epidemics raises the question of whether the events can be predicted. At present the main limitation on predicting these events is the low specificity of meteorological prediction of thunderstorms producing outflows. Between 1995 and 1998 thunderstorms were predicted on 350 days during October and November for the six towns included in this study; 337 of these were not associated with asthma epidemics and hence would have been false alarms. Thirteen of the 14 epidemics during these months were successfully hindcast. False alarms would be reduced if outflow producing thunderstorms could be forecast.
Acknowledgments
The authors acknowledge the advice of Aurelio Tobias, Geoffery Berry, and Wei Xuan on the log linear modelling, Kim Gilchrist for assistance in obtaining the data on hospital attendances, and Gilmore Centre, Charles Sturt University for financial assistance with pollen counts.