Operational implications of using 2006 World Health Organization growth standards in nutrition programmes: secondary data analysis
BMJ 2007; 334 doi: https://doi.org/10.1136/bmj.39101.664109.AE (Published 05 April 2007) Cite this as: BMJ 2007;334:733
- 1Centre for International Health and Development, Institute of Child Health, London WC1N 1EH
- 2College of Medicine, Blantyre, Malawi and Valid International, UK
- Correspondence to: A Seal a.seal{at}ich.ucl.ac.uk
- Accepted 3 January 2007
Abstract
Objective To assess the implications of adopting the World Health Organization 2006 growth standards in combination with current diagnostic criteria in emergency and non-emergency child feeding programmes.
Design Secondary analysis of data from three standardised nutrition surveys (n=2555) for prevalence of acute malnutrition, using weight for height z score (<−2 and <−3) and percentage of the median (<80% and <70%) cut-offs for moderate and severe acute malnutrition from the National Center for Health Statistics/WHO growth reference (NCHS reference) and the new WHO 2006 growth standards (WHO standards).
Setting Refugee camps in Algeria, Kenya, and Bangladesh.
Population Children aged 6-59 months.
Results Important differences exist in the weight for height cut-offs used for defining acute malnutrition obtained from the WHO standards and NCHS reference data. These vary according to a child's height and according to whether z score or percentage of the median cut-offs are used. If applied and used according to current practice in nutrition programmes, the WHO standards will result in a higher measured prevalence of severe acute malnutrition during surveys but, paradoxically, a decrease in the admission of children to emergency feeding programmes and earlier discharge of recovering patients. The expected impact on case fatality rates of applying the new standards in conjunction with current diagnostic criteria is unknown.
Conclusions A full assessment of the appropriate use of the new WHO standards in the diagnosis of acute malnutrition is urgently needed. This should be completed before the standards are adopted by organisations that run nutrition programmes targeting acute malnutrition.
Introduction
Globally, malnutrition continues to affect many populations, with adverse effects on health, mortality, and productivity. Malnutrition is a potentiating factor in about half of the 10 million deaths among children under 5 each year, and improved nutrition is considered essential to the achievement of the millennium development goals.1 2 According to the United Nations World Food Programme, the number of nutritional emergencies has risen over the past two decades from an average of 15 a year during the 1980s to more than 30 a year since the turn of the millennium. The number of people supplied with food aid during 2005 totalled 73.1 million.3
The World Health Organization's child growth standards (referred to here as the WHO standards) are based on data from a multicentre international study and reflect how children grow under optimal conditions. As such, they are designed as a standard rather than just a reference and can be used for individual diagnoses and international comparisons.4 5 The standards were released in April 2006, and WHO is advocating their adoption as a replacement for the currently used international growth reference, produced by the National Center for Health Statistics, Center for Disease Control and Prevention, and WHO in 1978 (referred to here as the NCHS reference).6 Many unanswered questions remain, however, relating to the practical implementation and monitoring of nutrition programmes with the new WHO standards, including their use in emergency assessment and response.
The prevalences of global acute malnutrition and severe acute malnutrition are key indicators calculated from the weight for height index of a sample of children. They are used to monitor high risk or food insecure situations and, when certain criteria are met, to trigger alerts and leverage resources for interventions.7 These may include emergency feeding or other public health or livelihood programmes. A prevalence of global acute malnutrition of more than 10% is taken as indicating a serious situation.8
Nutritional status can be expressed by using either the z scores method or the percentage of the median method. Z scores correspond to standard deviations from the mean value—for example, a weight for height z score of −2 corresponds to a weight two standard deviations smaller than the mean, and a z score of 1 corresponds to a weight one standard deviation larger than the mean. Percentages of the median values are simply the percentages of the reference or standard median or mean that the measurement comprises.
Global acute malnutrition includes all cases with a weight for height index below a z score of −2 or 80% of the median, plus cases with oedema, whereas severe acute malnutrition includes those cases with a weight for height index below a z score of −3 or 70% of the median, plus cases with oedema. Whereas z score cut-offs are routinely used to assess the need for an intervention, admissions to and discharges from feeding programmes are often based on the more easily calculated percentage of the median cut-offs. The detailed planning for interventions therefore tends to be done with the expected number of admissions based on the percentage of the median indicator, in conjunction with estimates of the total population of children in the affected area. Where selective feeding programmes for children are implemented, they are generally divided into therapeutic feeding programmes for cases with severe acute malnutrition and supplementary feeding programmes for children who have moderate acute malnutrition (defined as those children without oedema but weight for height between −2 and −3 z scores or between 80% and 70% of the median).
The introduction of the WHO 2006 growth standards has been accompanied by the release of software that allows for the calculation of the prevalence of malnutrition by using z scores with both the WHO 2006 growth standards and the NCHS reference data.9 However, WHO has not released either sex combined growth standards or tables based on percentage of the median, both of which have been widely used tools in running nutrition programmes in the past.
In this paper, we use z score cut-offs and calculated percentage of the median cut-offs to compare retrospectively the prevalence of malnutrition obtained in nutritional assessments in three refugee food aid operations. We compare differences in the prevalence of total wasting and severe wasting and calculate the potential impact on the numbers of children treated in selective feeding programmes. Finally, we discuss the challenges that exist for adoption of the WHO standards in nutrition programmes.
Methods
The anthropometric cut-offs we compare in this paper were derived from weight for height indices published in the NCHS reference and the WHO standards datasets.10 11 We used the two methods commonly used for describing the anthropometric status of children—z scores (the number of standard deviations a child is from the average) and the percentage of the median—for the comparisons.
For the NCHS reference, we tabulated the standard cut-offs for total wasting (<−2 z scores and <80% of the median) and severe wasting (<−3 z scores and <70% of the median) from published tables by using the weight for length index for lengths of 49.0-84.5 cm and the weight for height index for heights of 85.0-110.0 cm.10 For the WHO standards, we tabulated the same z score cut-offs for total wasting and severe wasting from the weight for length index for lengths below 87.0 cm and from the weight for height index for heights of 87.0 and above, as recommended by WHO.11 We also calculated and tabulated the <70% and <80% cut-off points by using the published intervals of 0.5 cm for the length and height range 49.0 to 110.0 cm. We chose this range for comparison because 49.0 cm is the lowest length included in the NCHS reference weight for height index, and 110.0 cm is the proxy height used for defining the upper inclusion age (59 months) in surveys of nutrition in children. We used Microsoft Excel 2003 to compare the cut-offs graphically.
We analysed data from three previously reported nutrition surveys in refugee camps in Africa and Asia.12 13 14 We filtered records to remove any cases with oedema. We did this because children with bipedal pitting oedema are classified as having severe acute malnutrition independently of their weight for height measurements, and malnutrition prevalence results calculated with the available software for the WHO growth standards (WHO Anthro 2005) fail to distinguish between children with wasting and those with oedema. Looking only at malnutrition due to wasting therefore allowed a clearer comparison of the performance of the four diagnostic criteria assessed.
We used WHO Anthro 2005 software to calculate the prevalences and 95% confidence intervals of global acute malnutrition and severe acute malnutrition, using both the NCHS reference and WHO standard z score cut-offs. We calculated the variable for age in months from the birth date but left the type of measurement variable (height or length) blank. This avoided measurement and age dependent height adjustments that are automatically implemented by WHO Anthro software in analyses using the WHO standards but not in analyses using the NCHS reference. We calculated the prevalence of malnutrition for percentage of the median cut-offs with EpiInfo 6.04d or a database and VLOOKUP formula constructed in Microsoft Excel 2003. We calculated 95% confidence intervals for these estimates by using CSample for the NCHS reference and by using EpiTable (Epi Info 6) and assuming a design effect of 2 for the WHO standards. The design effect for the surveys analysed here reflects the loss of precision due to the use of cluster sampling instead of simple random sampling. The design effect for a child anthropometric survey using 30 clusters of 30 households is routinely assumed to be 2.7
We used Newcombe's test of paired differences to compare differences in the proportion of children eligible for selective feeding.15 Contemporary total population figures for the refugee camps came from registration data from the United Nations High Commissioner for Refugees, and we estimated the population of 6-59 month old children by assuming that it comprised 15% of the total.7 We estimated the number of children eligible for admission to selective feeding by multiplying the 6-59 month population by the measured prevalence of global acute malnutrition.
Results
Marked, height dependent differences exist in the weight for height cut-offs used for defining severe acute malnutrition obtained from the WHO growth standards and NCHS reference data. The graphs presented here illustrate the differences between various diagnostic cut-offs. The observed differences are relatively large when we compare the z score cut-offs but smaller when we compare the percentage of the median cut-offs. Sex did not affect the overall pattern or magnitude of the differences, and, for the sake of brevity, we display results for boys only.
Z score cut-offs
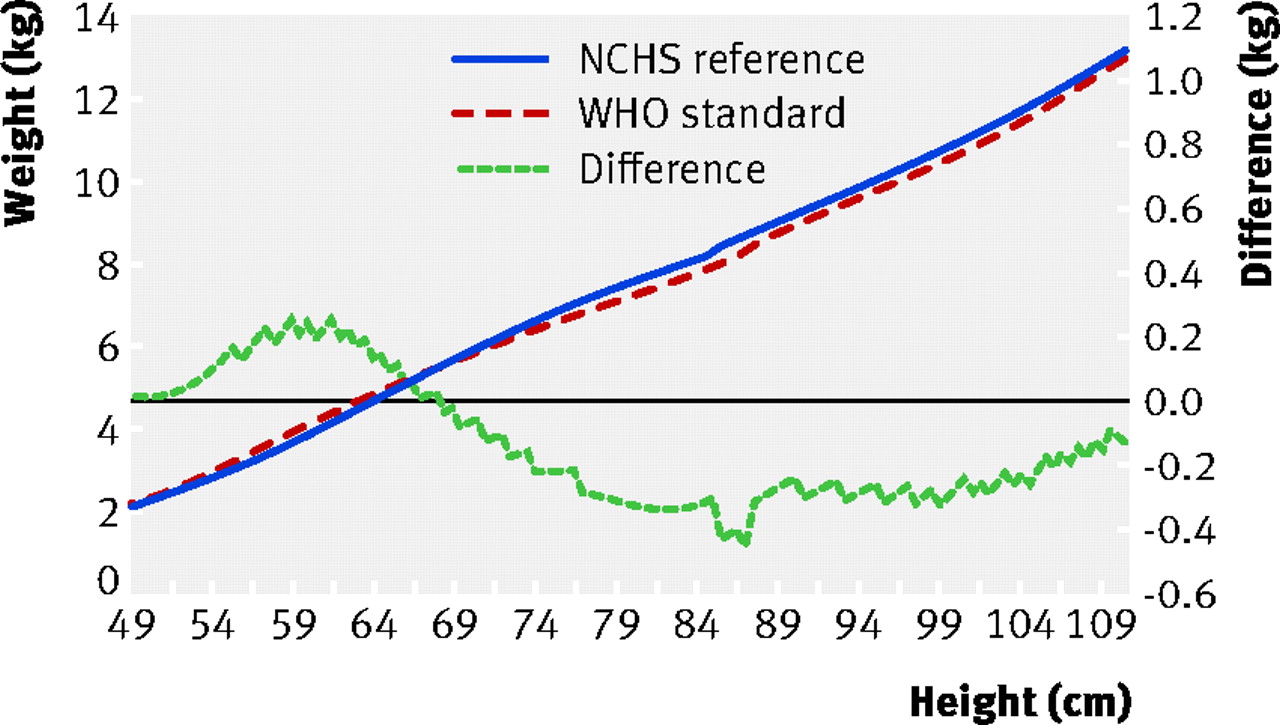
When we apply the severe acute malnutrition weight for height cut-off of <−3 z scores (fig 1⇓), the largest differences between the cut-offs are seen in infants with lengths of around 60 cm, where the difference is more than 1 kg, and in children above 100 cm, where the difference is up to 0.6 kg. However, in children of lengths between 78.0 and 84.5 cm, the difference in cut-offs becomes negative by up to −0.2 kg. Across the length and height range corresponding to the WHO standard median heights for 6-59 months (67.6-109.4 cm), we see an overall increase in the weight for height cut-off for severe acute malnutrition, implying that children will have a higher probability of being diagnosed as having severe malnutrition with the new WHO standards. The significance of this length/height range is that it comprises the inclusion criteria for standard nutritional surveys.

Fig 1 Comparison of weight for height −3 z score cut-offs for diagnosing acute malnutrition in boys
When we apply the z score cut-off of <−2 for global acute malnutrition, we see a similar pattern but with a smaller magnitude of difference between the NCHS reference and WHO standards (fig 2⇓). These results show that the height profile of the surveyed population is critical in influencing both the magnitude and direction of change in the prevalence of global acute malnutrition.

Fig 2 Comparison of weight for height −2 z score cut-offs for diagnosing acute malnutrition in boys
Percentage of median cut-offs
In contrast to the effect seen with z score cut-offs, with application of the weight for height <70% of the median cut-off with the WHO standards we see a decrease in the diagnostic cut-off weight for severe acute malnutrition for children over 67.5 cm (fig 3⇓). This means that children who are assessed with percentage of the median will be less likely to be diagnosed as having severe acute malnutrition if the new WHO standards are used instead of the NCHS reference. Although the diagnostic cut-off for infants under 67.5 cm is increased, admissions from this group are relatively rare.

Fig 3 Comparison of weight for height 70% of the median cut-offs for diagnosing acute malnutrition in boys
When we apply the percentage of the median cut-off for moderate acute malnutrition (<80% of the median) we see a similar pattern (fig 4⇓), with a decrease in the probability of a positive diagnosis. Critically, as a thin child is less likely to be classified as malnourished, application of percentage of the median cut-offs in conjunction with the WHO standards is likely lead to a reduction in admissions to feeding programmes and earlier discharge of recovering patients.

Fig 4 Comparison of weight for height 80% of the median cut-offs for diagnosing acute malnutrition in boys
Retrospective data analysis
The public health impact of applying the new WHO standards data in any nutritional assessment or programme will be strongly affected by the age profile and weight and height attributes of the population, as well as by the prevalence of oedema. Some populations may contain many children on the diagnostic “borderline” and see large changes in the diagnosed prevalence of malnutrition, whereas for other populations relatively little change may be seen. Generalising about the expected differences in the prevalence of acute malnutrition detected by using the WHO standards compared with the NCHS reference, and the impact on admissions and discharge from selective feeding programmes, is therefore difficult.
To investigate what the impact of the use of WHO standards might be if they are operationally adopted, we used the WHO standard and NCHS reference data to retrospectively analyse data from three standardised nutrition surveys in stable refugee populations with moderate to high levels of global acute malnutrition. Table 1⇓ compares the results from these case studies, showing, as expected, small differences in the prevalence of global acute malnutrition but relatively large differences in the prevalence of severe acute malnutrition, which is 1.7 to 4.2 times higher when assessed with the WHO standards.
Changes in the percentage prevalence (95% confidence interval) of acute malnutrition assessed by weight for height z scores
Table 2⇓ shows the impact on children's eligibility for selective feeding programmes assessed with weight for height percentage of the median cut-offs. Clearly, if percentage of the median cut-offs based on the WHO standard had been applied in these operations they would have led to a substantial reduction (32-52%) in the proportion of children eligible for therapeutic and supplementary nutritional support. For example, on the basis of the registered camp population in Kenya the number of eligible children would have been reduced from 891 to 424; in the Algerian camp the number would be reduced from 1472 to 1003.
Changes in the percentage (95% confidence interval) of children eligible for selective feeding assessed by weight for height percentage of median
Discussion
We have described the differences in the cut-offs for acute malnutrition between the NCHS reference and WHO standard datasets. If WHO standards are adopted in nutrition programmes without critical review and careful consideration of consequences, several potentially serious implications are likely.
Firstly, making interpretations of the seriousness of a nutritional crisis and the need for a response will be difficult where comparable trend data are not available. Decisions should remain rooted in an understanding of seasonal, regional, and annual variations in the prevalence of malnutrition, and these are only realistically possible with data generated by the continued or parallel use of the NCHS reference.16 Given time, comparable trend data could be generated if a dual analysis approach is adopted. Data on the relative risk of mortality associated with cut-offs based on the new WHO standards are not currently available, and established risk models will need to be recalibrated using these data.
Secondly, overall estimates of the prevalence of global acute malnutrition, and particularly of severe acute malnutrition, obtained from surveys analysed with the WHO standards are likely to be higher than estimates obtained with the NCHS reference cut-offs. This raises the potential for the misdirection of resources between emergency situations if data generated using different diagnostic criteria start to be reported to governments and donors.
Possible implications for clinical admissions
The third potential problem concerns the admission of children to selective feeding programmes. If the WHO standards are introduced and used according to current practice, although the prevalence of acute malnutrition measured by surveys will be higher, admissions to selective feeding (therapeutic and supplementary) programmes will, if still done on the basis of percentage of the median, be lower than at present. A subgroup of children admitted under current admission criteria would not be admitted in the future, and those admitted would be discharged sooner than at present. Whether this would result in increased mortality in this population subgroup is unknown.
One option that operational agencies might choose is to switch admission criteria for feeding programmes from the NCHS reference percentage of the median to the WHO standard z score cut-offs. The figures presented in tables 1⇑ and 2⇑ show that, under this scenario, the number of children eligible for selective feeding may increase overall by 1.5 to 2.1 (<80% of the NCHS reference median v <−2 z scores of the WHO standard). The biggest proportionate changes are likely to be seen in the numbers eligible for therapeutic feeding. These estimates need to be confirmed by studying other datasets, but they do raise serious questions about the capacity of established programmes to cope with increased patient load and about the resourcing of new relief operations.
The fourth area of concern is the divergence between measurements reported using the z score and percentage of the median methods. Although this problem has existed for some years with the NCHS reference, if the WHO standards were used to calculate both z scores and percentage of the median indices a greater divergence would exist in the estimates of malnutrition. If these data were used for assessment and planning, the gap between needs assessment (routinely done with z scores) and admissions to feeding programmes (routinely done with percentage of the median) would increase. This increased mismatch would be likely to have a detrimental effect on the planning of programmes, allocation of resources, and effectiveness of interventions.
Opportunity for harmonisation
The introduction of the WHO standards presents an opportunity for the harmonisation of indicators used in prevalence surveys and admissions to and discharges from nutrition programmes. However, the harmonisation of these indicators will need planning, training, and resources. To complicate matters further, published data are lacking on whether field staff in emergencies will have the capacity to use z scores effectively and safely.
An associated problem with the use of the WHO standards is the release of software (WHO Anthro 2005) for the analysis of anthropometric data from individuals and surveys. Although otherwise an excellent software tool, the program fails to separate cases with oedema and account for them as a separate category of severe malnutrition in its summary statistics. If not explicitly recognised by the user, this may have the effect of falsely reducing the reported prevalence of nutritional oedema. Modification of the software, to ensure its consistency with standardised reporting formats, is a prerequisite for efficient analysis of surveys with the WHO standards.
In any interim transition period using a dual analysis system, potential problems will arise if communication efforts are not strengthened to ensure that decision makers are presented with consistent and comparable data. The potential for confusion and misuse exists, thereby risking a reduction in operational effectiveness and equity. Where percentage of the median and z score results are reported, decision makers may now be presented with four different estimates of prevalence to deal with. As the history of the kcal and kJ energy units illustrates well, the international nutrition world is sometimes slow to adapt to change and some changes may be never fully implemented. An intensified effort is needed if this track record is not to be repeated with the introduction of the WHO standards.
Conclusion
The practical implications of adopting the WHO standards need to be thoroughly assessed before operational agencies start to implement programmes that use their weight for height cut-offs. If adoption of the WHO standards in nutrition programmes is to proceed, it should not be piecemeal and haphazard. Implementation needs to be coordinated, and we propose that a body comprising major UN and non-governmental implementing agencies should be rapidly established to coordinate the response to this operational challenge.
What is already known on this topic
The 1978 NCHS/WHO child growth reference curves are widely used but have some important limitations in their applicability to all populations
New 2006 WHO growth standards were designed to be a global standard, reflecting optimal growth, nutrition, and development for all children in all countries
What this study adds
Surveys that use the new WHO standards and a <−3 z score weight for height cut-off will markedly increase the number of children identified as having severe acute malnutrition
The new standards may lead to a significant reduction in children admitted to feeding programmes, as usual practice is to use a <70% of the median weight for height cut-off for admissions
Footnotes
Copies of references 12-14 can be requested by email from the corresponding author.
Contributors: Both authors contributed to the data analysis and preparation of the manuscript. AS is the guarantor.
Funding: None.
Competing interests: None declared.
Ethical approval: Not needed.