
- Anderson E Stanciole, economist1,
- Mónica Ortegón, researcher2,
- Dan Chisholm, health economist3,
- Jeremy A Lauer, economist3
- 1Health, Nutrition and Population, World Bank, Washington DC, USA
- 2Medical and Health Sciences School, Universidad del Rosario, Bogota, Colombia
- 3Department of Health Systems Financing, World Health Organization, Geneva, Switzerland
- Correspondence to: A E Stanciole astanciole{at}worldbank.org
- Accepted 26 October 2011
Abstract
Objectives To determine the population level costs, effects, and cost effectiveness of selected, individual based interventions to combat chronic obstructive pulmonary disease (COPD) and asthma in the context of low and middle income countries.
Design Sectoral cost effectiveness analysis using a lifetime population model.
Setting Two World Health Organization sub-regions of the world: countries in sub-Saharan Africa with very high adult and high child mortality (AfrE); and countries in South East Asia with high adult and high child mortality (SearD).
Data sources Disease rates and profiles were taken from the WHO Global Burden of Disease study; estimates of intervention effects and resource needs were drawn from clinical trials, observational studies, and treatment guidelines. Unit costs were taken from a WHO price database.
Main outcome measures Cost per disability adjusted life year (DALY) averted, expressed in international dollars ($Int) for the year 2005.
Results In both regions low dose inhaled corticosteroids for mild persistent asthma was considered the most cost effective intervention, with average cost per DALY averted about $Int2500. The next best value strategies were influenza vaccine for COPD in Sear-D (incremental cost $Int4950 per DALY averted) and low dose inhaled corticosteroids plus long acting β agonists for moderate persistent asthma in Afr-E (incremental cost $Int9112 per DALY averted).
Conclusions COPD is irreversible and progressive, and current treatment options produce relatively little gains relative to the cost. The treatment options available for asthma, however, generally decrease chronic respiratory disease burden at a relatively low cost.
Introduction
Chronic respiratory diseases represent a major disease burden, with chronic obstructive respiratory disease (COPD) and asthma estimated to affect 64 million and 235 million people worldwide, respectively.1 In the latest estimates, COPD was the fourth leading cause of death in 2004, causing around three million deaths or 5.1% of all deaths in the world, and in 2030 it is projected to become the third leading cause, with 5.8 million or 8.6% of total deaths.1 Asthma morbidity and mortality account for around 1% of all disability adjusted life years (DALYs), equivalent to 16 million DALYs lost per year worldwide.1
Much of the projected increase in COPD prevalence and mortality is closely associated with increases in tobacco smoking and exposure to indoor smoke from solid fuel for cooking and heating, as well as changing demographics in many countries.2 3 4 For asthma, the two main environmental risk factors are allergens and viral infections. Environmental risk factors associated with COPD are likely to disproportionately affect low and middle income countries, especially in Africa and Asia, which currently account for almost 90% of COPD deaths worldwide.5 6 7 8 According to the Global Burden of Disease study,9 the East Asia and Pacific region, primarily China, is the most affected in global terms, with 50% of the global annual mortality from COPD occurring there. The projected increase in the world’s urban population from 45% to 59% by 202510 will likely lead to increased prevalence of chronic respiratory diseases worldwide, since urbanisation and adoption of Western lifestyle are major explanatory factors for increased asthma rates.
A number of treatments are available for both conditions that can help control the symptoms and slow disease progression. Current information on the cost effectiveness of interventions, however, is limited to randomised trials results conducted in developed countries. No information is available on the health effects and costs of interventions at a population level in developing regions of the world. Accordingly, the aim of this paper is to provide evidence on the most cost effective individual based interventions for COPD and asthma management in developing regions. Population based preventive interventions, which include tobacco control policies and strategies to improve indoor air quality in households, are covered in other disease models (for smoking and indoor air, respectively).11 12
Methods
The WHO-CHOICE modelling framework13 14 was used to carry out a generalised cost effectiveness analysis using estimates of total costs and effects of asthma and COPD interventions (see general appendix on bmj.com). This paper reports the results for two WHO epidemiological sub-regions, one in Africa (countries with high child and very high adult mortality, henceforth denoted “AfrE”), and the other in South East Asia (countries with high child and adult mortality, henceforth denoted “SearD”).
Characterisation of interventions
Interventions included in this analysis were those directed at the treatment of established disease (see appendix on bmj.com for details).
Chronic obstructive pulmonary disease (COPD)
According to the spirometric classification of severity adopted by the Global Initiative for Chronic Obstructive Lung Disease (GOLD),15 COPD is characterised by airflow limitation, with a ratio of lung function levels of forced expiratory volume in one second (FEV1) to forced vital capacity (FVC) <70% and a post-bronchodilator FEV1 of <80% of the predicted value. Additional symptoms such as cough, sputum production, shortness of breath, and fatigue can be observed but are not always present, especially in the initial stages of the disease. For determining the impact of treating people with COPD at various stages of progression, we used four different stages of disease (I (mild), II (moderate), III (severe), and IV (very severe)). The distribution of cases across these four stages (as well as the prevalence of smoking among diagnosed cases) were based on surveys undertaken in different parts of the world, including the BOLD and PLATINO studies.16 17
Treatment strategies for COPD followed the GOLD guidelines, which include the treatment of exacerbations as well as their prevention through influenza vaccine and smoking cessation.15 For interventions focused on the management of exacerbations, data on the average number and duration of exacerbations for the different disease stages were used to determine eligibility for treatment.18 Although coverage of these preventive and management strategies in the two sub-regional populations considered here is currently low, all interventions were assessed at the relatively high coverage rate of 80% because of their inherent feasibility (such as inhalers) or the severity of the underlying condition (such as COPD stage III or IV).
Asthma
Interventions for the long term management of asthma, which is based primarily on drug treatment, were selected on the basis of recommendations in current clinical practice guidelines.19 20 21 22 Treatment aims to achieve and maintain control, since there is good evidence that the clinical manifestations of the disease can be controlled and progression of the disease can be altered with appropriate treatment. This management approach uses bronchodilators, long acting β agonists, corticosteroids, and leukotriene receptor agonists. These treatment options are organised by “steps” of increasing disease severity and treatment intensity (doses and number of drugs), which are adjusted in a continuous cycle: intermittent (step 1), mild (step 2), moderate (step 3 or 4), and severe (step 5 or 6). In this stepwise approach, which advises stepping down of treatment when control is maintained for at least three months, interventions were modelled to be given for a period of four months (subsequently adjusted to a one year life cycle to conform with WHO-CHOICE standard cycle length).
The proportion of patients in each category was derived from epidemiological cross sectional studies.23 24 As defined by the Global Initiative for Asthma (GINA) guidelines,21 estimates of the proportion of the total population targeted by interventions were based on studies that reported how many patients maintained total control at each treatment step.24 25 26 Since no such reports were found for inhaled corticosteroids and leukotriene receptor agonists, the relative risk of asthma exacerbations when comparing inhaled corticosteroids with long acting β agonists (relative risk 0.8327) was used as a proxy to determine the proportion of patients maintaining control.
All interventions were assessed at a coverage level of 80%, reflecting the wide availability of key drugs for asthma control in low income resource settings (such as the β agonist salbutamol; other drugs, however, such as beclometasone, are less widely available).28
We did not include the treatment of acute asthma exacerbations because of the endpoint definition used in the model (total asthma control achievement, implying no exacerbations) and the lack of information on both quality of life improvements in under-controlled patients (including those presenting with exacerbations) and the frequency of asthma exacerbations by severity category.
Estimation and modelling of intervention effectiveness
Disease progression and population health effects of interventions were estimated using the multistate population model PopMod (see general appendix on bmj.com). Regional populations were categorised into two live health states—those with the disease (state X, either asthma or COPD) and those susceptible to but without the disease (state S)—and one state where individuals are assumed to have died (dead state, D). We did not take into account the comorbidity of asthma plus COPD, which is a common clinical feature of chronic respiratory diseases among elderly people. Starting from the healthy (susceptible) state, individuals born into the population or moving through its age span can either develop chronic respiratory diseases or die, according to the estimated incidence of chronic respiratory diseases and background mortality. The model divides the population into males and females with age groups of one year span (truncated at 100 years of age). The health effects of implementing different interventions during a 10 year period are simulated over the maximum lifetime horizon of the population, which is fixed at 100 years. Improvements in health due to intervention were compared with the disease burden in the absence of all treatment. This counterfactual null scenario was derived by back calculating the effect of interventions at current levels of coverage. Accordingly, intervention effectiveness is defined as the difference between the disability adjusted life years (DALYs) averted under the intervention versus the counterfactual scenario in which no interventions take place. In accord with standard Global Burden of Disease methodology, DALYs averted were age weighted and discounted (at 3%).
Values for disease incidence, prevalence, case fatality, and background mortality were obtained from the Global Burden of Disease study estimates.1 29 Table 1⇓ summarises the main epidemiological parameters used in the analysis. In regions lacking accurate prevalence data based on spirometric screening, disease occurrence was inferred from regional COPD mortality, making use of the constraints imposed by the consistent epidemiological relationships among prevalence, incidence, remission, case fatality, and mortality.30 The relative risk of COPD mortality across sub-regions was estimated as a function of the two leading risk factors—tobacco smoking and indoor air pollution from solid fuel used for cooking.9
Main epidemiological parameters used in analysis of asthma and chronic obstructive pulmonary disease (COPD) in WHO sub-Saharan African sub-region AfrE and South East Asian sub-region SearD by sex and age
In addition to mortality, the model also uses disability weights to assess the morbidity component of DALYs. In line with earlier Global Burden of Disease estimation,29 findings from the Dutch disability weight study were used (on a scale 0–1, where 0 denotes no disability).31 For COPD, disability weights were 0.17 for mild or moderate COPD and 0.53 for severe COPD. For asthma, the weights were 0.03 for intermittent and mild persistent asthma, 0.23 for moderate persistent asthma, and 0.36 for severe persistent asthma. We obtained a weighted average for the disease state by multiplying the distribution of cases by their respective disability weights.31 32 33
COPD is considered an irreversible condition,21 and we accordingly set remission to zero; those who develop the disease face an increased rate of mortality and disability, so treatment effects were modelled through these two parameters (see table 2⇓). Given that no substantive report exists on the effect of treatment on mortality from asthma, we evaluated the relative effectiveness of interventions with respect to their effect on morbidity, specifically by averting asthma associated disability (taking control of asthma as the primary end point).
Treatment effect size estimates and impact on disability weights for chronic obstructive pulmonary disease (COPD) and asthma in WHO sub-Saharan African sub-region AfrE and South East Asian sub-region SearD
In order to estimate changes in disability weight, we used an effect size approach. The effect size is a way of quantifying the effectiveness of a particular intervention relative to some comparison.34 35 It can be measured as the standardised difference between two means. We used it to measure the difference between the mean quality of life attained with the intervention compared with placebo. Hedge’s correction formula was then used to correct for sample bias in the studies selected as sources for the effect size of interventions.
The effect size is then multiplied by a conversion factor to translate this effectiveness into a reduction in disability weight. The conversion factor provides the average change in disability weight with one standard deviation difference in asthma symptoms and functionality (that is, an effect size of 1). The conversion factor for asthma was estimated from three studies in which changes in symptoms, functionality, and use of healthcare resources in response to various interventions were measured in the same group of patients.33 The resulting conversion factor of 0.13 was multiplied by the effect sizes of interventions to reflect the reduction in disability weights (table 2⇑). In order to ensure consistency, we limited the criteria for the literature search on the effectiveness of interventions to randomised clinical trials that measured quality of life according to the asthma quality of life questionnaire (AQLQ) and reported means and standard deviations of mean differences of the comparators.
Estimation and modelling of intervention costs
Cost calculations used a standard ingredients approach with the specification of quantities and unit prices of cost components. Resource quantity estimates for a given level of effectiveness were derived from published studies, where available, and supplemented by WHO treatment guidelines and expert opinion.
For asthma treatment, primary care visits included costs for an initial visit and two follow-up visits. These quantities followed guidelines recommendations, in which the first follow-up visit is scheduled a month after starting therapy to assess the benefits of treatment and the second follow-up visit is scheduled at the end of the fourth month of therapy, when full benefit of treatment and disease control are assessed and it is decided whether to step down treatment. Details for each intervention are provided in the appendix on bmj.com.
COPD interventions considered in this study included patient costs (those incurred at the point of delivery) and programme costs (those associated with the development and administration of the intervention and incurred at administrative levels outside the point of delivery). In addition, the smoking cessation intervention also included training costs to account for the provision of group therapy sessions. Details of resource use for each intervention are provided in the appendix on bmj.com.
Unit input prices were obtained from the WHO-CHOICE 2005 database. The price of traded goods was based on international competitive prices (International Drug Price Indicator Guide http://erc.msh.org) and the drug price lists from the governments of New Zealand (www.pharmac.govt.nz) and Australia (www.pbs.gov.au), plus a mark-up for transportation costs. The prices of goods and services available locally (human resources, health centre visits, etc) were based on cross country regressions allowing for capacity adjustment.36 37 Costs for the 10 year implementation period were discounted at 3% and expressed in international dollars ($Int), which adjust for differences in the relative price and purchasing power of countries and thereby facilitate comparison across regions (that is, $Int1 buys the same quantity of healthcare resources in Kenya or India as it does in the United States). For the African and Asian sub-regions used in this analysis, $Int1 is worth US$0.44 and US$0.32, respectively.
Uncertainty analysis
Estimating cost effectiveness is inherently uncertain. For instance, the effect size of interventions as observed in clinical trials does not necessarily represent the effect size when the same treatment is implemented in daily patient care. To address this, we plot results on a double logarithmic scale, so as to ascertain order of magnitude differences (such as $Int10–100 v $Int100–1000 per DALY averted). Second, we classify results according to defined cost effectiveness thresholds: WHO-CHOICE considers an intervention yielding a healthy year of life for less than three times gross domestic product (GDP) per capita as “cost effective” and an intervention yielding a healthy year of life for less than one times GDP per capita as “very cost effective.” In the sub-regions considered here, an intervention yielding a DALY for <$Int2000 is considered highly cost effective. Interventions yielding a DALY at a cost greater than three times GDP per capita (that is, >$Int6000) are considered “not cost effective,” whereas those with a cost effectiveness ratio falling between $Int2000 and $Int6000 are considered “cost effective” in these sub-regions.25. Finally, for the subset of interventions that are not dominated and therefore fall on the cost effectiveness frontier, we undertook a probabilistic uncertainty analysis using Monte Carlo methods to assess the robustness of the results to potential changes in key assumptions regarding the model parameters. We also assessed the impact of removing age weights or discounting on baseline results via one way sensitivity analysis.
Results
Table 3⇓ shows the main results of the analysis, including DALYs averted, costs, average cost effectiveness ratio, and incremental cost effectiveness for all interventions in both the sub-Saharan African sub-region (Afr-E) and south east Asian sub-region (Sear-D). To allow greater comparability with interventions in other disease areas, we standardised both cost and effectiveness estimates in relation to regional population size. Effectiveness results are expressed in the number of DALYs averted per million population per year of implementation of the intervention. Cost results are expressed in millions of international dollars per million population per year, which is equivalent to the cost per capita.
Costs, effects, and cost-effectiveness of interventions to combat asthma and chronic obstructive pulmonary disease (COPD) in WHO sub-Saharan African sub-region AfrE and South East Asian sub-region SearD
Population level effect of interventions
The magnitude of impact of each intervention is different between the two regions. For example, in the sub-Saharan African sub-region all asthma interventions are noticeably more cost effective than all COPD interventions. The case is somewhat different in the South East Asian sub-region, where one COPD intervention (flu vaccine) is competitive with asthma interventions because of the higher underlying burden of COPD in that region. However, the relative order of effectiveness between regions is similar: inhaled bronchodilator (for COPD stage II) is the most effective intervention in both regions, averting 58 DALYs per million population per year of intervention in Afr-E and 370 DALYs in Sear-D; the next most effective in the Afr-E is low dose inhaled corticosteroids plus long acting β agonists for moderate persistent asthma cases, averting 45 DALYs, whereas in Sear-D the next is inhaled bronchodilator and corticosteroid (for COPD stage III and IV), which averts 151 DALYs (equivalent to 41%–76% of the inhaled bronchodilator (COPD stage II) intervention).
Influenza vaccine in the sub-Saharan African sub-region and medium dose inhaled corticosteroids for moderate persistent asthma cases in the South East Asian sub-region are least effective of the interventions analysed, producing only about 1%–7% of the number of DALYs averted by the use of inhaled bronchodilator (COPD stage II) in both regions. Part of the explanation for this relatively small impact is that flu vaccine is expected to have no impact on COPD associated disability, whereas use of long term anticholinergic bronchodilator is expected to reduce COPD associated disability by up to 97%, as measured by St George’s Respiratory. Questionnaire.38
Population level cost of interventions
The annual costs of interventions per million population ranged from $Int49 000 to $Int749 000 in the sub-Saharan African sub-region and from $Int12 000 to $Int4 225 000 in the South East Asian sub-region (rounded to the nearest thousand). Cost estimates of most interventions were appreciably different across the two regions (table 3⇑). In general, asthma interventions in the African sub-region were more costly than in the South East Asian sub-region because of the larger number of patients treated. The reverse was true with respect to COPD interventions—that is, COPD interventions reported higher costs in Sear-D than in Afr-E because of the high number of patients who could benefit from treatment in that region. The interventions inhaled bronchodilator (for COPD stage II), inhaled bronchodilator and corticosteroid (COPD stage III and IV), and oxygen therapy (COPD stage IV), which are based on the administration of drugs, cost five times less in the sub-Saharan African sub-region than in the south east Asian sub-region. The cost per capita per year of influenza vaccine was about the same in both regions.
There is substantial variation of population level cost of interventions, ranging from a few cents per capita for low dose inhaled corticosteroids given to patients as step 2 asthma treatment to more than $Int4 per capita for inhaled bronchodilator (for COPD stage II and III) in the South East Asian sub-region.
In terms of cost breakdown, patient level costs are the main cost component for most COPD interventions in both regions, reflecting the high cost of drugs. The treatment of severe COPD exacerbations also had a considerable cost (about 62%) resulting from the provision of hospital bed days. For the provision of oxygen therapy, inhaled bronchodilators, and corticosteroids, patient level costs can account for more than 90% of total costs. For asthma interventions with more than one drug—namely inhaled corticosteroids plus long acting β agonists and inhaled corticosteroids plus leukotriene receptor agonists—primary care visits accounted for 24% of the total cost of these interventions, while the drugs accounted for the remaining 76% of costs. For the other interventions (low and medium dose inhaled corticosteroids), these proportions were inverted, with primary care visits and drugs accounting for 76% and 24% of costs, respectively.
Cost effectiveness of interventions
The combined analysis of both costs and effects shows the relative cost effectiveness of the interventions (figs 1⇓ and 2⇓). The cost per DALY averted for all interventions analysed ranged from $Int2686 to $Int39 307 in the sub-Saharan African region and from $Int2420 to $Int50 651 in the South East Asian region.
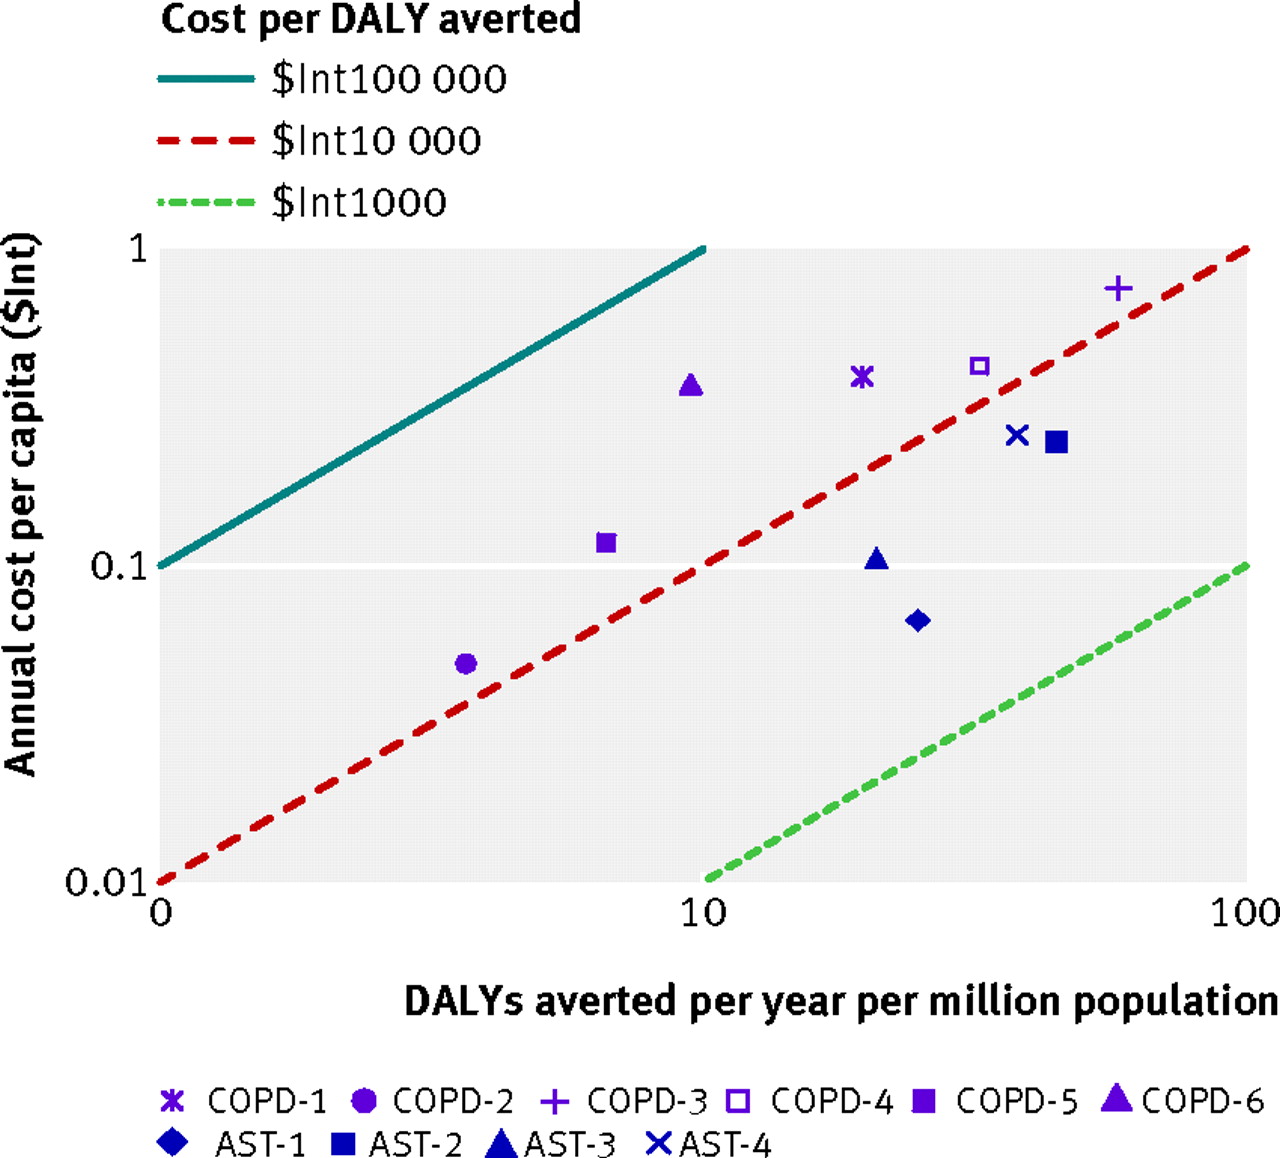
Fig 1 Cost effectiveness isoquants of interventions for chronic obstructive pulmonary disease (COPD) and asthma interventions (at 80% coverage) for sub-Saharan African sub-region Afr-E. See table 3⇑ for explanation of intervention codes

Fig 2 Cost effectivenes isoquants of chronic obstructive pulmonary disease (COPD) and asthma interventions (at 80% coverage) for South East Asian sub-region Sear-D. See table 3⇑ for explanation of intervention codes
In both regions, low dose inhaled corticosteroids for mild persistent asthma was the most cost effective intervention, costing an estimated $Int2420 (Sear-D) and $Int2686 (Afr-E) per DALY averted. If more resources were to become available, the incremental cost effectiveness ratio can be used to assess each intervention in relation to the preceding most preferred intervention. In the sub-Saharan African region, the next preferred interventions on the basis of cost effectiveness were low dose inhaled corticosteroids plus long acting β agonists for moderate persistent asthma (incremental cost effectiveness ratio $Int9112 per DALY averted) and next, inhaled bronchodilator for COPD stage II ($Int36 769 per DALY averted). In the South East Asian region, the next preferred interventions were influenza vaccine for COPD ($Int4950 per DALY averted) and inhaled bronchodilator for COPD stage II ($Int11 694 per DALY averted).
The other interventions have considerably higher cost effectiveness ratios (table 3⇑). For example, inhaled bronchodilator and corticosteroid (COPD stages III and IV) costs $Int13 000–14 000 per DALY averted, while treatment of severe exacerbations costs around $Int18 000 per DALY averted in sub-Saharan Africa and $Int9000 in South East Asia. The cost effectiveness ratio of oxygen therapy is almost $Int40 000 per DALY averted in sub-Saharan Africa region and in excess of $Int50 000 per DALY averted in the South East Asian region.
The results of this analysis suggest that, if funds are available, both regions should first implement provision of low dose inhaled corticosteroids for mild persistent asthma. Over 10 years, this intervention would avert 100 239 DALYs at a cost around $Int269m in the sub-Saharan African region and 67 000 DALYs at a cost around $Int162m in South East Asian region.
Uncertainty analysis
The baseline effectiveness results in table 1⇑ allow for discounting of health benefits at the rate of 3% per year and also apply age specific weights, giving relatively more importance to health gains in middle adult age as opposed to younger and older ages. To examine the importance of these sources of model uncertainty, the model was re-estimated first without the age weights and then without both the age weights and the discount factor. In both cases results were found to be sensitive to the specification of the effectiveness measure. Relaxing the age weighting assumption increased up to 64% the number of DALYs averted (since health gains are in older populations), while eliminating the rate of discount increased benefits up to 113% (since health gains are not realised immediately). As a consequence, cost effectiveness ratios were reduced by up to 39% with the elimination of age weighting and by up to 53% with the elimination of both age weighting and discounting. Influenza vaccine and oxygen therapy were relatively more affected among the interventions examined. This implies that the baseline results should be interpreted as conservative estimates of the cost effectiveness ratio.
A key parameter of the smoking cessation intervention was the prevalence of smoking among people with diagnosed COPD. As this information was not available for all regions, sensitivity analysis was performed by halving the baseline scenario values for this parameter in each region. Sensitivity analysis results are similar in both regions. The total implementation cost is not affected significantly, but the number of DALYs averted is reduced by about 50% and the cost effectiveness ratio doubles as the number of potential cases treated is reduced.
The probabilistic uncertainty analysis depicted in figures 3⇓ and 4⇓ shows the impact of plausible variations in total costs and total effects and shows that the average cost effectiveness ratio of most interventions would retain a classification of “cost effective” or “not cost effective” after variation around the point estimates was taken into account. A similar logic would apply to the incremental cost effectiveness ratios. Concerning low dose inhaled corticosteroids plus long acting β agonists for moderate persistent asthma (intervention code AST-2) in the South East Asian sub-region, however, figure 3⇓ shows that a substantial part of the probability distribution for its average cost effectiveness estimate would lie outside of the region considered cost effective.

Fig 3 Probabilistic uncertainty graph of interventions for chronic obstructive pulmonary disease (COPD) and asthma interventions (at 80% coverage) for sub-Saharan African sub-region Afr-E. See table 3⇑ for explanation of intervention codes

Fig 4 Probabilistic uncertainty graph of interventions for chronic obstructive pulmonary disease (COPD) and asthma interventions (at 80% coverage) for WHO South East Asia sub-region SearD. See table 3⇑ for explanation of intervention codes
Discussion
Key findings and implications
Detailed analyses documenting the resource implications of COPD and asthma interventions remain scarce, especially in the area of hospital management, where the GOLD strategy was unable to find any major contributions.15 This study set out to produce uniform cost effectiveness estimates of several interventions for COPD and asthma that can be used to inform comparisons with investments in other disease areas and treatment options. The results of the cost effectiveness analysis reported here have implications for the allocation of resources and priority setting across interventions in the wider group of non-communicable diseases.
If resources are available, the results indicate that policy makers in both regions should prioritise first the implementation of low dose inhaled corticosteroids for mild persistent asthma. This intervention is relatively inexpensive but averts a sizable number of DALYs, avoiding exacerbations, which are an important source of damage to quality of life and increased mortality. Policy makers in the South East Asian region should also consider the provision of influenza vaccine for COPD. In the sub-Saharan African region policy makers should focus on the provision of low dose inhaled corticosteroids plus long acting β agonists for moderate persistent asthma as the next most cost effective intervention. Medium dose inhaled corticosteroids for moderate persistent asthma cases would make a further important contribution to asthma control but is a less cost effective option.
Compared with interventions to combat other chronic conditions, COPD and asthma interventions seem to be of relatively poor cost effectiveness. Two main factors seem to explain this difference. Firstly, treatment interventions for chronic respiratory diseases rely mostly on expensive imported drugs, as opposed to interventions for other diseases, which that are often based on less expensive local goods and services. Secondly, these conditions are generally progressive, and COPD in particular is irreversible and incurable, which means that health gains from combating chronic respiratory diseases would seem relatively low compared with combating curable diseases.
There are further reasons for our conservative results for asthma. Firstly, because of the inherent characteristics of the disease and treatment, the impact of interventions was modelled for four months (consistent with the treatment period of the stepwise approach), and, for the remainder of the year, no treatment effectiveness or improvement in asthma disability was assumed (since treatment adjustment would be recommended, implying different intervention scenarios). In reality, however, patients would continue to be treated after their asthma had initially been controlled, though with different treatment schemes (that may or may not continue to control the asthma), but some would in any case be experiencing improvements in quality of life. We have not captured these changes in quality of life because of the complexity in the definition of intervention scenarios and the variability in patient profiles and clinical patterns. However, although this component of asthma burden reduction has not been captured in this analysis, we believe our results offer a robust estimate of the benefits and costs of interventions as they have been defined and are an accurate reflection of the relationships among interventions.
On the other hand, the definition of asthma end point used was stringent. In this analysis the proportion of patients that accessed the interventions was obtained from the percentage of patients achieving total control in randomised clinical trials. The definition of total control derived from the clinical trials selected for this study is more rigorous than that adopted by the guidelines.19 20 21 Consequently, the proportion of patients achieving mere asthma control as per guidelines management goals would be larger in real practice. This would increase the treated populations and thus, the overall effectiveness of interventions. However, the best information available on achieving asthma control during the study conduction was that from clinical trials.
Related to the above, even if asthma control is not achieved, improvements in quality of life can still be obtained with appropriate treatment.26 Therefore, treated patients with partly controlled asthma, and even uncontrolled asthma, could contribute to lessen asthma associated disability. Nevertheless, we did not allow for improvements in asthma associated disability for groups other than patients with fully controlled asthma in order to conform with the guidelines’ definition of asthma control, which is the current clinical standard. Lack of information was another reason for not including improvements in quality of life among patients with undercontrolled asthma. However it is important to note that improvements in quality of life of could occur with partly controlled asthma, which would contribute to the reduction in disease burden with asthma interventions.
Other interventions for asthma that are effective were not considered in this analysis. This study focused on the long term management of asthma and COPD directed at suppressing or reversing inflammation and treating bronchoconstriction, exacerbations, and related symptoms. Treatment of acute asthma exacerbations and asthma educational interventions, which have been shown to reduce morbidity and mortality in both children and adults, were outside the scope of this analysis. Likewise, the study has not incorporated the impact of interventions on comorbidities.
Effect of uncertainty on the interpretation of the results
Cost effectiveness results are inherently imbued with uncertainty, and changes in parameters could impact the relative order of cost effectiveness. Moreover, decision makers will usually want to take other factors into account as well as cost effectiveness. For instance, although influenza vaccine for COPD cases, inhaled bronchodilator and corticosteroid (for COPD stages III and IV), and all the other asthma-specific interventions are not within the set of health maximising interventions in the sub-Saharan African sub-region, their cost effectiveness estimates are close to those of the interventions in the optimal set. The same applies to the treatment of severe COPD exacerbations, smoking cessation for COPD, and all the other asthma-specific interventions in the South East Asian sub-region. All drug interventions for asthma analysed could be cost effective in both regions. On the other hand, we can be much more confident that oxygen therapy is highly unlikely to be cost effective in either of the regions considered. In both regions, the use of inhaled bronchodilator (for COPD stage II) comes as a relatively cost effective intervention, mainly because of its substantial impact in improving quality of life.
The considerable uncertainty mentioned above provides support also for other interventions, such as smoking cessation and influenza vaccine, which come close to acceptable cost effectiveness threshold. Therefore, taking a long term view would imply that preventive strategies should be emphasised in order to prevent the already large disease burden of asthma and COPD from growing. This conclusion is largely similar to that of Chan-Yeung et al,39 who conclude that tobacco control is of paramount importance in resource poor countries in Asia and Africa and that efforts should be directed towards controlling tobacco smoking to reduce the burden of chronic respiratory diseases. In some cases, the implementation of treatment guidelines is of limited feasibility because spirometers can be found only in major medical centres. Preventive intervention strategies for the two main COPD risk factors (smoking and air pollution) are currently available that can be shown very cost effective when compared with other strategies focused on disease management and symptom relief. For instance, Mehta and Shahpar12 calculate that reducing exposure to indoor air pollution from solid fuel use by promoting the use of improved stoves would cost $Int500 per DALY in the sub-Saharan African sub-region Afr-E and $Int730 per DALY in the South East Asian sub-region Sear-D.
As emphasised in our sensitivity analysis, considerable uncertainty remains about key parameters related to the epidemiology of COPD and its risk factors. More research is needed to provide the necessary information, including the contextualisation of this analysis to national settings. In summary, this study has quantified the health effects and costs of the most effective interventions for asthma and COPD management and has identified the health maximising interventions to reduce the risk of the disease in resource limited settings. Scaling up these interventions could bring important reductions in the burden of chronic respiratory diseases in the two regions studied. Since drugs are the main component of asthma and COPD management, access to treatment should be a main concern in improving care and reducing the disease burden in these regions.
What is already known on this topic
Chronic respiratory diseases, including chronic obstructive respiratory disease and asthma, represent a major disease burden that is projected to increase further, especially in low and middle income countries, because of the increasing prevalence of the main risk factors—tobacco smoking, indoor air pollution, allergens, and viral infections
Several treatments are available to control symptoms and slow disease progression, but little information is available on their health effects and costs at a population level in developing countries
What this study adds
A generalised cost effectiveness evaluation was made of total costs and effects of interventions for chronic respiratory diseases in two WHO epidemiological sub-regions
Within the range of regional variation on the different interventions, low dose inhaled corticosteroids for mild persistent asthma was considered the most cost effective intervention, with average cost per DALY averted at about $Int2500. Efforts should concentrate on the drug management of mild to moderate persistent asthma.
Notes
Cite this as: BMJ 2012;344:e608
Footnotes
We thank Dan Hogan (Department of Health Policy and Management, Harvard University) for providing a version of the WHO-CHOICE COPD tool that served as basis for the model used in this paper. We thank Michele Sechi-Gatta (Erasmus University, Rotterdam) for research assistance and Dr Shanthi Mendis (Department of Chronic Diseases and Health Promotion, WHO) for comments and feedback on an earlier draft.
Contributors: All authors contributed to the conception, design, and interpretation of data. AES and MO performed the technical analysis and drafted the manuscript. All authors have read, commented on, and approved the submitted manuscript. AES was based at the WHO when this work was undertaken and is guarantor of the study.
Funding: None
Competing interests: All authors have completed the ICMJE uniform disclosure form at www.icmje.org/coi_disclosure.pdf (available on request from the corresponding author) and declare: no support from any organisation for the submitted work; no financial relationships with any organisations that might have an interest in the submitted work in the previous 3 years; no other relationships or activities that could appear to have influenced the submitted work.
AES is a staff member of the World Bank; DC and JL are staff members of the WHO. The authors alone are responsible for the views expressed in this publication, and these do not necessarily represent the decisions, policy, or views of the organisations they work for.
Ethical approval: Not required
Data sharing: No additional data available.
This is an open-access article distributed under the terms of the Creative Commons Attribution Non-commercial License, which permits use, distribution, and reproduction in any medium, provided the original work is properly cited, the use is non commercial and is otherwise in compliance with the license. See: http://creativecommons.org/licenses/by-nc/2.0/ and http://creativecommons.org/licenses/by-nc/2.0/legalcode.