
- Bianca Hemmingsen, PhD student1,
- Søren S Lund, physician2,
- Christian Gluud, chief physician and head of department1,
- Allan Vaag, professor3,
- Thomas Almdal, chief physician and head of department2,
- Christina Hemmingsen, research assistant1,
- Jørn Wetterslev, chief physician1
- 1Copenhagen Trial Unit, Center for Clinical Intervention Research, Rigshospitalet, Copenhagen University Hospital, Copenhagen, Denmark
- 2Steno Diabetes Center, Gentofte, Denmark
- 3Department of Endocrinology, Rigshospitalet, Copenhagen University Hospital
- Correspondence to: B Hemmingsen bh{at}ctu.rh.dk
- Accepted 22 September 2011
Abstract
Objective To assess the effect of targeting intensive glycaemic control versus conventional glycaemic control on all cause mortality and cardiovascular mortality, non-fatal myocardial infarction, microvascular complications, and severe hypoglycaemia in patients with type 2 diabetes.
Design Systematic review with meta-analyses and trial sequential analyses of randomised trials.
Data sources Cochrane Library, Medline, Embase, Science Citation Index Expanded, LILACS, and CINAHL to December 2010; hand search of reference lists and conference proceedings; contacts with authors, relevant pharmaceutical companies, and the US Food and Drug Administration.
Study selection Randomised clinical trials comparing targeted intensive glycaemic control with conventional glycaemic control in patients with type 2 diabetes. Published and unpublished trials in all languages were included, irrespective of predefined outcomes.
Data extraction Two reviewers independently assessed studies for inclusion and extracted data related to study methods, interventions, outcomes, risk of bias, and adverse events. Risk ratios with 95% confidence intervals were estimated with fixed and random effects models.
Results Fourteen clinical trials that randomised 28 614 participants with type 2 diabetes (15 269 to intensive control and 13 345 to conventional control) were included. Intensive glycaemic control did not significantly affect the relative risks of all cause (1.02, 95% confidence interval 0.91 to 1.13; 28 359 participants, 12 trials) or cardiovascular mortality (1.11, 0.92 to 1.35; 28 359 participants, 12 trials). Trial sequential analyses rejected a relative risk reduction above 10% for all cause mortality and showed insufficient data on cardiovascular mortality. The risk of non-fatal myocardial infarction may be reduced (relative risk 0.85, 0.76 to 0.95; P=0.004; 28 111 participants, 8 trials), but this finding was not confirmed in trial sequential analysis. Intensive glycaemic control showed a reduction of the relative risks for the composite microvascular outcome (0.88, 0.79 to 0.97; P=0.01; 25 600 participants, 3 trials) and retinopathy (0.80, 0.67 to 0.94; P=0.009; 10 793 participants, 7 trials), but trial sequential analyses showed that sufficient evidence had not yet been reached. The estimate of an effect on the risk of nephropathy (relative risk 0.83, 0.64 to 1.06; 27 769 participants, 8 trials) was not statistically significant. The risk of severe hypoglycaemia was significantly increased when intensive glycaemic control was targeted (relative risk 2.39, 1.71 to 3.34; 27 844 participants, 9 trials); trial sequential analysis supported a 30% increased relative risk of severe hypoglycaemia.
Conclusion Intensive glycaemic control does not seem to reduce all cause mortality in patients with type 2 diabetes. Data available from randomised clinical trials remain insufficient to prove or refute a relative risk reduction for cardiovascular mortality, non-fatal myocardial infarction, composite microvascular complications, or retinopathy at a magnitude of 10%. Intensive glycaemic control increases the relative risk of severe hypoglycaemia by 30%.
Introduction
Observational studies suggest an association between the extent of hyperglycaemia and the risk of death and of macrovascular and microvascular disease in patients with type 2 diabetes.1 2 3 Three recent randomised clinical trials in patients with type 2 diabetes were not able to detect (or reject the possibility of) reduced cardiovascular disease or mortality with intensive compared with conventional glycaemic control.4 5 6 Worries arose as the results from the Action to Control Cardiovascular Risk in Diabetes (ACCORD) trial in 2008 showed increased all cause mortality and cardiovascular mortality in the intensive treatment group compared with conventional treatment.4 The increased mortality led to early termination of the ACCORD trial.4 On the other hand, randomised clinical trials have indicated a beneficial effect on microvascular complications of intensive versus conventional glycaemic control in patients with type 2 diabetes. However, inconsistencies exist among the trials with respect to which type of microvascular complications are prevented and the magnitude of the effect of intensive glycaemic control.5 7 8 The price of intensive glycaemic control may be an increased risk of hypoglycaemia. Achieving intensive glycaemic control in patients with type 2 diabetes requires enormous effort from the patient as well as resources from the healthcare system, particularly compared with the well documented beneficial effects of lipid and blood pressure lowering treatment.9
The definition of intensive glycaemic control varies among trials and guidelines. The ACCORD trial and the Veterans Affairs Diabetes Trial (VADT) used a target of glycated haemoglobin A1c (HbA1c) below 6.0% for intensive glycaemic control compared with a target of HbA1c below 6.5% in the Action in Diabetes and Vascular Disease—Preterax and Diamicron Modified Release Controlled Evaluation (ADVANCE) trial. The results from these trials have created a debate about the optimal choice of glycaemic target. The American Diabetes Association recommends an HbA1c level of less than 7.0% as the standard glycaemic treatment goal, whereas the International Diabetes Federation recommends a level of less than 6.5%.10 11 12
In our published protocol, we predefined inclusion of all trials comparing patients treated to a specific target for intensive glycaemic control with patients treated to a conventional but higher glycaemic target.13 The difference in treatment strategy between the groups was clearly defined either as values of HbA1c or as intensifying glycaemic control. The intensive glycaemic targets varied across the trials, but the trials compared the results of trying to achieve a distinct lower target with those of aiming for a higher one. We believe that the existence of a “gold threshold” target remains to be established and that the hypothesis so far has been that targeting/lowering the HbA1c may have a beneficial effect along the entire scale of measurements of HbA1c unless hypoglycaemia is reached. In this sense, we have included all trials comparing an intensified glycaemic target with a more “relaxed” glycaemic target, often reflecting usual clinical practice for a given place and time.
This systematic review reanalyses current evidence of the effect of targeting intensive glycaemic control on all cause mortality, cardiovascular mortality, cardiovascular disease, and microvascular disease in patients with type 2 diabetes. We consider the effects of intensive glycaemic control irrespective of differences among trials in individual targets or achieved glycaemic control.13
As well as assessing the effect of intensive glycaemic control on the outcomes reported in this systematic review (all cause mortality, cardiovascular mortality, non-fatal myocardial infarction, composite microvascular complications, retinopathy, and nephropathy), we assessed macrovascular complications as a composite outcome, non-fatal stroke, peripheral and cardiac revascularisation, retinal photocoagulation, end stage renal disease, congestive heart failure, adverse events, the cost of the intervention, and quality of life. The results for these supplemental outcomes are published elsewhere.14
Methods
This review follows the recommendations of the Cochrane Collaboration.15 It is based on our published Cochrane protocol.13
We included all randomised trials that compared the targeting of intensive glycaemic versus conventional glycaemic control in patients with type 2 diabetes.13 14 We analysed trials according to the setting of the intensive glycaemic intervention. We analysed trials of targeting intensive glycaemic control in patients without acute events at entry or without concomitant treatments targeting other cardiovascular risk factors as “trials exclusively dealing with glycaemic control in usual care setting.”13 The data in the review reported here are from this group of trials, representing 28 614 (95%) of 29 986 participants included in our review.13 14 We excluded three trials assessing multimodal interventions,16 17 18 as well as three trials assessing intensive glycaemic control as part of an acute intervention.19 20 21 For the vast majority of estimated effects of intervention, these exclusions did not cause noticeable changes.13
We analysed trials of targeting intensive glycaemic control as part of an acute intervention and trials with multimodal interventions separately.13 14 We also did an overall meta-analysis combining data from all included trials irrespective of the setting in which intensive glycaemic control was applied.13 14 We refer only to data from the analyses of trials exclusively dealing with glycaemic control in usual care setting in this paper, but the Cochrane version gives a full presentation.14
Search strategy
We did a search in the Cochrane Library, Medline, Embase, Science Citation Index Expanded, LILACS, and CINAHL in December 2010 for randomised clinical trials of targeting intensive glycaemic control versus targeting conventional glycaemic control in patients with type 2 diabetes. Web appendix 1 describes the search terms and strategies for each database. We also searched abstracts presented at the American Diabetes Association and European Association for the Study of Diabetes congresses. We contacted relevant drug companies and the US Food and Drug Administration for unpublished randomised trials relevant to our review. We searched reference lists of included trials and (systematic) reviews, meta-analyses, and health technology assessment reports. We did internet searches for all trials to find additional information about the included trials. We contacted authors for information about additional trials.
Study selection
Two authors (BH and AV, CG, CH, SSL, or TA) independently screened titles and abstracts according to the inclusion criteria. We included a trial if it was a randomised clinical trial, compared targeting intensive glycaemic control versus targeting conventional glycaemic control, and was done in patients with type 2 diabetes. We included trials irrespective of duration, language, publication status, or predefined outcomes.
Data extraction and risk of bias assessment
Two authors (BH and CH or TA) independently extracted information from each included trial by using standard data extraction forms and assessed the risk of bias as advised in the Cochrane Handbook of Systematic Reviews of Interventions.15 We assessed the following risk of bias domains: sequence generation, concealment of allocation, blinding, incomplete outcome data, selective outcome reporting, and other sources of bias.15 We classified each domain as adequate, unclear, or inadequate. Web appendix 2 gives details. Discrepancies between authors’ assessments were resolved by involvement of a third author (JW). Translators extracted data from all relevant non-English articles.
We extracted data on several baseline characteristics of the participants (such as age, duration of disease, HbA1c) and outcomes. The predefined outcomes reported in this review are all cause mortality, cardiovascular mortality, non-fatal myocardial infarction, microvascular disease reported as a composite outcome, retinopathy, nephropathy, and severe hypoglycaemia.13 We sought any relevant missing information from the original author(s) of the randomised trial.
When we identified more than one publication of an original trial, we assessed these together to maximise data collection. In case of substantial disagreements between older and newer publications, we contacted the authors.
Statistical analysis
We used Review Manager version 5.0.25 for statistical analysis.22 We summarised data on all cause mortality, cardiovascular mortality, non-fatal myocardial infarction, and severe hypoglycaemia statistically as relative risks with 95% confidence intervals. We used both a random effects model and a fixed effect model.23 24 In case of discrepancy between the two models, we report both results; otherwise, we report the random effects model.
We examined heterogeneity with the I2 statistic, quantifying the proportion of between trial variance to the sum of the between trial variance and a common sampling error.25 We graded values of I2 between 0% to 40% as “heterogeneity might not be important,” values between 30% and 60% as “moderate heterogeneity,” values between 50% and 90% as “substantial heterogeneity,” and values between 75% and 100% as “considerable heterogeneity.”25 When we found heterogeneity, we attempted to determine potential reasons by examining characteristics of individual trials.
We did subgroup analyses stratifying trials according to risk of bias, length of study, diagnostic criteria for type 2 diabetes, language of publication, and source of funding for all cause mortality, cardiovascular mortality, and non-fatal myocardial infarction.
We did trial sequential analyses.26 27 This is similar to interim analyses in a single trial, where monitoring boundaries are used to decide whether a trial could be terminated early when a P value is sufficiently small to show the anticipated effect. Because no reason exists why the standards for a meta-analysis should be less rigorous than those for a single trial, analogous trial sequential monitoring boundaries can be applied to meta-analysis.28 29 30 Cumulative meta-analyses of trials are at risk of producing random errors because of sparse data and repetitive testing of accumulating data when the required information size (analogous to the sample size of an optimally powered clinical trial) has not been met. Trial sequential analysis depends on the quantification of the required information size (the meta-analysis sample size). In this context, the smaller the required information size the more lenient the trial sequential monitoring boundaries are and, accordingly, the more lenient the criteria for statistical significance will be. We calculated a heterogeneity (I²) adjusted required information size. We did the trial sequential analyses with an intention to maintain an overall 5% risk of a type I error, which is the standard in most meta-analyses and systematic reviews. On the basis of pre-determined criteria,13 we initially calculated the required information size to detect or reject an intervention effect of a 10% relative risk reduction with a risk of a type II error of 20% (power of 80%). We chose a 10% relative risk reduction equivalent to a number needed to treat of approximately 100 patients, because even this decrease in mortality is likely to be clinically meaningful. For severe hypoglycaemia, however, we chose a 30% increase in relative risk equivalent to a number needed to harm of 50. We also provide the 95% confidence intervals adjusted for sparse data and repetitive testing, which we describe as the trial sequential analysis adjusted 95% confidence intervals. We used TSA version 0.9 beta (www.ctu.dk/tsa) for these analyses.
Results
Results of the search and trial, participant, and intervention characteristics
Figure 1⇓ summarises the results of the search. We excluded 42 references after further evaluation. The main reasons for exclusion were that the trial was not randomised (11 references),31 32 33 34 35 36 37 38 39 40 41 participants were not patients with type 2 diabetes or we could not separate data on patients with type 2 diabetes (four references),42 43 44 45 or no predefined differences in glycaemic intervention target existed (16 references).46 47 48 49 50 51 52 53 54 55 56 57 58 59 60 61 In addition, we excluded trials that assessed intensive glycaemic control as a part of an acute intervention (five references, three trials) or had concomitant targeting of several cardiovascular risk factors in the glycaemic intervention arm (six references, three trials).16 17 18 19 20 21 62 63 64 65 66 Table 1⇓ gives a list of excluded trials.

Fig 1 Flow diagram of identification of randomised trials for inclusion
Excluded trials
We included 20 randomised trials, of which 14 exclusively dealt with glycaemic control in the usual care setting in patients without acute events at entry.4 5 6 7 8 67 68 69 70 71 72 73 74 75 76 77 78 79 80 81 82 83 84 85 86 87 88 89 90 91 92 93 94 95 96 97 98 99 100 101 102 103 104 105 106 107 108 109 110 111 Thirteen of the trials were published in English and one in Russian.85 The 14 included trials were described in 51 publications. We noted a discrepancy in the number of participants in two publications of one trial.83 84 We used baseline data from the publication in the Netherlands Journal of Medicine.83
The trials included 28 614 participants, of whom 15 269 were randomised to intensive glycaemic control and 13 345 to conventional glycaemic control. Table 2⇓ shows key characteristics of the included trials, and table 3⇓ shows characteristics of trials’ participants. The included trials were mainly done in North America and Europe. The number of randomised patients in each trial ranged from 20 to 11 140.5 87 All 14 included trials were randomised clinical trials.
Key characteristics of included trials
Key characteristics of participants
Two of the trials had a factorial design.4 5 The UK Prospective Diabetes Study (UKPDS) had a substudy in which some of the participants were randomised to intensive blood pressure control versus conventional blood pressure control.102 The University Group Diabetes Program (UGDP) randomised participants to five different treatment regimens.88 We chose to report the “insulin variable” group as the intensive group and the “insulin standard” group as the conventional group.
The Kumamoto trial had a planned length of intervention of six years.7 Only two of the included 110 participants changed their glycaemic intervention regimen after the predefined intervention period. The trial therefore continued on the initiative of the participants. We have reported all outcomes in this analysis after 10 years of follow-up, except for severe hypoglycaemia (reported after eight years of follow-up).95
Ten trials described how the diagnosis of type 2 diabetes was established (see web appendix 3).4 6 7 8 82 83 87 88 92 106 Four trials did not describe how the diagnosis was established.5 85 86 94 Most exclusion criteria consisted of liver disease, kidney disease, or other severe concurrent illnesses.
The anti-diabetes interventions used in the trials often included add-on regimens consisting of several oral drugs. If participants could not reach the glycaemic target with these regimens, insulin was started. The usual add-on regimen was identical in the intensive and conventional intervention groups of the single trials, except in the ADVANCE trial and the Rational Effective Multicomponent Therapy in the Struggle Against DiaBetes Mellitus in Patients With COngestve Heart Failure (REMBO) trial, in which participants targeting intensive glucose control were given gliclazide.5 85 Most trials allowed combination of oral anti-diabetes interventions and insulin. Two trials allowed only monotherapy (insulin) in both the intensive intervention group and conventional intervention group.7 88
The treatment targets for glycaemic control varied between trials in both the intensive treatment group and the conventional treatment group (table 2⇑). The ACCORD trial and the VADT had the lowest target for HbA1c in the intensive intervention groups (both less than 6%).4 6 Some of the trials did not predefine the glycaemic target in values of HbA1c but used fasting glucose concentration as a target for treatment.8 83 86 88 94
Bias risk assessment
We divided the trials into those with a low risk of bias and those with a high risk of bias on the basis of assessment of sequence generation, concealment of allocation, and blinding according to the Cochrane Handbook risk of bias tool.15 When we judged all three domains to have a low risk of bias, we designated the trial as having a low risk of bias. Table 4⇓ reports the bias risk assessments of the included trials. We considered six trials to have a low risk of bias.4 5 6 8 88 92
Risk of bias assessments of included trials
Clinical outcomes
All cause mortality
Twelve trials provided information on all cause mortality in a total of 28 359 participants (fig 2⇓). Meta-analysis showed no significant effect of intensive glycaemic control (relative risk 1.02, 95% confidence interval 0.91 to 1.13; P=0.74; 28 359 participants, 12 trials) compared with conventional glycaemic control. Heterogeneity was moderate (I2=30%; P=0.18).

Subgroup analyses of the trials according to risk of bias, length of study, diagnostic criteria for type 2 diabetes, and source of funding showed no statistically significant differences between subgroups (that is, no significant interaction). Subgroup analyses for language of publication could not be done.
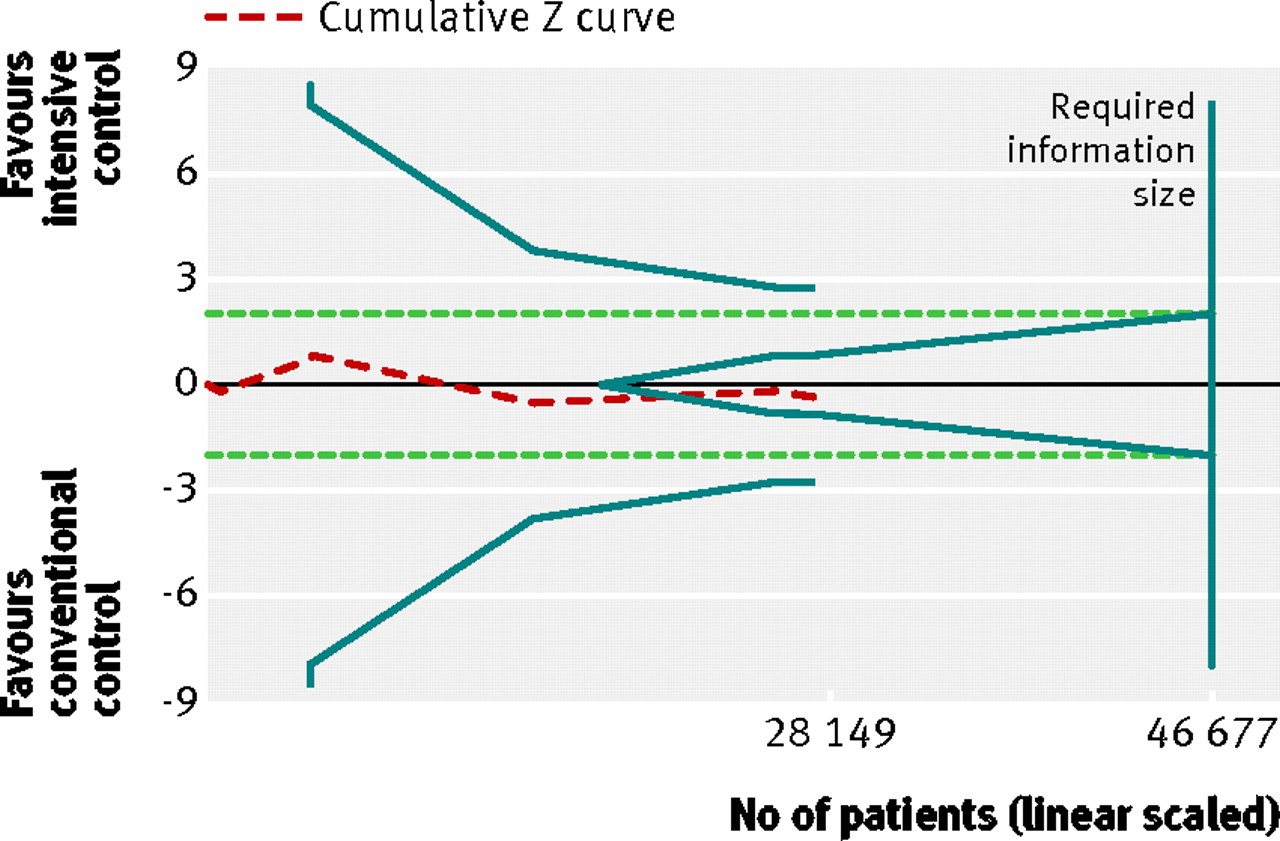
Trial sequential analysis showed that only 28 149 of the heterogeneity adjusted required information size of 46 677 patients were accrued. The cumulative Z curve did not cross any boundaries for benefit or harm (trial sequential analysis adjusted 95% confidence interval 0.88 to 1.18) (fig 3⇓). However, the cumulative Z curve crossed the futility boundaries, suggesting that a relative risk reduction of 10% or greater could be rejected.

Fig 3 Trial sequential analysis of all cause mortality. Heterogeneity adjusted required information size of 46 677 participants calculated on basis of proportion of mortality of 8.4% in conventional glucose control group, relative risk reduction of 10%, α=5%, β=20%, and I2=30%. Actually accrued No of participants was 28 149, 60% of required information size. Dashed red cumulative Z curve does not cross solid blue trial sequential monitoring boundaries for benefit or harm, but boundaries for futility (blue inner wedge boundaries) are crossed. Horizontal dotted green lines illustrate traditional level of statistical significance (P=0.05)
Cardiovascular mortality
Twelve trials provided information on cardiovascular mortality and were included in the analyses. Web appendix 3 gives details of the definitions and reporting of cardiovascular mortality in the trials. The meta-analysis of the 12 trials did not show a statistically significant effect of the intervention on cardiovascular mortality (relative risk 1.11, 0.92 to 1.35; P=0.27; 28 359 participants, 12 trials). Figure 4⇓ shows the forest plot analysis of cardiovascular mortality. Heterogeneity was present (I2=46%; P=0.08).

Subgroup analyses of the trials according to risk of bias, length of study, and source of funding showed no statistically significant differences between subgroups. Subgroup analyses for language of publication could not be done. Including only trials that described the diagnostic criteria for type 2 diabetes changed the effect estimate to a significant value in favour of conventional glycaemic control (relative risk 1.26, 1.08 to 1.46; P=0.002; 17 093 participants, 9 trials). The test for interaction showed a statistically significant difference between the two estimates (P=0.001).
Trial sequential analysis showed that barely 22% of the heterogeneity adjusted required information size to detect or reject a 10% relative risk reduction was actually accrued (trial sequential analysis adjusted 95% confidence interval 0.70 to 1.76). None of the boundaries for benefit, harm, or futility was crossed, showing too little evidence to allow us to conclude whether the intervention was beneficial, harmful, or without any effect on this outcome (fig 5⇓).

Fig 5 Trial sequential analysis for cardiovascular mortality. Heterogeneity adjusted required information size of 129 468 participants calculated on basis of proportion of cardiovascular mortality of 4.1% in conventional glucose control group, relative risk reduction of 10%, α=5%, a β=20%, and I2=46%. Actually accrued No of participants was 28 149, 22% of required information size. Dashed red cumulative Z curve does not cross solid blue trial sequential monitoring boundaries for benefit or harm. Horizontal dotted green lines illustrate the traditional level of statistical significance (P=0.05)
Non-fatal myocardial infarction
A total of 1237 non-fatal myocardial infarctions were recorded in 28 111 participants from eight trials. The details of how the diagnosis of myocardial infarction was defined varied among the trials (web appendix 3). The effect estimate showed a significant benefit of targeting intensive glycaemic control in a conventional meta-analysis (relative risk 0.85, 0.76 to 0.95; P=0.004; 28 111 participants, 8 trials). Heterogeneity was absent (I2=0%; P=0.70). Figure 6⇓ shows the forest plot.

Fig 6 Forest plot for non-fatal myocardial infarction
Subgroup analyses of the trials according to low risk of bias did not change the effect estimates. Meta-analysis of trials with a high risk of bias changed the effect estimate to a statistically non-significant value (relative risk 0.83, 0.23 to 2.98; P=0.78; 306 participants, 3 trials). A test for interaction showed no statistically significant difference in the effect estimates. We could not do the subgroup analyses for language of publication, duration of intervention, funding source, and diagnostic criteria owing to lack of data.
Trial sequential analysis showed a lack of sufficient evidence of a benefit of targeting intensive glycaemic control for the reduction of non-fatal myocardial infarction (trial sequential analysis adjusted 95% confidence interval 0.71 to 1.02). Only 27 958 (44%) of the heterogeneity adjusted required information size of 63 446 patients required to detect a 10% relative risk reduction for non-fatal myocardial infarction were accrued (fig 7⇓).

Fig 7 Trial sequential analysis for non-fatal myocardial infarction. Heterogeneity adjusted required information size of 63 446 participants calculated on basis of proportion of non-fatal myocardial infarction of 4.5% in conventional glucose control group, relative risk reduction of 10%, α=5%, β=20%, and I2=0%. Actually accrued No of participants was 27 958, 44% of required information size. Dashed red cumulative Z curve does not cross solid blue trial sequential monitoring boundaries for benefit or harm. Horizontal dotted green lines illustrate the traditional level of statistical significance (P=0.05)
Composite outcome of microvascular complications
We assessed a composite outcome of microvascular complications, consisting of manifestation and progression of nephropathy, end stage renal disease, manifestation and progression of retinopathy, and retinal photocoagulation. We could extract usable data from three trials that had a predefined composite microvascular outcome.4 5 8 The definitions of the reported composite outcome varied among the included trials (web appendix 2).
For the composite outcome of microvascular complications, we found a benefit of targeting intensive glycaemic control compared with targeting conventional glycaemic control (relative risk 0.88, 0.79 to 0.97; P=0.01; 25 600 participants, 3 trials) (fig 8⇓). The I2 statistic was 45% (P=0.16). We found an absolute risk reduction of about 1% (risk difference −0.01, 95% confidence interval −0.02 to 0.00; P=0.006). However, trial sequential analysis did not show sufficient evidence for a 10% relative risk reduction for the composite outcome of microvascular complications (trial sequential analysis adjusted 95% confidence interval 0.76 to 1.01) (fig 9⇓).

Fig 8 Forest plot for composite microvascular outcome

Fig 9 Trial sequential analysis for composite microvascular outcome. Heterogeneity corrected required information size of 43 703 participants calculated on basis of proportion of composite microvascular outcome of 11.1% in conventional glucose control group, relative risk reduction of 10%, α=5%, β=20%, and I2=45%. Dashed red cumulative Z curve does not cross solid blue trial sequential monitoring boundaries for benefit or harm. Horizontal dotted green lines illustrate the traditional level of statistical significance (P=0.05)
Retinopathy
Retinopathy was primarily reported with the Early Treatment of Diabetic Retinopathy Study (ETDRS) scale (web appendix 3). The effect estimate showed significant benefit in favour of intensive glycaemic control (relative risk 0.80, 0.67 to 0.94; P=0.009; 10 793 participants, 7 trials) (fig 10⇓). Heterogeneity was substantial (I2=59%; P=0.02). Trial sequential analysis showed a lack of sufficient evidence for a 10% or greater relative risk reduction in retinopathy (trial sequential analysis adjusted 95% confidence interval 0.54 to 1.17) (fig 11⇓).


Fig 11 Trial sequential analysis for retinopathy. Heterogeneity corrected required information size of 43 960 participants calculated on basis of proportion of retinopathy of 14.3% in conventional glucose control group, relative risk reduction of 10%, α=5%, β=20%, and I2=59%. Actually accrued No of participants was 10 793, 25% of required information size. Dashed red cumulative Z curve does not cross solid blue trial sequential monitoring boundaries for benefit or harm. Horizontal dotted green lines illustrate the traditional level of statistical significance (P=0.05)
Nephropathy
The definition of nephropathy varied among trials (web appendix 3). We found no statistically significant effect of intensive glycaemic control on nephropathy (relative risk 0.83, 0.64 to 1.06; P=0.13; 27 769 participants, 8 trials) (fig 12⇓). Heterogeneity was substantial (I2=75%, P<0.001).

Severe hypoglycaemia
The definition of severe hypoglycaemia varied among trials (web appendix 3). The ACCORD trial reported the number of hypoglycaemic events in two ways—requiring any assistance and requiring medical assistance. We have reported the number requiring any assistance, as this definition accords best with the definition in the other included trials.5 Five trials, besides the ACCORD trial, had the assistance of a third person as a part of their definition of serious hypoglycaemia.5 7 8 80 109
Meta-analysis of intensive versus conventional control showed a statistically significant estimate of effect on severe hypoglycaemia (relative risk 2.39, 1.71 to 3.34; P<0.001; 27 844 participants, 9 trials). Heterogeneity was substantial (I2=73%, P=0.005) (fig 13⇓).

For the application of trial sequential analysis to severe hypoglycaemia, the protocol assumed an increase in relative risk of 30%, equivalent to a number needed to harm of 50, to construct the trial sequential monitoring boundaries. The cumulative Z curve crossed the trial sequential monitoring boundary for harm, indicating that sufficient evidence exists for a 30% increase in relative risk of severe hypoglycaemia when intensive glycaemic control is targeted (fig 14⇓).

Fig 14 Trial sequential analysis for severe hypoglycaemia. Heterogeneity adjusted required information size of 36 937 participants calculated on basis of proportion of severe hypoglycaemia of 2.9% in conventional glucose control group, relative risk reduction of 30%, α=5%, β=20%, and I2=73%. Cumulative Z curve crosses trial sequential monitoring boundary, showing sufficient evidence reached for 30% increase in relative risk with targeted intensive glycaemic control. Horizontal dotted green lines illustrate the traditional level of statistical significance (P=0.05)
Discussion
Our key finding is that whether the clinician is targeting an intensive or conventional glycaemic value does not seem to change the risk of all cause mortality or cardiovascular mortality. However, intensive glycaemic control might reduce the risk of non-fatal myocardial infarction, microvascular complications (on the basis of a composite outcome), and retinopathy. The risk of nephropathy does not seem to change with the glycaemic target. The price of intensive glycaemic control is an increased risk of severe hypoglycaemia. However, among these conclusions, only that for hypoglycaemia seems to be based on a sufficient information size at this stage. A reduced risk of microvascular disease with intensive versus conventional glucose control has been found in several individual trials and is consistent with findings in patients with type 1 diabetes. However, our meta-analysis suggests that data on microvascular outcomes in patients with type 2 diabetes are still insufficient. Absence of evidence cannot be taken as evidence of absence, however, and an effect at the size of the point estimates found in our meta-analyses may eventually be shown when further trials are done.112
Strengths and limitations
This is the first and most comprehensive systematic review with meta-analyses of targeting intensive versus conventional glycaemic control in patients with type 2 diabetes that focuses on mortality and macrovascular as well as microvascular complications. The strengths of this review are a published protocol, a comprehensive search strategy, and rigid inclusion criteria for the randomised trials.13
We have included trials with large differences in the average duration of type 2 diabetes, length of the interventions, patients’ age and risk of cardiovascular disease, and assessment of glycaemic control, as well as pre-specified targets of glycaemic control. We included trials irrespective of the language of publication and outcomes reported. Two authors independently extracted data and obtained data from or confirmed data with corresponding authors of the included trials.
Several meta-analyses have recently been published on this topic.113 114 115 116 117 118 119 120 121 However, many of the meta-analyses claiming to assess the effect of targeting intensive glycaemic control versus conventional glycaemic control have included trials on the basis of achieved (that is, during follow-up) rather than targeted (that is, as randomly allocated) differences in glycaemic control.113 115 116 120 121 For example, they included head to head comparisons of anti-diabetes drugs with a similar target of HbA1c below 6.5% in both intervention groups, such as the PROspective pioglitAzone Clinical Trial In macroVascular Events (PROactive) trial of add-on pioglitazone versus placebo.50 Boussageon et al applied the same approach in a recently published meta-analysis.113 This chosen strategy of selection is potentially problematic, as the levels of glycaemic control targeted and achieved in a clinical trial represent different chosen variables. To some extent, the achieved glycaemic control represents observational data precluding inferences about causality with respect to its influence on other outcomes. In contrast, target levels, as part of the randomised intervention strategy, can support inferences about causality. Therefore, to optimally assess the clinical effect of aiming for intensive glycaemic control, which is probably the relevant question for the clinician as well as people trying to establish evidence based guidelines, trials need to be meta-analysed primarily on the basis of predefined differences in glycaemic targets.
The previous meta-analyses that dealt exclusively with trials in which the patients were randomised to different glycaemic targets included only four to six trials.114 117 118 119 We included 14 trials, which is at least eight more trials than in the previous meta-analysis. All of the meta-analyses investigating the effect of targeting intensive glycaemic control have included the four major trials,4 5 6 8 which contributed the greatest number of the participants in our analysis (27 391 of 28 614 participants). However, none of the previous meta-analyses included trials published in languages other than English or tested for the risk of having false positive P values or unrealistically narrow confidence intervals. Furthermore, none of the previous meta-analyses was done as a Cochrane systematic review.15
The weaknesses of our analyses and conclusions mirror the weaknesses in the individual included trials. Most importantly, only six of the 14 trials included were classified as trials with a low risk of bias. However, we found no statistically significant association between the risk of bias and the effect estimates in subgroup analyses. Analysing cardiovascular mortality by diagnostic criteria suggested a negative effect estimate for intensive versus conventional glycaemic control in the trials with a clear description of the diagnosis. However, analysis of trials describing diagnostic criteria excluded the ADVANCE trial, which is the largest trial included in this systematic review (11 140 participants, about one third of the total information size). Excluding the ADVANCE trial, which reported a neutral effect of intensive versus conventional glycaemic control on cardiovascular mortality, substantially increased the weight of some other trials in the analysis. This applies in particular to the ACCORD trial, which included a marginally lower number of participants than did the ADVANCE trial. Unlike the ADVANCE trial, the ACCORD trial reported an increased risk of cardiovascular death for targeting intensive versus conventional glycaemic control. Apart from diagnostic criteria, subgroup analyses for other variables supported the conclusions from the primary overall analysis. Given the somewhat arbitrary criteria for type 2 diabetes, the progressive nature of the disease, and, perhaps in particular, the inclusion of trials in this analysis with different glycaemic targets and clinical outcomes, we find it most likely that the reduced cardiovascular mortality with conventional glycaemic control of the subgroup analysis according to diagnostic criteria represents a chance finding, possibly arising from confounding by the ACCORD trial.
We evaluated the strength of the available evidence by comprehensive analyses of the risk of sparse data and repetitive testing with trial sequential analysis. We did this for outcomes that showed significance in the cumulative meta-analysis, calculating heterogeneity adjusted required information sizes and applying trial sequential monitoring boundaries of benefit, harm, and futility.26 27 The result of the trial sequential analysis rules out an effect of intensive glycaemic control on all cause mortality larger than a 10% reduction in relative risk. Even though the conventional meta-analyses of non-fatal myocardial infarction, composite microvascular complications, and retinopathy indicated a statistically significant effect estimate, trial sequential analysis showed that sufficient evidence was not yet available for a conclusion to be reached.
In addition to the differences between the glycaemic targets among the trials, the conventional treatment groups as well as the anti-diabetes interventions used to achieve the targets differed among the trials. Furthermore, the measurement used to assess the levels of glycaemic control varied among the included trials. Some trials defined the target glucose values by using blood glucose, providing only a “snapshot” of the overall glycaemic control. Most of the included trials expressed glycaemic control and glycaemic targets in values of HbA1c, reflecting an average of the blood glucose concentration over several weeks. We were unable to evaluate the effects of the specific anti-diabetes drugs used to achieve the glycaemic targets. A wide range of glucose lowering interventions were used to achieve the glycaemic goal within and among the trials. In the ACCORD and the ADVANCE trials, a greater proportion of the participants randomised to intensive glycaemic control received rosiglitazone compared with the conventional treatment group.4 5 We have not been able to quantify any drug specific effects on our outcomes that may counteract or contribute to both benefits and harms of glycaemic control. The most suitable way to answer the specific question of whether the target in itself affects outcomes important to patients would be to include only trials that used one blood glucose lowering drug exclusively to receive a predefined glycaemic target. However, such a design would seem to be inapplicable to clinical practice.
The participants in the included trials represented a diverse population with type 2 diabetes. The results of our review should be interpreted with this in mind. The diagnosis of type 2 diabetes varied among the trials, and some trials used a definition of type 2 diabetes that may have included participants with impaired glucose tolerance. Some of the trials included only participants with newly diagnosed type 2 diabetes, whereas others included patients with longer duration of type 2 diabetes. Participants’ age, body mass index, glycaemic control, and duration of diabetes were in keeping with what might be expected in clinical practice. In spite of this, for several effects of the intervention on outcomes, we found no or only moderate heterogeneity. Furthermore, we found no significant subgroup differences when we stratified for the diagnostic criteria used for inclusion in the trials. Although we included a broad spectrum of patients with type 2 diabetes and, owing to potential selection bias—for instance, towards healthier and more motivated patients volunteering in a clinical trial compared with the background population of patients—saying how typical the participants in each clinical trial may be compared with the wider general population of patients with type 2 diabetes is difficult. On the other hand, the heterogeneity in this review might indeed reflect the well known heterogeneity in clinical practice.
The reporting of severe hypoglycaemia is problematic in several ways; first of all, the definitions of severe hypoglycaemia were diverse. Many of the trials included assistance from another person, without further specification. The grade of assistance from another person may vary from handing a juice to giving glucagon injections. In addition, the design of the included trials made blinding the participants impossible, which may in turn lead to reporting bias.15
Many of the included trials were not designed or powered to assess our predefined outcomes, which explains the insufficient data from these trials. Furthermore, for some outcomes only a few trials could provide data. This increases the risk of outcome measure reporting bias.15
Relation to other studies and reviews
The UGDP was the first “large scale,” multicentre clinical trial on the topic. It did not find any differences in mortality and cardiovascular outcomes between targeting intensive or conventional glycaemic control with insulin.88 The much larger UKPDS also failed to show a benefit on mortality or cardiovascular outcomes for targeting intensive glycaemic control with insulin or a sulfonylurea.8 However, a small subgroup of 753 overweight patients randomly assigned to intensive glycaemic control with metformin showed a benefit of intensive glycaemic control.100 Post hoc observational data from the UKPDS suggested that a 1% decrease in HbA1c reduced the risk of non-fatal myocardial infarction by 14%.1 A 10 year follow-up of the initial randomised groups in the UKPDS suggested long term beneficial effects of intensive glucose control on cardiovascular disease and mortality with both metformin and sulfonylurea-insulin regimens. Our analysis indicated a significant 15% reduction in relative risk of non-fatal myocardial infarction in favour of intensive glycaemic control. However, this was not confirmed when challenged for a 10% relative risk reduction in trial sequential analysis with adjustment for repetitive testing on accumulating and sparse data. A potential explanation for the magnitude of beneficial effects of lower glucose concentrations being more pronounced in observational studies than in randomised trials and prospective studies is the effects of confounding by indication in the observational studies.
Recently, two large trials attempted to answer the question of whether intensive glycaemic control is superior to conventional glycaemic control.4 5 Worries arose as the results from the ACCORD trial in 2008 showed increased all cause mortality and cardiovascular mortality with intensive glycaemic control compared with conventional glycaemic control. The increased mortality led to early termination of the ACCORD trial. On the other hand, the ACCORD trial showed a reduction in the risk of non-fatal myocardial infarction with intensive glycaemic control. The question remains why the ACCORD trial reported increased mortality but a reduced risk of non-fatal myocardial infarction. Recently, data from the follow-up period, after termination of the intensive glycaemic intervention arm, have been published and reported that the increased risk of mortality and reduced risk of non-fatal myocardial infarction have persisted.122 Explanations for this finding have been sought by the authors of the ACCORD trial, but no firm evidence has been found.
Observational data from the UKPDS showed a 37% reduction in the risk of microvascular complications for each 1% decrease in HbA1c.1 The ADVANCE trial found a 14% relative risk reduction for major microvascular events when targeting intensive glycaemic control.75 The UKPDS 33 showed a 25% risk reduction in microvascular outcomes when targeting intensive glycaemic control.8 We found a 12% relative risk reduction for the composite microvascular outcome. We found a 20% relative risk reduction for retinopathy in favour of intensive glycaemic control. The absolute risk reduction was 3%.
The Kumamoto trial showed a pronounced reduction in the incidence of nephropathy in both the primary prevention cohort (11.5% v 43.5%) and the secondary intervention cohort (16% v 40%) when targeting intensive glycaemic control.7 The ADVANCE trial showed a 21% relative risk reduction for nephropathy when targeting intensive glycaemic control, whereas this could not be shown in ACCORD.5 74 We found no significant effect of glycaemic intervention on the risk of nephropathy.
Microvascular data from the ACCORD trial and the UKPDS indicate that the beneficial effects of intensive glycaemic control on microvascular disease take more than about five years to emerge or that the benefits on microvascular disease achieved by intensive glycaemic control are less pronounced for patients with advanced type 2 diabetes (ACCORD) than for patients with new onset of type 2 diabetes (UKPDS).8 74 On the other hand, the meta-analysis of retinopathy indicated that patients with more advanced stages of type 2 diabetes (ACCORD, VADT) might benefit more from intensive glycaemic control than do patients newly diagnosed as having type 2 diabetes (UKPDS, UGDP).6 8 74 91
We identified severe hypoglycaemia as a serious adverse effect strongly associated with intensive glucose control, which seems to be in accordance with established knowledge and other meta-analyses.114 116 117 We did not have access to trial data at the level of the patient, so we could not explore whether an association exists between severe hypoglycaemic events and the risk of sudden unexpected death.
In January 2010 the American Diabetes Association published a guideline recommending an HbA1c goal of less than 7% to reduce microvascular complications.10 Treatment targets of HbA1c at 7% have been used in only three trials exclusively dealing with glycaemic control in usual care setting, and they are all of relatively small sample size, consisting in total of 234 participants.7 82 85 Only one of these trials had a duration of more than one year.7
Conclusion
We found evidence to refute the suggestion that intensive compared with conventional glycaemic control reduces all cause mortality with a relative risk reduction of 10% or more. We found insufficient information to confirm or exclude a 10% relative risk reduction in cardiovascular mortality and non-fatal myocardial infarction with intensive glycaemic control. We found insufficient evidence for a reduction in risk of composite microvascular complications, retinopathy, and nephropathy. Conversely, we confirmed a 30% increase in relative risk of severe hypoglycaemia with intensive compared with conventional glycaemic control. Accordingly, treatment and choice of a glycaemic target for patients with type 2 diabetes need to take both harms and benefits into account.
What is already known on this topic
Patients with type 2 diabetes are at increased risk of macrovascular and microvascular disease
Uncertainty exists as to whether intensive glycaemic control reduces the risk of death, macrovascular disease, or microvascular disease
Only a few meta-analyses with a high risk of bias have estimated the effect of intensive glycaemic control on microvascular complications
What this study adds
Sufficient evidence exists for an absence of a 10% relative risk reduction in all cause mortality with intensive glycaemic control versus conventional glycaemic control in patients with type 2 diabetes
Insufficient evidence exists for a 10% relative risk reduction in cardiovascular mortality and non-fatal myocardial infarction
Insufficient evidence exists to support the conclusions that intensive glycaemic control prevents the occurrence of microvascular disease assessed as a composite outcome, retinopathy, or nephropathy
Sufficient evidence exists that intensive glycaemic control increases the risk of severe hypoglycaemia by 30% compared with conventional glycaemic control
Notes
Cite this as: BMJ 2011;343:d6898
Footnotes
We thank Bern Richter and the Cochrane Metabolic and Endocrine Disorders Group for valuable assistance. We thank Sarah Klingenberg, trials search co-ordinator of the Cochrane Hepato-Biliary Group, for her assistance in developing the search strategy. Thanks to Dimitrinka Nikolova from the Cochrane Hepato-Biliary Group for advising during the writing process and for translating and extracting data from a Russian article. We thank Warwick Bagg, the DIGAMI 2 Study Group, Peter Gaede and Oluf Borbye Pedersen, John F Service, Alexander Stefanidis, Camilla Hage, and Denise Bonds for answering our requests for information on trials.
This review is also published as a Cochrane review in the Cochrane Database of Systematic Reviews 2011, Issue 6. Cochrane reviews are regularly updated as new evidence emerges and in response to comments and criticisms, and the Cochrane Database of Systematic Reviews should be consulted for the most recent version of the review.
Contributors: BH developed the protocol, was responsible for the searches, selected trials, extracted data, assessed risk of bias of trials, did the data analysis, and developed the final review. SSL developed the protocol, selected trials, and developed the final review. CG developed the protocol, selected trials, advised on statistical methods, and developed the final review. AV developed the protocol, selected trials, and developed the final review. TA developed the protocol, selected trials, extracted data, assessed risk of bias of trials, and developed the final review. CH selected trials, extracted data, assessed risk of bias of trials, analysed data, and developed the final review. JW developed the initial idea for the review, developed the protocol, selected trials, advised on statistical methods, analysed data, and developed the final review. All authors read and approved the final manuscript. BH and JW are the guarantors.
Competing interests: All authors have completed the ICMJE uniform disclosure form at www.icmje.org/coi_disclosure.pdf (available on request from the corresponding author) and declare that SSL, AV, and TA have reported equity in Novo Nordisk A/S; SSL and AV have received fees from Novo Nordisk A/S for speaking; TA is employed at Steno Diabetes Center, Gentofte, Denmark; AV and SSL were employed at Steno Diabetes Center at the time the review was written. Steno Diabetes Center is an academic institution owned by Novo Nordisk A/S. CH has been employed at Novo Nordisk after completion of the data extraction.
Ethical approval: Not needed.
Funding: The study was funded by the Copenhagen Trial Unit, Rigshospitalet, Denmark; the Cochrane Metabolic and Endocrine Disorders Group, Germany; and the Copenhagen Insulin and Metformin Therapy Group. The Copenhagen Insulin and Metformin Therapy Group had no role in the design and conduct of the study; the extraction, management, analysis, or interpretation of the data; or the preparation, review, or approval of the manuscript.
Data sharing: No additional data available.
This is an open-access article distributed under the terms of the Creative Commons Attribution Non-commercial License, which permits use, distribution, and reproduction in any medium, provided the original work is properly cited, the use is non commercial and is otherwise in compliance with the license. See: http://creativecommons.org/licenses/by-nc/2.0/ and http://creativecommons.org/licenses/by-nc/2.0/legalcode.